


Abstract
Background Several studies in older people have shown that grip strength predicts all-cause mortality. The mechanisms are unclear. Muscle strength declines with age, accompanied by a loss of muscle mass and an increase in fat, but the role that body composition plays in the association between grip strength and mortality has been little explored. We investigated the relation between grip strength, body composition, and cause-specific and total mortality in 800 men and women aged 65 and over.
Methods During 197374 the UK Department of Health and Social Security surveyed random samples of men and women aged 65 and over living in eight areas of Britain to assess the nutritional state of the elderly population. The survey included a clinical examination by a geriatrician who assessed grip strength and anthropometry. We used Cox proportional hazards models to examine mortality over 24 years of follow-up.
Results Poorer grip strength was associated with increased mortality from all-causes, from cardiovascular disease, and from cancer in men, though not in women. After adjustment for potential confounding factors, including arm muscle area and BMI, the relative risk of death in men was 0.81 (95% CI 0.700.95) from all-causes, 0.73 (95% CI 0.600.89) from cardiovascular disease, and 0.81 (95% CI 0.660.98) from cancer per SD increase in grip strength. These associations remained statistically significant after further adjustment for fat-free mass or % body fat.
Conclusion Grip strength is a long-term predictor of mortality from all-causes, cardiovascular disease, and cancer in men. Muscle size and other indicators of body composition did not explain these associations.
Several studies have shown that poor grip strength predicts increased all-cause mortality in older people.1–6 The underlying mechanisms are poorly understood. The association persists after adjustment for body size and does not appear to be explained by nutritional status, the presence of chronic disease, or degree of physical activity. Little is known about the influence of grip strength on mortality from specific causes. In the only previous study into this relation—in a cohort of disabled women—poorer grip strength was linked with increased mortality from cardiovascular and respiratory disease, though not from cancer.6
Muscle strength is known to decline with age, accompanied by a loss of muscle mass and an increase in fat.7–9 There is evidence that body composition may influence mortality in older people,10,11 but whether it plays a part in the association between grip strength and mortality in older people has been little explored.
During 197374 the Department of Health and Social Security surveyed random samples of men and women aged 65 and over living in eight areas of Britain to assess the nutritional state of the elderly population. The areas were chosen so that the socioeconomic characteristics of the study sample were representative of older people in Britain who were living at home. In addition to the assessment of their diet and physical activity, the participants underwent a clinical examination by a geriatrician, which included anthropometry and measurement of grip strength. We explored how muscle strength and body composition influenced cause-specific and total mortality in a 24 year follow-up study of this national sample.
Materials and methods
Participants
During 1973 and 1974, 1775 people in eight areas of Britain (5 in England, 2 in Scotland, and 1 in Wales) were randomly sampled from family practitioner committees’ lists of all patients aged 65 years and over. The areas were Islington, Harrow, Hastings, Bristol, Salford, Rutherglen, Angus, and Merthyr Tydfil. Stratified sampling was used to obtain equal numbers of men and women aged 6574, and 75 and over.
Of the participants selected, 1688 were living at home and were invited to take part in the study; 1419 (84%) agreed. In all, 983 (69%) of those who participated in the nutritional survey agreed to be examined by a geriatrician.
Nutritional survey
Participants kept a diary of every item of food or drink consumed over a week. They were provided with a set of scales to weigh each item. An interviewer visited them at least four times during the week. If the participants were unable to cope with the weighing procedure, the interviewer used the food diary to quantify their consumption; food purchases were used as a cross check. Nutrient intake was calculated by using a food composition table compiled by the Department of Health and Social Security. As part of the survey, participants were asked whether they had lost or gained weight in the previous few months. They were also asked whether they engaged in any hobbies or activities away from home and, if so, how much physical activity was involved.
Clinical examination
The geriatricians measured height, weight, mid-arm circumference, and skinfold thickness at four sites (biceps, triceps, subscapular, and suprailiac), three times at each site. They questioned participants about their smoking habits and medications taken in the previous 6 months and took a sample of blood for biochemical and haematological analysis. Grip strength of the right and left hands was measured three times using isometric dynometry. After the examination, the geriatricians recorded diagnoses of disease according to the International Classification of Diseases categories.
Mortality follow-up
Of the 983 participants examined by a geriatrician, 921 (95%) were traced through the NHS central register. We obtained death certificates for those who had died and all causes of death entered in parts I and II were coded according to the International Classification of Diseases (ninth revision). All cases where cardiovascular disease (codes 390459), cancer (140208), or respiratory disease (codes 462519) were mentioned on the death certificate were counted as deaths from these causes.
Statistical analysis
Body mass index (BMI) was calculated as weight (in kg)/height2 (in metres). The averages of the triplicate skinfold thickness measurements at each site were taken and the % body fat was derived using the four average skinfold thickness measurements in the formulae devised by Durnin and Wormesley.12 Fat mass was derived by multiplying body weight by % body fat. Fat-free mass was derived by subtracting fat mass from body weight. Corrected arm muscle area, corrected for bone, was calculated from triceps skinfold thickness and mid-arm circumference using formulae devised by Heymsfield et al.13 Based on criteria outlined by the World Health Organization (WHO),14 BMI was classified into the following groups: underweight (<18.5), normal (18.524.99), overweight (2529.99), and obese (≥30). The best of the six grip strength measurements was selected for use in analysis. Nutrient intake variables were skewed and were transformed to normality using logarithms. The characteristics of the men and women in the study were compared using t-test or χ2-test as appropriate. A Cox proportional hazards model was used to examine the associations between grip strength, body composition measures and mortality over the 24 year follow-up period based on deaths that occurred before January 1, 1999. We analysed men and women separately as the relation between BMI and % body fat and mortality differed between the sexes (P for interaction terms <0.01). The results are presented as relative risks (hazard ratios) per SD increase in grip strength and body composition measures. Risk estimates were adjusted for age in 5 year strata. Models including BMI or % body fat were also fitted with BMI squared or % body fat squared in order to assess whether there were any significant J-shaped or U-shaped associations.
The analyses that follow are based on the 800 men and women who were examined by a geriatrician and had complete data on all anthropometric and body composition variables. Comparison of these 800 men and women with the 436 study participants who declined to be examined by a geriatrician showed that there was no difference between them in age but that those who agreed to a clinical examination were more likely than those who declined to be male (56.5% vs 41.1%, P < 0.001) and from non-manual social classes (36.3% vs 28.1%, P = 0.02).
Results
Selected baseline characteristics of the 800 people in the study (452 men and 348 women) are shown in Table 1. As expected, there were significant differences between the sexes in all body composition variables and in grip strength. Men had a higher daily calorie intake than women. They were more likely than women to be current smokers and to report that they engaged in hobbies that involved high levels of physical activity. They had a slightly lower prevalence of disease, diagnosed at the clinical examination, but there was no difference between them in their assessment of whether their weight had changed in the previous 6 months. There was also no difference between the sexes in social class distribution.
Characteristics of the study participants
| Men (n = 452) | Women (n = 348) | |
|---|---|---|
| Age, y | 74.7 (5.8) | 74.4 (6.1) |
| Height, m | 1.67 (0.72) | 1.55 (0.67) |
| Weight, kg | 67.6 (11.9) | 60.1 (11.3) |
| BMI, kg/m2 | 24.1 (3.70) | 25.1 (4.48) |
| % body fat | 21.2 (5.4) | 32.0 (4.4) |
| Fat-free mass, kg | 52.8 (7.5) | 40.6 (6.2) |
| Corrected arm muscle area, cm2 | 44.9 (10.8) | 37.3 (10.8) |
| Grip strength, kg | 68.7 (15.7) | 46.1 (10.6) |
| Daily calorie intake, kcala | 2106 (1.29) | 1549 (1.28) |
| Current smoker, n (%) | 237 (52.4) | 65 (18.7) |
| Recent weight change, n (%) | ||
| No | 370 (81.9) | 277 (80.8) |
| Lost weight | 43 (9.5) | 30 (8.7) |
| Gained weight | 39 (8.6) | 36 (8.7) |
| Disease diagnosed at clinical exam, n (%) | 390 (86.3) | 322 (92.5) |
| Activities away from home, n (%) | ||
| No activities | 185 (41.1) | 155 (44.8) |
| High physical activity | 49 (10.9) | 16 (4.6) |
| Low physical activity | 138 (30.7) | 139 (40.2) |
| Both high and low physical activity | 65 (8.2) | 277 (34.8) |
| Social class, n (%) | ||
| Non-manual | 157 (34.4) | 133 (38.4) |
| Manual | 299 (65.6) | 213 (61.6) |
Values are means (SD) unless otherwise indicated.
aGeometric mean (SD).
There was a strong inverse association between grip strength and age (r = −0.43, P < 0.001). Partial correlation coefficients, adjusted for age and sex, showed that grip strength was more strongly correlated with height (r = 0.31, P < 0.001), fat-free mass (r = 0.28, P < 0.001), and corrected arm muscle area (r = 0.28, P < 0.001) than with BMI (r = 0.11, P < 0.001) or % body fat (r = 0.09, P = 0.008). Grip strength tended to be poorer in people with a lower calorie intake (r = 0.17, P < 0.001). Mean grip strength, adjusted for age and sex, was also poorer in people who reported that they had lost weight compared with those whose weight had remained stable, 54.8 vs 58.6 kg (P = 0.03), in smokers compared with non-smokers, 56.7 vs 58.7 kg (P = 0.04), in people with diagnosed disease compared with those who were healthy, 57.4 vs 62.7 kg (P < 0.001), in those who reported having no hobbies outside the home compared with those who had hobbies involving high levels of physical activity, 56.9 vs 60 kg (P = 0.04), and in those from manual compared with non-manual social classes, 58.2 vs 60.4 (P = 0.004). All these associations were similar in men and women.
Over the 24 year follow-up period, there were 756 deaths, 441 in men and 315 in women. The crude all-cause mortality rate was 102.7 per 1000 person-years (124.8 per 1000 person-years in men and 82.3 per 1000 person-years in women). Table 2 shows the relative risks of death from all causes per SD increase in grip strength and measures of body composition. Risk estimates are shown for men and women separately, adjusted for age, and then further adjusted for the potential confounding factors, height, smoking, social class, physical activity, diagnosed disease at baseline, calorie intake, reported weight loss, and the measures of body composition. Correlation coefficients between BMI and % body fat were 0.74 in both sexes, while those between BMI and fat-free mass were 0.73 in men and 0.79 in women. To avoid potential problems with collinearity, fat-free mass, % body fat, and BMI were added to multivariate models separately.
Relative risks (95% CI) of all-cause mortality per SD increase in grip strength and body composition measures
| Age-adjusted | Multivariate-adjusted,a model 1 includes fat-free mass | Multivariate-adjusted,a model 2 includes % body fat | Multivariate-adjusted,a model 3 includes BMI | |
|---|---|---|---|---|
| Men | ||||
| Grip strength | 0.77 (0.680.87) | 0.81 (0.690.94) | 0.81 (0.700.94) | 0.81 (0.700.95) |
| Arm muscle area | 0.81 (0.730.89) | 0.84 (0.720.98) | 0.86 (0.760.98) | 0.89 (0.761.03) |
| Fat-free mass | 0.85 (0.750.97) | 1.05 (0.851.29) | – | – |
| % body fat | 0.79 (0.690.90) | – | 0.80 (0.700.92) | – |
| BMI | 0.84 (0.740.94) | – | – | 0.94 (0.811.09) |
| Women | ||||
| Grip strength | 0.81 (0.670.97) | 1.11 (0.861.43) | 1.10 (0.861.40) | 1.04 (0.811.32) |
| Arm muscle area | 0.90 (0.801.02) | 0.88 (0.731.06) | 0.94 (0.811.08) | 0.91 (0.771.08) |
| Fat-free mass | 0.96 (0.791.15) | 1.09 (0.821.45) | – | – |
| % body fat | 0.27 (0.061.26) | – | 0.41 (0.053.13) | – |
| % body fat squared | 2.82 (0.7910.0) | – | 2.03 (0.3810.9) | |
| BMI | 0.25 (0.110.59) | – | – | 0.26 (0.100.68) |
| BMI squared | 4.00 (1.739.24) | – | – | 3.83 (1.499.84) |
aMultivariate models include age, height, social class, smoking, reported change in weight, daily calorie intake, physical activity, diagnosed disease at baseline, and other variables in the table, though to avoid potential problems with collinearity, fat-free mass, % body fat, and BMI have been analysed in separate models.
In both men and women, better grip strength was associated with a significantly reduced risk of mortality from all causes in age-adjusted analyses. In women, this relation was weakened by further adjustment for the potential confounding factors and, separately, for fat-free mass, % body fat, or BMI. In men, adjustment for height, smoking, social class, physical activity, diagnosed disease at baseline, calorie intake, reported weight loss, and the measures of body composition had little effect on the association and it remained statistically significant. There was no evidence of a statistical interaction between grip strength and sex as regards mortality (P = 0.71). Figure 1 shows survival curves for the 24 year follow-up period for all-cause mortality according to thirds of the distribution of grip strength in men and women.
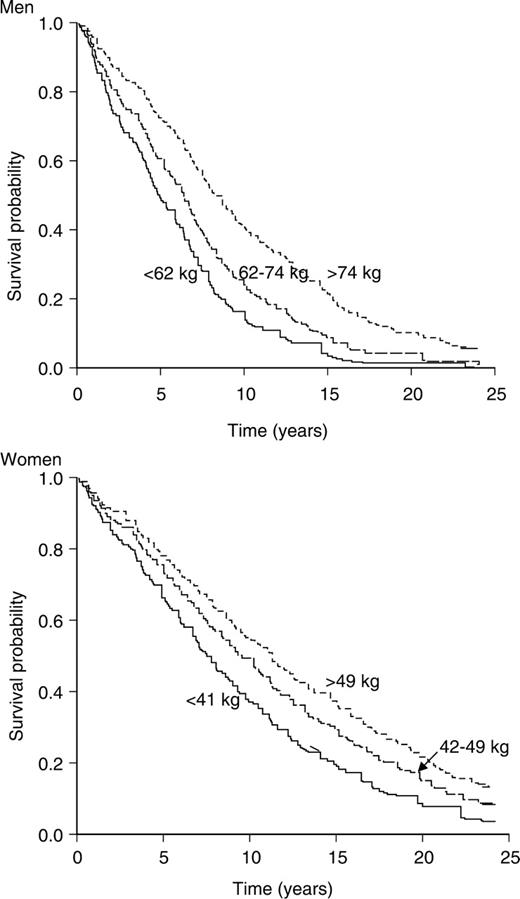
Kaplan–Meier survival curves for all-cause mortality according to thirds of the distribution of grip strength in men and women
The relation between % body fat and BMI and mortality differed between the sexes (p for interaction terms <0.01). In men, there was a linear relation between these variables and mortality, with a higher % body fat or higher BMI associated with a lower risk of death. BMI ceased to be a significant predictor of all-cause mortality in men, after adjustment for grip strength and the potential confounding variables, but the relation between higher % body fat and mortality persisted after multivariate adjustment. In women, there was a weak quadratic relation between % body fat and mortality that was weakened by multivariate adjustment. There was a statistically significant quadratic relation in women between BMI, analysed as a continuous variable, and mortality that persisted in multivariate analysis, though when relative risks were calculated according to WHO classifications, the increased risk of death in the underweight and obese groups did not reach statistical significance. Compared with those with a normal BMI, the multivariate-adjusted risk of death was 1.41 (95% CI 0.92.38) in those with a BMI of <18.5 kg/m2, 1.00 (95% CI 0.741.34) in those with a BMI of 2529.9 kg/m2, and 1.14 (95% 0.761.71) in those with a BMI ≥30 kg/m2.
Over the follow-up period, there were 488 deaths where cardiovascular disease was the underlying or a contributory cause. The crude mortality rate was 66.4 per 1000 person-years (76.4 in men and 57.2 in women). As with all-cause mortality, risk of death from cardiovascular disease was reduced in men and women with better grip strength (Table 3). In women, this relation was weakened by multivariate adjustment, but in men the association remained statistically significant after adjustment for potential confounders and for measures of body composition. There were no significant associations between risk of death from cardiovascular disease and arm muscle area or fat-free mass in either sex in multivariate analyses. There was a statistically significant quadratic association between BMI, analysed as a continuous variable, and risk of cardiovascular mortality in women that persisted after multivariate adjustment, though, as with all-cause mortality, this did not reach statistical significance when risks were expressed according to WHO categories: compared with those with a normal BMI, risk of cardiovascular mortality was 1.55 (95% CI 0.852.8) in those with a BMI of <18.5 kg/m2, 1.04 (95% CI 0.71.5) in those with a BMI of 2529.9 kg/m2, and 1.20 (95% CI 0.761.9) in those with a BMI ≥30 kg/m2. In men, having a higher BMI or a higher % body fat tended to be associated with a reduced risk of death from cardiovascular disease, though after multivariate adjustments these relations were not statistically significant.
Relative risks (95% CI) of cardiovascular mortality per SD increase in grip strength and body composition measures
| Age-adjusted | Multivariate-adjusted,a model 1 includes fat-free mass | Multivariate-adjusted,a model 2 includes % body fat | Multivariate-adjusted,a model 3 includes BMI | |
|---|---|---|---|---|
| Men | ||||
| Grip strength | 0.70 (0.600.82) | 0.71 (0.590.86) | 0.72 (0.600.87) | 0.73 (0.600.89) |
| Arm muscle area | 0.83 (0.730.95) | 0.86 (0.701.04) | 0.91 (0.781.06) | 0.91 (0.751.10) |
| Fat-free mass | 0.86 (0.731.01) | 1.08 (0.821.41) | – | – |
| % body fat | 0.84 (0.710.99) | – | 0.88 (0.731.05) | – |
| BMI | 0.87 (0.751.00) | – | – | 0.97 (0.811.17) |
| Women | ||||
| Grip strength | 0.79 (0.630.99) | 1.03 (0.761.38) | 1.09 (0.821.45) | 1.02 (0.771.36) |
| Arm muscle area | 0.98 (0.841.13) | 0.95 (0.761.18) | 0.99 (0.831.17) | 0.94 (0.781.14) |
| Fat-free mass | 0.97 (0.781.21) | 1.05 (0.751.48) | – | – |
| % body fat | 0.44 (0.063.41) | – | 1.10 (0.713.9) | – |
| % body fat squared | 2.00 (0.3810.6) | – | 1.04 (0.129.94) | – |
| BMI | 0.21 (0.090.58) | – | – | 0.17 (0.60.54) |
| BMI squared | 4.87 (1.8512.83) | - | - | 5.74 (1.9317.1) |
aMultivariate models include age, height, social class, smoking, reported change in weight, daily calorie intake, physical activity, diagnosed disease at baseline, and other variables in the table, though to avoid potential problems with collinearity, fat-free mass, % body fat, and BMI have been analysed in separate models.
Over the follow-up period, there were 425 deaths where cancer was an underlying or contributory cause. The crude mortality rate was 58 per 1000 person-years (77.0 in men and 40.4 in women). Risk of dying from cancer was reduced in men with better grip strength, and this association remained statistically significant after multivariate adjustment for potential confounding factors and for measures of body composition (Table 4). In women, the relation between grip strength and risk of death from cancer ceased to be statistically significant in multivariate analyses. In men, a higher BMI or a higher % body fat was associated with a reduced risk of dying from cancer that persisted after multivariate adjustment. In women, there was a quadratic association between BMI and risk of dying from cancer in age-adjusted analysis, but this ceased to be statistically significant after multivariate adjustment. There were no significant associations between risk of death from cancer and arm muscle area or fat-free mass in either sex in multivariate analyses.
Respiratory disease was the third most frequent cause of death mentioned on death certificates (n = 314). The crude mortality rate was 43.1 per 1000 person-years (55.7 in men and 31.5 in women). Better grip strength was associated with reduced mortality from respiratory disease in both sexes in age-adjusted analyses, but these relations were not statistically significant once adjusted for potential confounding variables and for measures of body composition (Table 5). None of the measures of body composition were significant predictors of death from respiratory disease after multivariate adjustment.
Relative risks of cancer mortality per SD increase in grip strength and body composition measures
| Age-adjusted | Multivariate-adjusted,a model 1 includes fat-free mass | Multivariate-adjusted,a model 2 includes % body fat | Multivariate-adjusted,a model 3 includes BMI | |
|---|---|---|---|---|
| Men | ||||
| Grip strength | 0.73 (0.630.85) | 0.81 (0.660.99) | 0.79 (0.650.97) | 0.81 (0.660.98) |
| Arm muscle area | 0.77 (0.680.88) | 0.82 (0.670.99) | 0.82 (0.700.97) | 0.80 (0.721.07) |
| Fat-free mass | 0.79 (0.670.93) | 1.04 (0.791.37) | – | – |
| % body fat | 0.76 (0.640.90) | – | 0.77 (0.650.92) | – |
| BMI | 0.83 (0.710.95) | – | – | 0.83 (0.710.97) |
| Women | ||||
| Grip strength | 0.79 (0.630.99) | 1.03 (0.761.38) | 1.28 (0.891.83) | 1.18 (0.831.68) |
| Arm muscle area | 0.98 (0.841.13) | 0.95 (0.761.18) | 0.93 (0.141.17) | 0.80 (0.631.01) |
| Fat-free mass | 0.97 (0.781.21) | 1.05 (0.751.48) | – | – |
| % body fat | 0.36 (0.043.34) | – | 1.09 (0.801.51) | – |
| % body fat squared | 2.23 (0.3613.8) | – | 1.66 (0.1420.3) | – |
| BMI | 0.29 (0.090.96) | – | – | 0.38 (0.101.52) |
| BMI squared | 3.53 (1.1011.3) | – | – | 2.58 (0.6510.2) |
aMultivariate models include age, height, social class, smoking, reported change in weight, daily calorie intake, physical activity, diagnosed disease at baseline, and other variables in the table, though to avoid potential problems with collinearity, fat-free mass, % body fat, and BMI have been analysed in separate models.
Relative risks of respiratory mortality per SD increase in grip strength and body composition measures
| Age-adjusted | Multivariate-adjusted,a model 1 includes fat-free mass | Multivariate-adjusted,a model 2 includes % body fat | ultivariate-adjusted,a model 3 includes BMI | |
|---|---|---|---|---|
| Men | ||||
| Grip strength | 0.72 (0.600.89) | 0.80 (0.631.02) | 0.79 (0.630.98) | 0.80 (0.631.01) |
| Arm muscle area | 0.76 (0.650.89) | 0.83 (0.651.06) | 0.86 (0.711.03) | 0.90 (0.721.13) |
| Fat-free mass | 0.78 (0.640.95) | 1.06 (0.761.46) | – | – |
| % body fat | 0.74 (0.610.90) | – | 0.79 (0.630.99) | – |
| BMI | 0.84 (0.710.99) | – | – | 0.91 (0.731.15) |
| Women | ||||
| Grip strength | 0.72 (0.530.99) | 1.16 (0.741.81) | 1.04 (0.671.59) | 1.01 (0.671.54) |
| Arm muscle area | 0.80 (0.650.98) | 0.77 (0.561.07) | 0.91 (0.691.18) | 0.80 (0.611.06) |
| Fat-free mass | 0.96 (0.701.31) | 1.33 (0.832.14) | – | – |
| % body fat | 0.87 (0.651.17) | – | 1.07 (0.741.53) | – |
| BMI | 0.14 (0.040.51) | – | – | 0.22 (0.051.01) |
| BMI squared | 6.77 (1.9323.7) | – | – | 4.88 (1.0921.9) |
aMultivariate models include age, height, social class, smoking, reported change in weight, daily calorie intake, physical activity, diagnosed disease at baseline, and other variables in the table, though to avoid potential problems with collinearity, fat-free mass, % body fat, and BMI have been analysed in separate models.
We explored whether the associations described above might be explained by serious illness at the time of the survey by restricting the multivariate analyses to participants who survived for at least 5 years after the clinical examination. The apparent protective effect on all-cause or cancer mortality in men of a higher % body fat or a higher BMI disappeared once early deaths were excluded. The ‘reversed J-shaped’ association in women between BMI and risk of all-cause and cardiovascular mortality remained statistically significant and became stronger once deaths in the first 5 years were excluded: compared with women with a normal BMI, women with a BMI <18.5 kg/m2 had a risk of all-cause mortality of 2.03 (95% CI 1.153.59) and a risk of cardiovascular mortality of 2.44 (95% CI 1.254.77), after multivariate-adjustment, while those with a BMI ≥30 kg/m2 had a multivariate-adjusted risk of all-cause mortality of 1.41 (95% CI 1.502.07) and of cardiovascular mortality of 1.62 (95% CI 1.032.55). Having a BMI of 2529 kg/m2 was not associated with increased risk of either all-cause (1.05, 95% CI 0.761.45) or cardiovascular mortality (1.10, 95% CI 0.731.63). The relations between grip strength and all-cause, cardiovascular, and cancer mortality in men all remained statistically significant and became slightly stronger when deaths in the first 5 years of follow-up were excluded. For 1 SD increase in grip strength, the multivariate-adjusted risks of all-cause, cardiovascular, and cancer mortality were 0.78 (95% CI 0.630.95), 0.73 (95% 0.560.94), and 0.73 (95% CI 0.560.95), respectively.
Discussion
In this 24 year follow-up study of elderly men and women, poorer grip strength was associated with increased mortality from all causes, cardiovascular disease, and cancer in men, though not in women, after adjustment for age, height, smoking, reported weight change, physical activity, calorie intake, and diagnosed disease at baseline. Grip strength at baseline was strongly positively correlated with corrected arm muscle area and fat-free mass, and, more weakly, with % body fat and BMI. These indicators of body composition did not explain the association in men between grip strength and mortality.
Few previous studies of the relation between grip strength and mortality have examined the role that muscle size plays in the association. In a follow-up study of men in the Baltimore Longitudinal Study of Aging, grip strength at baseline was a significant predictor of all-cause mortality in men aged 60 and over, whereas rate of change in grip strength was predictive in men aged under 60.4 Men with a lower 24 h creatinine excretion, used as an estimate of muscle mass, had an increased risk of death but adjustment for this factor strengthened the association between grip strength, or rate of change in strength, and mortality suggesting that the relation was not due to the amount of muscle in these men. More recently, results from the Health, Aging and Body Composition Study, showed that although poorer grip strength was associated with increased all-cause mortality, low muscle mass, measured by CT scan and DXA, was not strongly related to mortality.15 In our study, we had data on corrected arm muscle area and fat-free mass, but neither of these explained the increased mortality associated with poorer grip strength in men. As regards mortality from specific causes, grip strength was not significantly related to risk of death from respiratory disease after adjustment for other risk factors, but it was strongly predictive of mortality in men from cardiovascular disease and cancer, and these associations remained after control for corrected arm muscle area and other measures of body composition. These findings suggest that the influence of grip strength on survival may have more to do with the effectiveness with which muscle functions than its size. As poorer grip strength has been associated with higher fasting insulin levels, both cross-sectionally and longitudinally, it seems likely that muscle weakness may precede the development of insulin resistance.16,17 This may help to account for the link between poorer grip strength and increased risk of death from cardiovascular disease found in men in the current study and in a cohort of elderly disabled women.6 In the latter study, grip strength was significantly associated with risk of death from respiratory disease as well as from cardiovascular disease, though not from cancer. The lack of association between grip strength and respiratory mortality in our smaller study may be due to reduced statistical power.
The fact that we found no statistically significant associations between grip strength and mortality in women may be a reflection of the relatively small number of women who took part in the clinical examination. There was no indication of a statistical interaction between grip strength and sex. Grip strength has been shown to predict mortality in previous studies of women, but these studies were based on considerably larger numbers.1,6
Most of the studies into the relation between grip strength and mortality have been carried out in elderly people. But findings in a population of healthy men that grip strength measured in middle age predicts long-term risk of death suggest that influences affecting muscle size and function earlier in life may be important.18 Greater strength tends to be associated with tallness so it may in part be an indicator of better nutrition in the first years of life, though observations in cohorts of middle-aged and elderly people that those who had weighed more at birth had significantly better grip strength, independently of current height and weight, implies that fetal development is a major determinant of muscle strength.19,20
The prognostic importance of increased BMI in older people has been controversial.21 A recent systematic review concluded that mild to moderate overweight, defined as a BMI of 2527 kg/m2, was not linked with higher mortality in elderly people, though there was evidence that those with a BMI of over 27 had an increased risk of death from all causes and from cardiovascular disease.22 In the current study, we too found no evidence in either sex that mild to moderate overweight was associated with increased mortality. There was a reverse-J-shaped association between BMI and mortality from all causes and cardiovascular disease, with the highest mortality occurring among those with a BMI of less than 18 kg/m2, and slightly increased mortality in those with a BMI ≥30 kg/m2 but this association was only present in women.
We found some evidence to link a higher % body fat or BMI in men with a lower mortality from all causes and cancer. These associations persisted after adjustment for potential confounding factors, including weight loss, though numbers reporting weight loss were low and longer-term weight loss might not have been identified. Weight loss over a period of several years, whether assessed by decrease in BMI,23 loss of fat mass, or loss of lean tissue,11,24 has been linked to increased mortality in previous studies of elderly people. In the present study, these associations appeared to be concentrated among people who died in the early years of follow-up, as they ceased to be statistically significant when the analysis was restricted to those who survived for at least 5 years after the clinical examination.
Our study has some limitations. At the time the nutritional survey was conducted, in 197374, anthropometry was the usual method of assessing body composition. The data collected may be less accurate than that obtainable with more modern methods such as dual energy X-ray absorptiometry.25 The results of the study are based on 800 participants. This is 47% of those originally invited to participate in the Department of Health and Social Security's nutritional survey. No data were available on the characteristics of those who declined to participate in the survey, so it is not possible to gauge how representative these 800 people were of those originally invited, though there were indications that of those who agreed to take part in the nutritional survey, women and those from manual social classes were less likely to agree to a clinical examination. All comparisons, however, have been made internally, so unless the relation between grip strength, body composition, and mortality is different in non-responders or in those we were unable to trace, no bias will have been introduced.
Our findings in this 24 year follow-up of a national cohort of people aged 65 and over that poorer grip strength predicted increased mortality in men from all causes, from cardiovascular disease, and from cancer, after adjustment for potential confounding factors including indicators of body composition, provide further evidence that the effectiveness with which muscle functions may be a more important long-term determinant of survival than its size. The explanation for the grip strength/mortality association remains unclear.
We thank the Department of Health for allowing us to use data from the 197374 Department of Health and Social Security's nutritional survey. The survey was coordinated by the late Professor A N Exton-Smith.
Conflict of interest: none of the authors has any conflict of interest.
Author contribution: C Gale analysed the data and wrote the first draft of the report. C Martyn, C Cooper, and A Aihie Sayer were involved in planning the analysis and contributed to the final version of the report.
Grip strength has been shown to predict all-cause mortality in older people, but less is known about its influence on risk of death from specific causes and on the role of body composition in the grip strength/mortality association.
In a 24 year follow-up of a national cohort aged 65 and over, grip strength was a strong, long-term predictor of mortality from all-causes, cardiovascular disease and cancer in men, though not in women.
Indicators of body composition did not explain these associations.
The effectiveness with which muscle functions may be a more important determinant of survival than muscle size.

