


Abstract
Background Our understanding of whether the use of acetaminophen and/or antibiotics in early life can cause allergic diseases in later childhood remains inconclusive. The objective of this study was to investigate the temporal relationship between exposure to acetaminophen and/or antibiotics in early life and the development of allergic diseases in later childhood, using two independent birth cohorts derived from the National Health Insurance Research Database (NHIRD) in Taiwan.
Methods The authors conducted a prospective birth cohort study of 263 620 children born in 1998 and 9910 children born in 2003, separately, from the NHIRD. Exposure status of acetaminophen and/or antibiotics and potential confounding factors were included in the analyses. Cox proportional hazards models were applied to determine the temporal relationship between acetaminophen and/or antibiotic exposure and the development of allergic diseases.
Results We observed a positive relationship between acetaminophen and/or antibiotic exposure during the 1st year of life and the subsequent development of the three examined allergic diseases (atopic dermatitis, asthma and allergic rhinitis) in the 1998 birth cohort, but the observed relationship of drug exposure in the 2003 cohort, especially for atopic dermatitis and asthma, was lower than for those in the 1998 cohort and was not statistically significant.
Conclusions Our findings provide suggestive evidence that the temporal effect of exposure to acetaminophen and/or antibiotics influences the development of common allergic diseases in later childhood. Further functional studies and/or animal studies are needed to better understand the underlying regulatory mechanisms driving this important clinical and public health issue.
Introduction
The World Allergy Organization White Book on Allergy 2011–20121 estimates that about 30–40% of the worldwide population is affected by one or more allergic conditions such as eczema, rhino-conjunctivitis, asthma and potentially life-threatening allergies to certain foods, drugs or other substances, which have become alarmingly common in our modern world. Despite this dramatic increase in the worldwide prevalence of allergic diseases that has influenced all age groups over the past 20 years, the aetiological factors influencing the development of allergic disorders still remain unknown.
Although there were regional variations in prescription rates, antibiotic use in early childhood against infection was markedly increased in the late 1980s and early 1990s.2 According to the ‘hygiene hypothesis’, it is rational to propose that an increase in exposure to antibiotics in early life reduces exposure to microorganisms and subsequently promotes T-helper type-2 (Th2)-predominant allergic immune responses.3 In particular, early symptoms of asthma such as wheezing and prolonged productive cough may be one of the reasons for the use of antibiotics in early life.4,5 Since the late 1990s, numerous cross-sectional, retrospective and prospective studies have been conducted to evaluate the association between early life exposure to acetaminophen and/or antibiotics and development of asthma/allergic diseases.4–11 However, the conclusions from these studies have been inconsistent and controversial, and may have been a result of different study designs, different analytical methods and the adjustment of various sets of confounding factors.
From the Phase 3 study of the International Study of Allergy and Asthma in Childhood (ISAAC), in two age groups of 6- to 7-year olds and 13- to 14-year olds, acetaminophen use represented an important risk factor for the development of asthma12 as well as for other childhood allergic disorders.13 In addition, a number of retrospective and prospective studies have documented the association between acetaminophen exposure and asthma.14–17 It is likely that the dramatic increase in childhood asthma over the past 30 years may be due to the increased use of acetaminophen. However, this association was confounded by indication (increased viral illnesses or fever that led to increases in both asthma and acetaminophen exposure), by reverse causation (asthma itself caused pain or fever resulting in increased acetaminophen exposure) or by preferential use of acetaminophen in asthmatic children for fear of an increased asthmatic attack as a result of the use of other anti-inflammatory agents (i.e. aspirin).18 Most importantly, without a randomized clinical trial, which is not ethically feasible in this scenario, it is difficult to entangle whether the use of acetaminophen and/or antibiotics in early life can lead to the development of allergic diseases in later childhood.
In this study, we have attempted to address this important inconclusive question using two independent 5-year-apart birth cohorts derived from the National Health Insurance Research Database (NHIRD) in Taiwan. First, we calculated the incidence rate of three examined allergic diseases in later childhood across four exposure groups (no use of acetaminophen or antibiotics; only antibiotic use; only acetaminophen use; and both acetaminophen and antibiotic use) in two independent birth cohorts (1998 birth cohort and 2003 birth cohort). Second, we assessed whether there was a dose-response effect of acetaminophen and/or antibiotic exposure on the occurrence of atopic dermatitis, allergic rhinitis and asthma, separately. Furthermore, we investigated the temporal relationship between the use of acetaminophen and/or antibiotics during the 1st year of life and the development of atopic dermatitis, allergic rhinitis and asthma, respectively, in later childhood (2- to 6-year olds).
Methods
Study population
Taiwan launched a single-payer National Health Insurance Programme (NHIP) in March 1995. Since 2000, the National Health Insurance reimbursement claims data have been managed by the National Health Research Institutes (NHRI) in Taiwan. The National Health Insurance Research Database (NHIRD), a medical claims database (including inpatient and outpatient services), was established and has been released for research purposes. Specifically, the NHIRD, derived from the original medical claims data of the NHI programme, contains all inpatient and outpatient medical claims data (including prescription claims data) from the enrollees, who represent over 98% of the total population in Taiwan,19 and has provided a valuable resource, a unique opportunity and sufficient sample size to pursue the objectives addressed in this study. To ensure the accuracy of disease diagnosis, the National Health Insurance Bureau of Taiwan has randomly reviewed medical charts of 1/100 ambulatory and 1/20 inpatient claims. The high validity of the diagnostic data from the NHIRD has been reported previously.20
In detail, two independent birth cohorts were used in this study. (i) The 1998 birth cohort: a total of 263 620 children born in 1998 were identified, based on birth date in the enrolment data files from the total population in the NHIRD. (ii) The 2003 birth cohort: a total of 9910 children born in 2003 were identified, based on birth date in the enrolment data files from the Longitudinal Health Insurance Database 2005 (LHID 2005). Of note, the 1998 birth cohort included children who were born in 1998 and enrolled in the NHIRD from Taiwan’s total population; and the 2003 birth cohort identified children who were born in 2003 from the LHID 2005, a subset of the NHIRD that includes an approximately 1:23 ratio of Taiwan’s total population. Detailed information regarding the LHID 2005 and also the corresponding sampling method are provided at the following link: http://w3.nhri.org.tw/nhird/date_cohort.htm#1
The study protocol was approved by the Institutional Review Board of the NHRI in Taiwan.
Definition of acetaminophen and antibiotic uses
Information from prescription records regarding acetaminophen and antibiotic use occurring within the windows 1998–99 and 2003–04, respectively, were extracted according to Anatomic Therapeutic Chemical Classification System (ATC) codes. In particular, the list of the examined prescriptions included acetaminophen (ATC code: N02BE01) and antibiotics (ATC code: J01). From the prescription claims data (including acetaminophen and antibiotics), types of medication, dosage, time of prescription and duration of drug supply were recorded from each prescription claim. The detailed list of examined antibiotics consisted of: tetracyclines (ATC code: J01A); amphenicols (ATC code: J01B); penicillins (ATC code: J01C); other beta-lactam antibacterials (ATC code: J01D); sulfonamides and trimethoprim (ATC code: J01E); macrolides, lincosamides and streptogramins (ATC code: J01F); aminoglycosides (ATC code: J01G); quinolones (ATC code: J01M); and other antibiotics (ATC code: J01X). We then documented the status of acetaminophen and antibiotics use based on the date of prescription plus the duration of the drug supply within the windows 1998–99 and 2003–04, respectively, which would coincide with the 1st year of life.
Definition of examined allergic diseases
Three allergic diseases, atopic dermatitis, allergic rhinitis and asthma, were examined in this study. Notably, the disease diagnoses for the NHIP were coded using A-codes, a simplified disease diagnostic coding system that was mainly used for ambulatory care before 2000. Since 2000, the NHIP has switched the disease coding to the International Classification of Diseases [ICD]-9-CM codes. Therefore, for the 1998 birth cohort, diagnoses of the examined allergic diseases were provided as follows Different from the 1998 birth cohort, diagnoses of the examined allergic diseases in the 2003 birth cohort were described as follows:
atopic dermatitis: defined as at least one inpatient claim record for atopic dermatitis (A code: A429 or ICD-9 code = 691.8), or two ambulatory claims coded as A code = A429 or ICD-9 code = 493;
asthma: defined as at least one inpatient claim record for asthma (A code: A323 or ICD-9 code = 493), or two ambulatory claims coded as A code = A323 or ICD-9 code = 493;
allergic rhinitis: defined as at least one inpatient claim record for allergic rhinitis (A code: A319 or ICD-9 code = 477), or two ambulatory claims coded as A code = A319 or ICD-9 code = 477.
atopic dermatitis: defined as at least one inpatient claim record for atopic dermatitis (ICD-9 code = 691.8), or two ambulatory claims coded ICD-9 = 691.8;21,22
asthma: defined as at least one inpatient claim record for asthma (ICD-9 code = 493), or two ambulatory claims coded ICD-9 = 493;8
allergic rhinitis: defined as at least one inpatient claim record for allergic rhinitis (ICD-9 code = 477), or two ambulatory claims coded ICD-9 = 477.22
Of note, we used the date of the second ambulatory claim record or the date of one inpatient claim record for time to diagnosis for these three examined allergic diseases. Moreover, to ensure the reliability of disease diagnosis, we used the ICD-9 code, which has been used previously for identifying subjects with atopic dermatitis, asthma and allergic rhinitis, respectively,8,21,22 and only included children who had at least one inpatient claim record or two ambulatory claims records for the three examined allergic diseases.
Statistical analyses
We computed and compared the distribution of demographic and healthcare characteristics across different medication-use groups in both birth cohorts, separ ately. Specifically, the demographic and healthcare characteristics included: gender, enrollee category (I–IV), geographical area at birth (northern, central, southern and eastern) and healthcare utilization (including cumulative number of ambulatory visits and inpatient visits during the 1st year of life). Since most study subjects were dependants of the insured beneficiaries (those paying the insurance fee, such as a child’s parents, grandparents or social welfare institution), this study used enrollee category (EC) as a proxy measure to represent the study subjects’ socio-economic status (SES). A detailed description of EC classification can be obtained elsewhere.23 Briefly, the insurance fee for the NHIP was determined according to enrollees’ wages; therefore we classified enrollees into four ECs (EC I–EC IV), with EC I indicating those with the highest wages compared with those in the subsequent EC groups (EC II–EC IV).
Next, we excluded children who were in the first 2 years of life, that is 1–2 years of age, and calculated among the remaining children the incidence rates atopic dermatitis, asthma and allergic rhinitis, separately in the 1998 and 2003 birth cohorts, respectively. Specifically, the incidence rates of atopic dermatitis, asthma and allergic rhinitis, separately, were calculated in children aged 2 to 6 years.
Furthermore, we examined the temporal relationship between exposure to acetaminophen/antibiotics and the risk of developing allergic diseases using the Cox proportional hazards model for both birth cohorts, separately, with and without covariates adjustment. In detail, exposure to acetaminophen/antibiotics was classified into four groups: (i) no use of acetaminophen or antibiotics; (ii) only antibiotic use; (iii) only acetaminophen use; and (iv) both acetaminophen and antibiotic use. Of note, only the data related to exposure to acetaminophen/antibiotics during the 1st year of life were included.
The outcomes of interest were atopic dermatitis (yes/no), asthma (yes/no) and allergic rhinitis (yes/no); and the adjusted covariates included: gender, EC at birth, geographical area at birth and healthcare utilization (including numbers of ambulatory visits, inpatient visits, otitis media diagnoses and bronchitis diagnoses), separately. Children who developed allergic diseases during the first 2 years of life were excluded in the subsequent analyses. We followed the development of examined outcomes among the study children untill they were 6 years old. Hazard ratios (HRs) and the corresponding 95% confidence intervals (CIs) were calculated using the ‘no use of acetaminophen or antibiotics’ group as the reference group. All of the analyses were performed using SAS version 8.2 (SAS institute, Cary, NC).
Results
Study birth cohorts
A total of 263 620 live births from 1 January 1998 to 31 December 1998, and a total of 9910 live births from 1 January 2003 to 31 December 2003, separately, were included in this study. Similar demographic distribution was observed between the two study birth cohorts (Table 1). Specifically, 52% were male, nearly 30% were born in an urban area, and similar distributions across the four EC categories were observed for both birth cohorts. For the 1998 birth cohort: 67% had equal to or more than 13 ambulatory visits, 25% had one or more inpatient visit and 26% had a paediatric visit during the 1st year of life. For the 2003 birth cohort: 64% had equal to or more than 13 ambulatory visits, 29% had one or more inpatient visit and 28% had a paediatric visit during the 1st year of life (Table 1). In addition, the demographic distribution across the four different medication groups (no use of acetaminophen or antibiotics, only antibiotics, only acetaminophen, use of both drugs) between the two birth cohorts is provided in Supplementary Table 1 (available as Supplementary data at IJE online).
Descriptive characteristics of the 1998 and 2003 birth cohorts
| 1998 birth cohort (N = 263 620) | 2003 birth cohort (N = 9910) | |
|---|---|---|
| Sex | ||
| Female | 126 222 (47.88%) | 4731 (47.74%) |
| Male | 137 397 (52.12%) | 5179 (52.26%) |
| Enrollee category at birtha | ||
| I | 25 758 (9.77%) | 878 (8.86%) |
| II | 120 962 (45.88%) | 5061 (51.07%) |
| III | 76 246 (28.92%) | 2652 (26.76%) |
| IV | 40 654 (15.42%) | 1319 (13.31%) |
| Geographical area at birth | ||
| Urban | 72 925 (27.66%) | 2921 (29.48%) |
| Suburban | 160 847 (61.01%) | 5806 (58.59%) |
| Rural | 24 829 (9.42%) | 900 (9.08%) |
| Cumulative number of outpatient visits during 1st year of life | ||
| 0 | 14 045(5.33%) | 391 (3.95%) |
| 1–6 | 28 676(10.88%) | 1201 (12.12%) |
| 7–12 | 44 254(16.79%) | 1966 (19.84%) |
| ≥13 | 176 645(67.01%) | 6352 (64.10%) |
| Cumulative number of inpatient visits during 1st year of life | ||
| 0 | 197 602 (74.96%) | 7057 (71.21%) |
| 1 | 49 130 (18.64%) | 2076 (20.95%) |
| 2–3 | 14 825 (5.62%) | 680 (6.86%) |
| ≥4 | 2063 (0.78%) | 97 (0.98%) |
| Medical comorbidity during 1st year of life | ||
| Otitis media | 11 084 (4.20%) | 1021 (10.30%) |
| Bronchitis | 125 761 (47.71%) | 5897 (59.51%) |
| Specialty for clinical visits during 1st year of life | ||
| Paediatrics | 224 636 (26.35%) | 8925 (27.58%) |
| Otolaryngology | 129 622 (15.21%) | 4560 (14.09%) |
| Family Medicine | 90 438 (10.61%) | 3323 (10.27%) |
| General Medicine | 61 036 (7.16%) | 1555 (4.81%) |
aHigher EC category indicates lower SES level.
Incidence rate of three examined allergic diseases
The study children were followed up from age 2–6 years in both the 1998 and 2003 birth cohorts. In detail, of the children in the 1998 birth cohort: 7.2% developed atopic dermatitis (N = 19 015); 21.7% developed asthma (N = 57 328); and 31.2% developed allergic rhinitis (N = 82 292) over the 5-year follow-up period. Likewise, in the 2003 birth cohort: 10.0% developed atopic dermatitis (N = 987); 28.0% developed asthma (N = 2773); and 37.2% developed allergic rhinitis (N = 3691) over the 5-year follow-up period. The incident peaks of atopic dermatitis were observed before age 3 years and gradually decreased across different medication groups in both birth cohorts, separately (Figure 1a and b). The incident peak of allergic rhinitis was observed at age 4–6 years across the four different medication groups in the 1998 birth cohort, and at age 4–5 years in the 2003 birth cohort, except for the group with no exposure to acetaminophen and antibiotics (Figures 1e and 1f). However, no clear pattern was observed for the incident peak of asthma, but an increase in asthma incidence was observed when age increased in the 2003 birth cohort, particularly around the age when children entered kindergarten (Figure 1d).
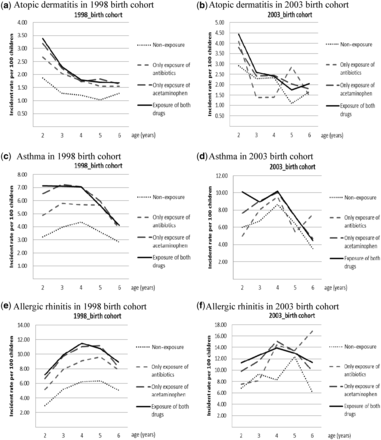
Incidence rate of acetaminophen and/or antibiotic use for three examined atopic diseases (atopic dermatitis, asthma, allergic rhinitis) in the 1998 and 2003 birth cohorts, separately
Temporal relationship between acetaminophen and/or antibiotic use and allergic diseases
Table 2a–c shows the results of univariate analysis of the temporal relationship between exposure to acetaminophen and/or antibiotics and the subsequent development of the three examined allergic diseases in the 1998 and 2003 birth cohorts, respectively. The results suggest that exposure to acetaminophen and/or antibiotics, gender (except for atopic dermatitis), EC at birth, geographical area at birth and healthcare utilization were important risk factors affecting the development of the examined allergic diseases in both the 1998 and 2003 birth cohorts. In addition, we also assessed the individual effect of acetaminophen and antibiotics, respectively, on the three examined allergic diseases. The results indicate that acetaminophen and antibiotic use, separately, have an individual effect on an increased risk of the three allergic diseases (data not shown). Moreover, when investigating the dose-response effect, Table 3 shows the dose-response relationship between exposure to acetaminophen and antibiotics, separately, during the 1st year of life and the subsequent development of the three examined allergic diseases in the 1998 birth cohort in the univariate analysis. A dose-response pattern was not observed, in particular for antibiotic use, in the 2003 birth cohort (Table 3).
Univariate analysis of drug exposure, healthcare utilization, enrollee category and urbanization during the 1st year of life and the subsequent development of atopic dermatitis
| 1998 birth cohort | 2003 birth cohort | |
|---|---|---|
| Atopic dermatitis | Crude HRa | Crude HRa |
| Drug exposure | ||
| Non-exposure | ref | ref |
| Only exposure to antibiotic drug | 1.95 (1.84–2.06) | 1.20 (0.86–1.68) |
| Only exposure to acetaminophen | 2.31 (2.19–2.43) | 1.19 (0.99–1.41) |
| Exposure to both drugs | 2.70 (2.58–2.83) | 1.35 (1.14–1.61) |
| Gender | ||
| Female | ref | ref |
| Male | 1.07 (1.06–1.08) | 1.06 (0.98–1.15) |
| EC at birthb | ||
| 1 | ref | ref |
| 2 | 0.91 (0.89–0.93) | 0.82 (0.72–0.94) |
| 3 | 0.85 (0.83–0.87) | 0.78 (0.68–0.90) |
| 4 | 0.77 (0.75–0.79) | 0.66 (0.56–0.78) |
| Geographical area at birth | ||
| Urban | ref | ref |
| Suburban | 0.96 (0.95–0.98) | 0.85 (0.78–0.92) |
| Rural | 0.94 (0.91–0.96) | 0.77 (0.66–0.90) |
| Healthcare utilization | ||
| No. of ambulatory visits | 1.02 (1.02–1.02) | 1.02 (1.01–1.02) |
| No. of inpatient visits | 1.14 (1.14–1.15) | 1.11 (1.07–1.16) |
| No. of otitis media diagnoses | 1.13 (1.12–1.13) | 1.26 (1.12–1.43) |
| No. of bronchitis diagnoses | 1.03 (1.03–1.03) | 1.25 (1.15–1.35) |
HR, hazard ratio; EC, enrollee category.
aSignificant results (P < 0.05) are indicated by bold text.
bHigher EC category indicates lower SES level.
Univariate analysis of drug exposure, healthcare utilization, enrollee category and urbanization during the 1st year of life and the subsequent development of asthma
| 1998 birth cohort | 2003 birth cohort | |
|---|---|---|
| Asthma | Crude HRa | Crude HRa |
| Drug exposure | ||
| Non-exposure | ref | ref |
| Only exposure to antibiotic drug | 1.64 (1.56–1.73) | 1.19 (0.89–1.58) |
| Only exposure to acetaminophen | 1.86 (1.77–1.95) | 1.31 (1.13–1.52) |
| Exposure to both drugs | 2.33 (2.24–2.43) | 1.66 (1.44–1.92) |
| Gender | ||
| Female | ref | ref |
| Male | 1.26 (1.24–1.27) | 1.33 (1.24–1.41) |
| EC at birthb | ||
| 1 | ref | ref |
| 2 | 0.93 (0.91–0.95) | 0.92 (0.82–1.02) |
| 3 | 0.91 (0.88–0.93) | 0.95 (0.85–1.07) |
| 4 | 0.79 (0.77–0.81) | 0.74 (0.64–0.85) |
| Geographical area at birth | ||
| Urban | ref | ref |
| Suburban | 1.00 (0.98–1.01) | 1.01 (0.94–1.09) |
| Rural | 1.02 (1.00–1.05) | 1.11 (0.98–1.25) |
| Healthcare utilization | ||
| No. of ambulatory visits | 1.02 (1.02–1.02) | 1.02 (1.02–1.02) |
| No. of inpatient visits | 1.29 (1.28–1.30) | 1.24 (1.21–1.28) |
| No. of otitis media diagnoses | 1.12 (1.11–1.13) | 1.32 (1.20–1.46) |
| No. of bronchitis diagnoses | 1.04 (1.04–1.04) | 1.63 (1.52–1.75) |
HR, hazard ratio; EC, enrollee category.
aSignificant results (P < 0.05) are indicated with bold text.
bHigher EC category indicates lower SES level.
Univariate analysis of drug exposure, healthcare utilization, enrollee category and urbanization during the 1st year of life and the subsequent development of allergic rhinitis
| 1998 birth cohort | 2003 birth cohort | |
|---|---|---|
| Allergic rhinitis | Crude HRa | Crude HRa |
| Drug exposure | ||
| Non-exposure | ref | ref |
| Only exposure to antibiotic drug | 1.67 (1.59–1.74) | 1.48 (1.17–1.88) |
| Only exposure to acetaminophen | 1.93 (1.85–2.02) | 1.42 (1.25–1.61) |
| Exposure to both drugs | 2.21 (2.13–2.30) | 1.69 (1.49–1.92) |
| Gender | ||
| Female | ref | ref |
| Male | 1.23 (1.21–1.24) | 1.27 (1.20–1.34) |
| EC at birthb | ||
| 1 | ref | ref |
| 2 | 0.88 (0.87–0.90) | 0.84 (0.76–0.92) |
| 3 | 0.76 (0.74–0.77) | 0.77 (0.69–0.85) |
| 4 | 0.67 (0.66–0.69) | 0.56 (0.50–0.64) |
| Geographical area at birth | ||
| Urban | ref | ref |
| Suburban | 0.90 (0.89–0.92) | 0.89 (0.84–0.95) |
| Rural | 0.76 (0.74–0.78) | 0.78 (0.70–0.87) |
| Healthcare utilization | ||
| No. of ambulatory visits | 1.02 (1.02–1.02) | 1.02 (1.01–1.02) |
| No. of inpatient visits | 1.15 (1.14–1.16) | 1.16 (1.12–1.19) |
| No. of otitis media diagnoses | 1.09 (1.09–1.10) | 1.24 (1.14–1.36) |
| No. of bronchitis diagnoses | 1.02 (1.02–1.02) | 1.43 (1.35–1.52) |
HR, hazard ratio; EC, enrollee category.
aSignificant results (P < 0.05) are indicated with bold text.
bHigher EC category indicates lower SES level.
Dose-response relationship between exposure to acetaminophen and antibiotic exposure, separately, during the 1st year of life and the subsequent development of atopic dermatitis, asthma and allergic rhinitis, individually, in the two birth cohorts
| 1998 birth cohort | |||
|---|---|---|---|
| Atopic dermatitis | Asthma | Allergic rhinitis | |
| unadjusted HR (95% CI) | unadjusted HR (95% CI) | unadjusted HR (95% CI) | |
| Acetaminophen exposure | |||
| No. of acetaminophen prescriptions during 1st year of life | |||
| 0 (reference group) | ref | ref | ref |
| 1–2 | 1.21 (1.17–1.24) | 1.23 (1.20–1.25) | 1.23 (1.20–1.25) |
| 3–4 | 1.22 (1.18–1.26) | 1.29 (1.26–1.32) | 1.25 (1.23–1.27) |
| >4 | 1.26 (1.22–1.29) | 1.29 (1.26–1.32) | 1.29 (1.26–1.31) |
| Antibiotic exposure | |||
| No. of antibiotic prescriptions during 1st year of life | |||
| 0 (reference group) | ref | ref | ref |
| 1–2 | 1.13 (1.10–1.17) | 1.13 (1.11–1.15) | 1.14 (1.12–1.16) |
| 3–4 | 1.16 (1.12–1.20) | 1.15 (1.13–1.18) | 1.14 (1.12–1.17) |
| >4 | 1.17 (1.14–1.20) | 1.16 (1.14–1.18) | 1.15 (1.13–1.17) |
| 2003 birth cohort | |||
|---|---|---|---|
| Atopic dermatitis | Asthma | Allergic rhinitis | |
| unadjusted HR (95% CI) | unadjusted HR (95% CI) | unadjusted HR (95% CI) | |
| Acetaminophen exposure | |||
| No. of acetaminophen prescriptions during 1st year of life | |||
| 0 (reference group) | ref | ref | ref |
| 1–2 | 0.98 (0.84–1.15) | 1.19 (1.07–1.33) | 1.15 (1.05–1.26) |
| 3–4 | 1.06 (0.90–1.25) | 1.32 (1.18–1.48) | 1.25 (1.14–1.38) |
| >4 | 1.00 (0.85–1.17) | 1.34 (1.21–1.49) | 1.19 (1.08–1.30) |
| Antibiotic exposure | |||
| No. of antibiotic prescriptions during 1st year of life | |||
| 0 (reference group) | ref | ref | ref |
| 1–2 | 1.00 (0.88–1.13) | 1.07 (0.99–1.16) | 1.08 (1.01–1.16) |
| 3–4 | 1.05 (0.86–1.27) | 1.23 (1.09–1.39) | 1.18 (1.06–1.32) |
| >4 | 1.13 (0.92–1.39) | 1.15 (1.00–1.32) | 1.06 (0.93–1.20) |
HR, hazard ratio. Significant results (P < 0.05) are indicated with bold text.
Furthermore, when the results were adjusted for the risk factors mentioned above, exposure to acetaminophen and/or antibiotics during the f1st year of life remained positively associated with the development of atopic dermatitis, asthma and allergic rhinitis, separately, in the 1998 birth cohort [adjusted hazard ratio (Adj_HR): 1.98 and 95% CI: 1.89–2.07 for use of both acetaminophen and antibiotics in atopic dermatitis; Adj_HR: 1.73 and 95% CI: 1.66–1.81 for use of both acetaminophen and antibiotics in asthma; Adj_HR: 1.70 and 95% CI: 1.64–1.76 for use of both acetaminophen and antibiotics in allergic rhinitis] (Table 4). In addition, a protective effect of developing atopic dermatitis, asthma and allergic rhinitis, separately, was found among children in the higher EC group (lower SES group), and those residing in a rural area in the 1998 birth cohort (Table 4). Interestingly, similar results for EC at birth, and geographical area at birth, separately, were also observed in the 2003 birth cohort (Table 4), but the observed effects of drug exposure, especially for atopic dermatitis and asthma in the 2003 cohort, were lower than those observed in the 1998 cohort and were not statistically significant (Adj_HR: 1.03 and 95% CI: 0.86–1.24 for exposure to both acetaminophen and antibiotics in atopic dermatitis; Adj_HR: 1.11 and 95% CI: 0.95–1.29 for exposure to both acetaminophen and antibiotics in asthma). Additionally, when compared with the unadjusted HRs in Table 2, the adjusted HRs were lower in Table 4 than the unadjusted HRs in Table 2. Our results suggest that exposure to acetaminophen and/or antibiotics is weakly associated with an enhanced risk of the three examined childhood allergic diseases. Of note, concerning the accuracy of the asthma diagnosis, we further excluded children aged 2–4 years and repeated the adjusted analysis. Similar results were observed in Supplementary Table 2 (available as Supplementary Data at IJE online).
Relationship between acetaminophen/antibiotic exposure during the 1st year of life and the subsequent development of atopic dermatitis, asthma and allergic rhinitis, individually, in the two birth cohorts
| 1998 birth cohort | |||
|---|---|---|---|
| Atopic dermatitis | Asthma | Allergic rhinitis | |
| Adj_HRa (95% CI) | Adj_HR (95% CI) | Adj_HR (95% CI) | |
| Drug exposure | |||
| Non-exposure | ref | ref | ref |
| Only exposure to antibiotics | 1.61 (1.53–1.70) | 1.38 (1.32–1.46) | 1.41 (1.35–1.47) |
| Only exposure to acetaminophen | 2.02 (1.92–2.13) | 1.66 (1.58–1.74) | 1.70 (1.63–1.77) |
| Exposure to both drugs | 1.98 (1.89–2.07) | 1.73 (1.66–1.81) | 1.70 (1.64–1.76) |
| Gender | |||
| Female | ref | ref | ref |
| Male | 1.01 (1.00–1.03) | 1.18 (1.17–1.20) | 1.18 (1.16–1.19) |
| EC at birtha | |||
| 1 | ref | ref | ref |
| 2 | 0.91 (0.89–0.93) | 0.93 (0.91–0.95) | 0.88 (0.86–0.89) |
| 3 | 0.83 (0.81–0.85) | 0.88 (0.86–0.90) | 0.76 (0.75–0.78) |
| 4 | 0.82 (0.80–0.85) | 0.82 (0.80–0.85) | 0.72 (0.70–0.74) |
| Geographical area at birth | |||
| Urban | ref | ref | ref |
| Suburban | 0.94 (0.93–0.95) | 0.97 (0.95–0.98) | 0.90 (0.88–0.91) |
| Rural | 0.94 (0.92–0.97) | 1.00 (0.98–1.03) | 0.79 (0.77–0.81) |
| 2003 birth cohort | |||
|---|---|---|---|
| Atopic dermatitis | Asthma | Allergic rhinitis | |
| Adj_HR (95% CI) | Adj_HR (95% CI) | Adj_HR (95% CI) | |
| Drug exposure | |||
| Non-exposure | ref | ref | ref |
| Only exposure to antibiotics | 1.03 (0.73–1.44) | 0.96 (0.72–1.29) | 1.25 (0.99–1.59) |
| Only exposure to acetaminophen | 1.02 (0.85–1.22) | 1.04 (0.90–1.21) | 1.18 (1.04–1.35) |
| Exposure to both drugs | 1.03 (0.86–1.24) | 1.11 (0.95–1.29) | 1.24 (1.08–1.42) |
| Gender | |||
| Female | ref | ref | ref |
| Male | 1.01 (0.93–1.09) | 1.24 (1.16–1.32) | 1.20 (1.13–1.26) |
| EC at birtha | |||
| 1 | ref | ref | ref |
| 2 | 0.81 (0.71–0.93) | 0.93 (0.83–1.04) | 0.83 (0.76–0.91) |
| 3 | 0.79 (0.68–0.91) | 0.92 (0.82–1.04) | 0.76 (0.68–0.84) |
| 4 | 0.70 (0.59–0.83) | 0.78 (0.67–0.89) | 0.59 (0.52–0.67) |
| Geographical area at birth | |||
| Urban | ref | ref | ref |
| Suburban | 0.82 (0.75–0.89) | 0.96 (0.89–1.03) | 0.86 (0.81–0.92) |
| Rural | 0.75 (0.64–0.88) | 1.04 (0.92–1.18) | 0.79 (0.71–0.89) |
Adj_HR, adjusted hazard ratio; EC, enrollee category. Significant results (P < 0.05) are indicated with bold text.
Adj_HR values have been adjusted for all other variables listed in the table, plus healthcare utilization (including no. of ambulatory visits, no. of inpatient visits, no. of otitis media diagnoses and no. of bronchitis diagnoses).
aHigher EC category indicates lower SES level.
Discussion
The natural history of allergic diseases in childhood has been portrayed as a result of the interplay of genetic factors and environmental exposures24 such as allergens, infections and air-pollutant stimulation that lead to aberrant immune development (Th2 allergic immune response) of the host and manifest as mucosal membrane inflammation in the gut (food allergy), on the skin (atopic dermatitis) and in the upper and lower respiratory tracts (allergic rhinitis and asthma). Still, the most controversial, unsettled part of this allergy model is the what, how and when—in relation to the environmental factors that cause children to develop atopy.25 In this study, using two independent birth cohorts 5 years apart and derived from the NHIRD, our results indicate that exposure to acetaminophen and/or antibiotics in the 1st year of life may have long and profound effects on the subsequent development of allergic diseases in later childhood.
Whereas the adverse effect of acetaminophen/antibiotics use on the development of asthma has been well documented,4,6,12,13,26–31 only limited studies have simultaneously investigated the effect of acetaminophen and antibiotics use on the development of childhood allergic diseases. One recent study showed that exposure to acetaminophen and antibiotics in the 1st year was associated with an increased risk of transient and persistent asthma, but not with late-onset asthma.10 However, the study also found that the association of early acetaminophen and antibiotics use to wheezing at school age was due to confounding (through infection), not a direct (causal) effect.10 In contrast, in this study we found that early acetaminophen and antibiotics use might increase the occurrence of allergic diseases in later childhood in the 1998 birth cohort, especially for children without respiratory tract infection in the 1st year of life.
Numerous observational studies have examined the association of acetaminophen and/or antibiotic use with allergic diseases in childhood using various approaches, for example, cross-sectional questionnaire by recall history,12,13 birth cohort of a targeted population27,31 and nationwide prescribed drug registry database.10 Generally, cross-sectional epidemiological studies can only document an association between acetaminophen and/or antibiotic exposure and allergic diseases, but cannot prove the temporal relationship of acetaminophen and/or antibiotic use with allergy or asthma. In addition, using asthma as an example, the association between acetaminophen and/or antibiotic exposure and asthma might also be confounded: (i) by indication (increased viral illnesses or fever leading to both asthma and acetaminophen and/or antibiotic exposure); (ii) by reverse causation (asthma itself causing pain or fever resulting in increasing acetaminophen and/or antibiotic exposure); or (iii) by preferential use of acetaminophen and/or antibiotics by children at greatest risk for asthma because of the fear that alternative treatments (i.e. aspirin or other anti-inflammatory agents) might increase asthma symptoms.32 For instance, Almqvist et al.10 previously reported that reverse causation or confounding by indication due to the link between respiratory tract infections and asthma may partially explain an association between antibiotic use and asthma.5,33 Distinctively from previous studies, we investigated the temporal relationship between exposure to acetaminophen and/or antibiotics and the development of allergic diseases using two independent 5-year-apart birth cohorts. Interestingly, a positive temporal relationship was observed between exposure to acetaminophen/antibiotics and allergic diseases in the 1998 birth cohort, but was not statistically significant in the 2003 birth cohort.
Despite the positive associations reported in numerous studies, findings from different studies have been controversial. For example, Lowe et al. observed a weak association between early paracetamol use and risk of childhood asthma, but this association vanished after adjustment for respiratory tract infections.34 Schnabel et al. reported similar conclusions that the increased frequency of respiratory tract infections, not the paracetamol medication, was associated with asthma development.35 In addition, Rusconi et al. suggested that the observed association of prenatal exposure to paracetamol and antibiotics with subsequent development of wheezing/asthma was likely explained by confounding factors.36 Moreover, Heintze and Petersen suggested that the association of acetaminophen and/or antibiotics with childhood asthma was related to various forms of bias.37
On the other hand, the observed effects of acetaminophen and/or antibiotic exposure on the development of allergic diseases are biologically plausible. Previous reports have demonstrated that acetaminophen may be involved in the etiology of asthma through glutathione depletion in the lung and reduced antioxidant capacity.38,39 This depletion may also cause a shift from Th1 to Th2 cytokine production, favouring allergic disorders.39 Alternatively, acetaminophen might influence COX-2 activity and production of prostaglandins E2,40 which in turn favour a Th2 immune dominance. Moreover, non-discriminative use of antibiotics may disturb microflora residing in the gastrointestinal tract and therefore jeopardize the development of oral tolerance and regulatory T cell immune responses that may prevent allergen sensitization.41 Further investigations to improve our understanding of the observed effects of acetaminophen and antibiotic exposure are merited.
Compared with previous studies, the strengths of our study include, first, the ability to examine the temporal relationship between acetaminophen/antibiotic use and the development of allergic diseases in two independent 5-year apart birth cohorts derived from the NHRID, which covers 98% of Taiwan’s total population. As a result, this large sample size allowed us to assess the temporal relationship between exposure to acetaminophen and/or antibiotics during the 1st year of life and the subsequent development of three allergic diseases (atopic dermatitis, asthma and allergic rhinitis, examined individually). Second, to account for potential confounding by indication due to respiratory tract infections, we performed further analyses by stratifying the status of respiratory tract infections. As presented in Supplementary Table 3 (available as Supplementary data at IJE online), the effect of acetaminophen and/or antibiotics persisted in the subgroup for non-respiratory infections in the 1998 cohort. Third, this study is one of few studies to simultaneously examine the temporal effect of exposure to acetaminophen and/or antibiotics on the development of allergic diseases in an Asian population.
On the other hand, several limitations should be noted and the results should be interpreted with caution. First, based on the use of registry claims data, the reliability and validity of diagnosis for the three examined allergic diseases (atopic dermatitis, asthma and allergic rhinitis) remain a major concern. At present, laboratory/biochemical data are not available in the NHIRD, which means that IgE data were not available for our study. To ensure the validity of disease diagnosis, we used the previously reported ICD-9-CM codes to identify children with allergic disease, which have been similarly applied by other groups in Canada and the USA.8,21,22 Moreover, to ensure the reliability, we only included children who had at least one inpatient claim record or two ambulatory claims records from age 2–6 years. As such, even though it is likely that we may still have misclassified the disease diagnosis, it should be undifferentiated and would reduce the estimated risk. Second, some clinical information such as the severity of atopic dermatitis, asthma and allergic rhinitis was not available in the NHIRD. For example, it is likely that children with mild clinical symptoms of allergic diseases may not be captured and accurately recorded by insurance medical claims data. However, the potential misclassification would be undifferentiated, and this would induce bias toward the null. Third, antibiotic drugs cannot be obtained without a prescription from a physician, but some acetaminophen is an over-the-counter medication. In Taiwan, most parents will not let their children take acetaminophen without a prescription from a paediatrician, especially during the first several years of life. Even so, we could not totally exclude this potential misclassification. However, such misclassification would be undifferentiated in both groups and would reduce the estimated risk. Fourth, a certain number of potential confounders, such as family history of atopy and household smoking, were not available in the NHIRD. However, the observed estimated risks in this study were comparable to those in previous studies8,42 but the results might still be partially explained by those unadjusted confounders. Lastly, NHIRD only provided information related to dispensing; the information for indication of use was not recorded in the database. Since non-compliance has been considered as a potential confounder, caution should be applied when comparing our findings with the results reported by other groups, in which data were collected from clinical settings.
In summary, our findings provide suggestive evidence that the temporal effect of acetaminophen and/or antibiotic exposure influences the development of common childhood allergic diseases. Further functional studies and/or animal studies will be needed to validate the findings of this study and to provide a better understanding of the underlying regulatory mechanisms of this important clinical and public health issue affecting at-risk children.32,43
Funding
This study is supported in part by grants from the National Health Research Institutes (PI: Tsai, PH-099-PP-56, PH-102-PP-14 and PH-102-SP-05) and the National Science Council of Taiwan (PI: Tsai, NSC 101-2314-B-400-009-MY2; PI: Wang, 101-2325-B-006-020).
Acknowledgements
We thank Tami R. Bartell for English language editing. This study is based in part on data from the National Health Insurance Research Database provided by the Bureau of National Health Insurance, Department of Health and managed by the National Health Research Institutes. The interpretation and conclusions contained herein do not represent those of the Bureau of National Health Insurance, Department of Health or National Health Research Institutes. All authors were involved in drafting the article or revising it critically for important intellectual content, and all authors approved the final version to be published. J-Y. Wang and L-F. Liu conceptualized and designed the study, and approved the final manuscript as submitted. C-Y. Chen and C.A. Hsiung critically reviewed and revised the manuscript for important intellectual content, and approved the final manuscript as submitted. Y-W. Huang performed analyses and reviewed the manuscript. H-J. Tsai supervised the study, drafted the initial manuscript and approved the final manuscript as submitted.
Conflict of interest: None declared.
Findings from this study provide suggestive evidence that the temporal effect of exposure to acetaminophen and/or antibiotics influences the development of common allergic diseases in later childhood.
The observed effect of acetaminophen and/or antibiotic use on the development of common allergic diseases in later childhood persisted in children without respiratory tract infection during the 1st year of life.
Further functional studies and/or animal studies are needed to better understand the underlying regulatory mechanisms of this important clinical and public health issue.

