


Abstract
Background: Population-level associations between community measures of HIV viral load and HIV incidence have been interpreted as evidence for HIV anti-retroviral treatment (ART) as prevention among people who inject drugs (PWID). However, investigation of concurrent HCV and HIV incidence trends allows examination of alternative explanations for the fall in HIV incidence. We estimate the contribution of ART and reductions in injecting risk for reducing HIV incidence in Vancouver between 1996 and 2007.
Methods: A deterministic model of HIV and HCV transmission among PWID was calibrated to the baseline (1996) HIV and HCV epidemic among PWID in Vancouver. While incorporating parameter uncertainty, the model projected what levels of ART protection and decreases in injecting risk could reproduce the observed reduction in HIV and HCV incidence for 1996–2007, and so what impact would have been achieved with just ART or just reductions in injecting risk.
Results: Model predictions suggest the estimated reduction (84%) in HCV incidence for 1996–2007 required a 59% (2.5–97.5 percentile range 49–76%) reduction in injecting risk, which accounted for nine-tenths of the observed decrease in HIV incidence; the remainder was achieved with a moderate ART efficacy for reducing sexual HIV infectivity (70%, 51–89%) and an uncertain ART efficacy for reducing injection-related HIV infectivity (44%, 0–96%). Despite this uncertainty, projections suggest that the decrease in injecting risk reduced HIV incidence by 76% (63–85%) and ART further reduced HIV incidence by 8% (2–19%), or on its own by 3% (−34–37%).
Conclusions: Observed declines in HIV incidence in Vancouver between 1996 and 2007 should be seen as a success for intensive harm reduction, whereas ART probably played a small role.
Introduction
The pivotal trial, HPTN 052, and numerous observational studies among sero-discordant couples have shown that HIV anti-retroviral treatment (ART) can reduce the risk of heterosexual HIV transmission by over 90%,1,2 with new evidence also suggesting prevention benefit among men who have sex with men (MSM).3 However, although some prevention benefit should be expected among people who inject drugs (PWID), due to decreases in viral load, the magnitude of this benefit is uncertain.
In a prospective cohort study conducted in Vancouver, associations between HIV incidence among PWID and community measures of the median HIV viral load among diagnosed PWID (so-called community viral load) have been interpreted as evidence for the prevention benefit of ART among PWID.4 However, although the association held after adjustment for time-varying injecting risk behaviours, which also generally decreased over the study period, it is unclear whether all factors affecting HIV incidence were adequately accounted for.5,6 Also, there is discussion over whether the median viral load among HIV-diagnosed PWID well proxies the overall infectivity of a PWID population,7 first because it does not account for the variability in viral load,7 and so infectivity, among unsuppressed PWID who were the majority of HIV-diagnosed PWID in Vancouver during the late 90 s,4 and second because undiagnosed PWID are not incorporated in the community viral load measure, but may contribute disproportionately to transmission if many PWID are undiagnosed (as was case in late 90 s in Vancouver8).
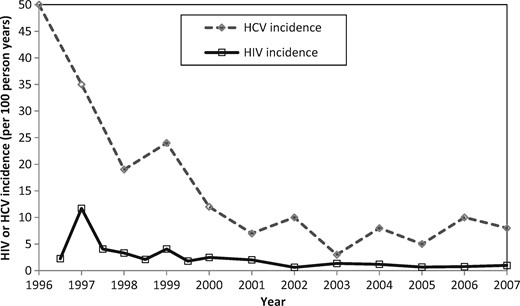
Hepatitis C (HCV) is a blood-borne virus transmitted primarily through parenteral exposure, and much less effectively by sexual exposure.9 In the Vancouver study,4 declines in HCV incidence10–12 occurred concurrently with observed decreases in HIV incidence (Figure 1). These decreases in HCV incidence are likely to indicate reductions in injecting risk, which would also impact on HIV transmission. We use a joint HIV and HCV transmission model among PWID to estimate the degree to which HIV treatment contributed to the observed decline in HIV incidence in Vancouver between 1996 and 2007, as considered by Wood et al.,4 or alternatively how much was due to reductions in injecting risk. We do not consider more recent years because our primary aim was to consider possible reasons for the large decrease in HIV incidence previously suggested to be due to ART scale-up.
Methods
Model description
We developed a deterministic mathematical model to simulate the transmission of HIV and HCV among PWID. The model incorporates the transmission of HIV and HCV due to injecting drug use and HIV transmission due to sexual risk behaviour (Figure 2; further details in supplementary material, available as Supplementary data at IJE online). HCV transmission was not assumed to be sexually transmitted because sexual HCV transmission is rare9,13 unless linked to riskier sex acts among MSM.14 The PWID population is divided into 10 classes depending on HIV (susceptible, acute, latent, ART, lost to follow-up from ART) and HCV (susceptible, chronic infection) infection status, and by whether the PWID have low or high injecting risk. The model is open, with new PWID entering through initiation of injecting drug use, and leaving due to HIV death, non-HIV death or cessation of injection. Although HCV infection causes excess mortality,15,16 which is elevated by HIV co-infection17,18 and partially reversed by ART,17 HCV-related mortality was not included because data from Vancouver19 suggest that it contributes little to mortality (6.0% of deaths among HCV-infected PWID: see supplementary materials, available as Supplementary data at IJE online). Lastly, data are conflicting on whether HCV affects HIV disease progression20 or response to ART,20–25 and so this was not included in our model.
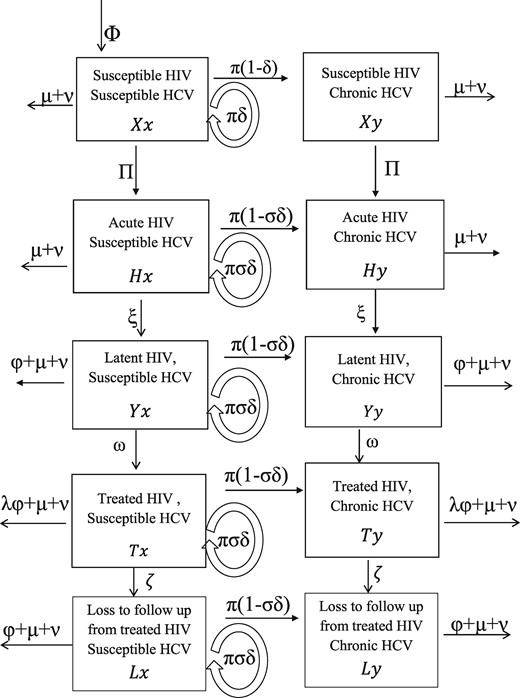
Model schematic showing the HCV and HIV infection states and transitions. Variables are denoted by capital letters for the HIV infection states (X,H,Y,T and L representing susceptible, acute, latent, ART and ART lost to follow-up, respectively) and the lower-case letters for HCV infection states (x, y representing susceptible and chronic infection, respectively). Arrows show possible transitions from one state to the other and are labelled by the flow rates. New PWID enter the population at a rate and leave all compartments due to non-HIV death (rate ) or cessation of injection (rate ). Forces of infection for HIV and HCV are and , respectively. For HIV transmission, PWID infected with HIV enter the acute stage (with average duration of 1/ ) and then progress to the latent stage. Latently infected HIV individuals experience HIV-related death at a rate and are also recruited onto anti-retroviral treatment (ART) at a rate . For those on ART, HIV-related death is reduced by a factor , but some individuals are permanently lost to follow-up from ART at rate ζ. For HCV transmission, a proportion of those infected with HCV spontaneously clear infection and the remaining proportion progress to chronic infection (proportion for those uninfected with HIV, reduced by a factor σ for those co-infected with HIV).
The model assumes that the rate at which PWID become infected with HIV or HCV is proportional to the prevalence of that infection, which can change over time through the effect of interventions. Because of a lack of strong evidence, ART is not assumed to reduce HCV infectivity26 or the susceptibility of HIV-infected PWID to acquiring HCV infection.14,27–31 A proportion of the baseline HIV transmission risk is assumed to be sexually transmitted, which is unaffected by decreases in injecting risk and so increases in importance as injecting risk decreases. Individuals in the HIV latent state can be recruited onto ART and experience reduced HIV-related mortality unless they are lost to follow-up.32 For PWID on ART, the relative reduction in the injecting and sexual HIV infectivity for the period 1996–2007 is denoted by factors and , respectively, compared with the HIV latent phase-defined as the efficacy of ART for reducing sexual and injecting HIV infectivity. The relative decrease in the overall HIV and HCV injecting transmission risk over the period 1996–2007 is denoted by , with denoting no change in baseline (1996) levels of injecting risk and denoting a 100% reduction in injecting risk.
Model parameterization
All model parameters were obtained from the literature, with most being specific to Vancouver (Table 1). Uniform uncertainty bounds were assigned to all model parameters except for: (i) the baseline HIV transmission rate during the latent stage of HIV () and the factor difference between the baseline HIV (during HIV latent stage) and HCV transmission rate (); and (ii) the efficacy of ART in reducing a PWID’s injection-related HIV infectivity (), and the factor decrease in HIV and HCV injecting transmission risk (), which were all varied widely in the model fitting process. More details are included in the model calibration section.
Parameter values and uncertainty ranges (all uniformly sampled) used in numerical simulations
| Parameter definition and (symbol) | Range or value used | Data source |
|---|---|---|
| HIV biological parameters: | ||
| HIV transmission probability in the latent stage () | Varied freely | Varied to fit HIV prevalence in 1997 |
| Cofactor difference in HIV transmission rate in HIV acute stage compared with latent HIV stage () | 3–25 | 71 |
| Duration of acute HIV stage in years () | 1/12–0.25 | 71 |
| HIV mortality rate per year during latent HIV stage () | 1/10 | 72–74 |
| HCV biological parameters: | ||
| Factor difference between HCV and HIV transmission rate for the HIV latent stage () | 4–10 | Varied to fit HCV prevalence in 1997 |
| Relative HCV transmissibility if HIV co-infected () | 1–7 | Reviewed75 |
| Proportion of HCV infections that spontaneously clear () | 0.22–0.29 | 52 |
| Relative risk of spontaneous clearance if HIV co-infected () | 0.21–0.58 | Reviewed75 |
| PWID behavioural and demographic parameters: | ||
| PWID Recruitment rate () | Recalibrated for each run | Varied to balance non-HIV exit rates |
| Injecting cessation rate per year () | 1/23–1/7 | 76 |
| Non-HIV mortality rate per year () | 1.5–2.0% | 12 |
| Proportion of baseline HIV transmission risk due to sexual HIV transmission (τ) | 10% (5–25%) | Derived based on the population-attributable fraction [6.4% (1.0–18.5%)39] for only sexual risk factor consistently associated with HIV sero-conversion among PWID in VIDUS between 1996 and 2003 (having an HIV-positive sexual partner39) |
| Proportion of the PWID population that are high-risk () | 0.3–0.6 | Similar to the proportion of PWID in unstable housing or crack/heroin injecting in Vancouver in 199612,62 |
| Factor difference in HIV and HCV injecting transmission risk among high-risk PWID compared with low-risk PWID () | 1–4.8 | Based on the enhanced HIV or HCV transmission risk associated with daily cocaine or heroin injecting or unstable housing in the VIDUS cohort4,10,11,62 |
| Duration that PWID remain high-risk in years () | 3.2 (1.6–4.8) | 12 |
| Degree to which PWID mix proportionately or assortatively (like-with-like) with PWID of the same injecting risk () | 0–0.6 | No data, so allowed proportionate ‘random’ mixing () as well as up to double the level of assortative mixing ( > 0 but up to 0.6) found among PWIDs in UK77 |
| ART and changes in injecting risk parameters | ||
| Relative decrease in HIV and HCV transmission risk due to decreases in injecting risk () | 0–1 | Set to zero for initial fitting to 1996 data, then varied to fit to decrease in HCV incidence over 10 years from 1996 to 2007. Assumed to increase to stable level, similar to recent trends in OST coverage and decreases in syringe-sharing in Vancouver12,38 |
| Rate of recruitment on to ART per year () | ≥ 0 | Set to zero for initial model fitting in 1996, and then varied to fit to ART coverage trends in Vancouver35 |
| Rate of permanent loss to follow-up from ART per year (ζ) | 15% (10.5–19.5%) | Data from Nosyk AIDS 201532 used to estimate the rate of permanent loss to follow up from ART for PWID |
| Relative decrease in parenteral HIV transmission rate while on ART compared with latent HIV stage () | 0–0.95 | Trials suggest > 90% reduction for sero-discordant couples1 but no data for PWID or parenteral HIV transmission and recent observational data suggest efficacy among couples could be much lower in real life2 |
| Relative decrease in sexual HIV transmission rate while on ART compared with latent HIV stage () | 0.5–0.9 | Range obtained from meta-analysis of trials and observational studies undertaken among sero-discordant couples1,2 with lower bound based on the proportion of PWIDs virally suppressed after 1 year of ART in Vancouver33 |
| Cofactor difference in HIV mortality rate while on ART compared with latent HIV stage () | 1/6–1/2 | Estimate for Vancouver from 1996 to 2007,78 but allow uncertainty.79 Does not affect model projections because only modelling duration of current injecting |
| HIV and HCV epidemiological data used to calibrate the model: | ||
| HIV prevalence at baseline in 1996 | 21% (19.2–23.7%) | HIV prevalence among PWID recruited into VIDUS between 1996 and 199911 |
| HIV incidence per 100 person years at baseline in 1996 | 6.3 (95% CI 3.3–9.3) | Exponential curve fitting to HIV incidence data from Wood et al.4 |
| Chronic HCV prevalence at baseline in 1996 | 61% (58.9–61.9%) | HCV antibody prevalence among PWID (81.6%) recruited into VIDUS between 1996 and 199911 scaled down by 26% due to spontaneous clearance52 |
| HCV incidence per 100 person years at baseline in 1996 | 41.2 (95% CI 33.7–48.7) | Exponential curve fitting to HCV incidence data from Grebely et al.10 |
| Percentage decrease in HIV incidence over 1996–2007 | 84% (95% CI 76–86%) | Exponential curve fitting to HIV incidence data from Wood et al.4 |
| Percentage decrease in HCV incidence over 1996–2007 | 84% (95% CI 78–93%) | Exponential curve fitting to HCV incidence data from Grebely et al.10. |
To be conservative, ART was assumed to decrease sexual HIV transmission () by 50–90%,2 with the lower bound based on the proportion of PWIDs on ART who were virally suppressed in Vancouver at this time.33 This variable was varied more widely in the initial exploratory analysis. The ART recruitment rate () was calibrated such that the proportion of HIV-infected PWID on highly effective ART (HAART) was negligible in 1996,34,35 then increased up to 40% by 2000 and remained stable at that level till 2007,35 roughly similar to the real trends which increased rapidly to about 34% coverage by 1999, and then slowly increased to 40% by 2006.36,37 Coinciding with increases in Opioid substitution therapy coverage12 and decreases in syringe sharing,12,38 injecting risk was assumed to decrease exponentially over this period to a calibrated stable level (see supplementary materials, available as Supplementary data at IJE online).
More details on the model parameters are included in the supplementary materials and Table 1. The proportion of the baseline HIV transmission rate due to sexual risk (τ = 10% (5–25%)) was based on the population-attributable fraction (6.4%, minimum to maximum range 1.0–18.5%39 – see supplementary materials, available as Supplementary data at IJE online) for the only sexual risk factor shown to be associated with incident HIV sero-conversion among Vancouver PWID (having a HIV-positive sexual partner39) over this time period. The range was widened to allow for unobserved sexual risk factors that may have been important for HIV transmission in this setting, and to ensure that the importance of sexual HIV transmission was not underestimated. Importantly, no other ‘high-risk’ sexual behaviours, such as a man having sex with another man,40 commercial sex,39–46 having > 20 lifetime sexual partners46,47 or unprotected/unsafe sex,4,38–46,48,49 were related to incident HIV sero-conversion in adjusted analyses over this time in Vancouver; whereas many injection-related risk factors were consistently and strongly related, such as daily cocaine/speedball injecting,4,38–44,47–51 requiring help injecting,39,40,42,44,49,51 binge drug use39,41,44,50 and borrowing needles.40,43,48,50,51 This gives a highly consistent picture that injecting risk behaviours were the main drivers of HIV transmission over this time period, with sexual HIV transmission probably playing a small role, and so our assumption is unlikely to underestimate the importance of sexual HIV transmission.
Baseline (1996) HIV and HCV prevalence11 and incidence4,12 estimates were obtained from the Vancouver Injection Drug Users Study (VIDUS). HCV and HIV antibody prevalence (82% and 21%,11 respectively) came from PWID recruited between 1996 and 1999. As approximately 26% of individuals spontaneously clear acute HCV infection,52 a baseline HCV chronic prevalence of 61% was assumed. Because of uncertainty and yearly fluctuations in incidence estimates (measured among those at risk), negative exponential curves (with non-zero asymptotes) were fit to the incidence data for 1996–20074,10 using the nonlinear least squares method. This suggested that HIV and HCV incidence decreased by 84% (95% confidence interval (CI) 76–86%) and 84% (95% CI 78–93%), respectively, over the decade (Figure 3).
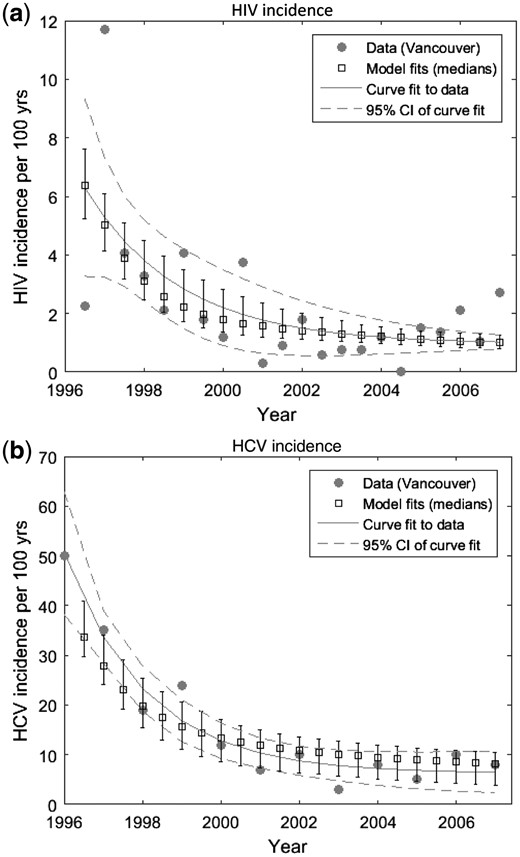
Curve fits to temporal trends in HIV and HCV incidence data among at-risk susceptible PWID in the Vancouver VIDUS cohort, with model fits shown for comparison. Solid circles show HIV (a) or HCV (b) incidence data, whereas the grey line shows the curve fit to these data using non-linear least squares method, and dashed grey lines are the 95% confidence intervals. The squares are the median with whiskers representing 2.5 and 97.5% percentiles from the model fits; yrs, years.
Model calibration
The HIV and HCV prevalence at baseline and HIV and HCV incidence in 2007 (estimated from the curve fits), and all model parameters with uncertainty distributions in Table 1, were randomly sampled to give 5000 model parameter sets. For each parameter set, the HIV transmission rate () and factor difference between the HIV and HCV transmission probabilities () were first varied to fit the model’s endemic HIV and HCV prevalence to the sampled baseline HIV and HCV prevalence among PWID in 1996. This was done using the Matlab function lsqnonlin to minimize the squared error. A parameter set was accepted as a ‘baseline model fit’ if it also gave an HIV and HCV incidence within the uncertainty range of the baseline HIV and HCV incidence data for 1996.
These baseline model fits were then used to determine what combinations of ART efficacy for reducing injection-related HIV infectivity () and decreases in injecting risk () could result in the sampled HIV and HCV incidence after 10 years in 2007 (using the same Matlab numerical routine), with runs being rejected if the decrease in injecting risk needed to achieve the sampled decrease in HCV incidence resulted in a decrease in HIV incidence larger than observed. This produced 902 ‘full model fits’. Further details of the model calibration are in the supplementary material, available as Supplementary data at IJE online.
Model analyses
To understand the contribution of ART and changes in injecting risk to decreasing HIV and HCV incidence, the 902 full model fits were used to project the decrease in HIV and HCV incidence that would occur over 10 years with varying efficacies of ART for reducing sexual and injection-related HIV infectivity (and = 0, 30%, 60% and 90%) and/or different relative decreases in injecting risk ( = 0, 30%, 60% and 90%).
The 902 full model fits were then used to estimate the likely contribution that ART or changes in injecting risk made to the observed reduction in HIV incidence among PWID for 1996–2007. The proportion of the modelled decrease in HIV incidence that would have occurred with just the effect of ART on HIV transmission being included ( set to zero across all full model fits), or without the prevention effect of ART being included ( and set to zero across all full model fits) was estimated.
Last, a linear regression analysis of covariance (ANCOVA) was undertaken53 on the range of model projections for the contribution of ART to decreasing HIV incidence for all 902 full model fits. This analysis estimated the proportion of the variability in the model projections (proportion of the sum of squares) that could be attributed to uncertainty in different model parameters or inputs. A linear regression model was then developed; including the most important parameters from the ANCOVA analysis, to determine across what parameter region the model-predicted ART made a noticeable contribution (≥ 20% decrease in HIV incidence).
Ethics
Patient consent was not needed because no patients were involved in the study. Ethics committee approval was not needed because the study used previously published secondary data
Results
Impact of injecting risk and ART on HIV and HCV incidence
Figure 4 shows, for different reductions in injecting risk and ART efficacy for decreasing HIV infectivity, the projected decrease in HIV and HCV incidence for 1996–2007 among PWID in Vancouver. Both high ART efficacy (∼ 90%) or moderate decreases in injecting risk (≥ 30%) could have resulted in noticeable decreases in HIV incidence, whereas only reductions in injecting risk would have decreased HCV incidence. However, increases in HIV incidence could have occurred with just ART if there had been low to moderate ART efficacy ( < 50%), due to improvements in HIV survival with ART. Also ART is unlikely to have decreased HIV incidence by over 40% even with high ART efficacy (90%) due to the moderate coverage of ART over this period (≤ 40%).
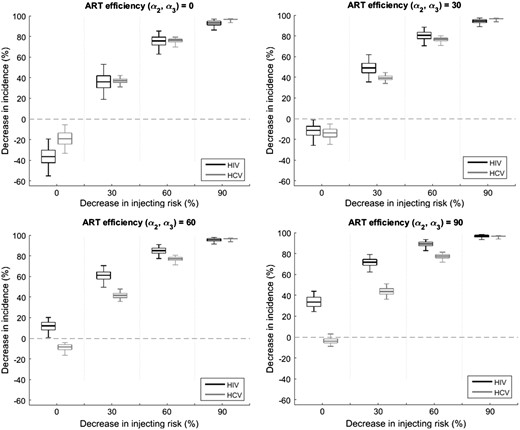
Relative decrease in HIV and HCV incidence for 1996 to 2007 for different efficacies of ART for reducing HIV infectivity ( and ), and reductions in injecting risk (). All projections assume a scale-up to 40% ART coverage among HIV-infected PWID by 2006 and assume that ART reduces HIV morbidity even when ART is assumed to have no effect on HIV transmission. The box plots signify the uncertainty (middle line is median, limits of boxes are 25% and 75% percentiles, and whiskers are 2.5% and 97.5% percentiles) in the impact projections due to uncertainty in the model parameters.
Contribution of ART and reductions in injecting risk to reducing HIV incidence in Vancouver
The model closely fitted the HCV and HIV incidence trends (Figure 3) except for the high HIV incidence in 1997. This high HIV incidence should be considered an outlier, probably due to an HIV outbreak,11 because it is 3-fold higher than any other time period.
To achieve the observed decrease in HCV incidence for 1996–2007, a large decrease in injecting risk (median of 59%, 2.5 to 97.5 percentile range 49–76%) must have occurred. This resulted in a median 76% (63–85%) decrease in HIV incidence among PWID (Figure 5), contributing nine-tenths (90%, 77–98%) of the overall reduction in HIV incidence achieved from 1996 to 2007.38 Once this reduction in injecting risk had been accounted for, the full observed reduction in HIV incidence was achieved with a moderate efficacy of ART for reducing sexual HIV infectivity (70%, 51–89%) and an uncertain efficacy for reducing injection-related HIV infectivity (44%, 0–96%). Model projections suggest that the scale-up of ART alone (Figure 5) would have at best resulted in a 37% (3%, -34–37%) decrease in HIV incidence, with an 86% chance that the decrease was < 25%, whereas its incremental impact on top of what was achieved through decreasing injecting risk was a median 8% (2–19%) decrease in HIV incidence. Uncertainty in the beneficial impact of ART alone results partly from HIV incidence increasing between 1996 and 2007 if ART has low efficacy (as shown in Figure 4), with the ART efficacy needing to be > 50% to result in HIV incidence decreasing.
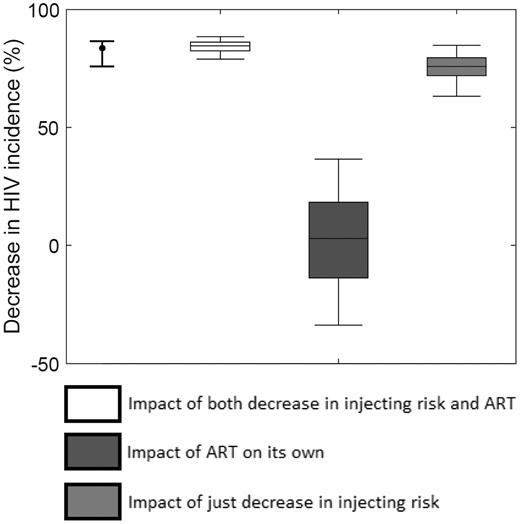
Model projections of the degree to which ART on its own (dark grey box), just reductions in injecting risk (light grey box), or both combined (white box) decrease HIV incidence among PWID in Vancouver over the period 1996 to 2007. Note: we still assume that ART reduces HIV morbidity in all model projections even when ART is assumed to have no effect on HIV transmission. The curve fit estimated decrease in HIV incidence is shown for comparison (point and whisker on left).
Sensitivity analyses
In ANCOVA analyses, most (< 95%) of the variability in the projected overall contribution of ART for decreasing HIV incidence in Vancouver was due to uncertainty in both the level of sexual HIV transmission (τ – contributes 19% to the variability) and the assumed decrease in HIV and HCV incidence between 1996 and 2007 (contributes 28% and 51%, respectively). The effect of all other model parameters was small (Supplementary Figure 1, available as Supplementary data at IJE online). Linear regression analyses also suggested that ART alone would only have achieved moderate impact (≥ 20% decrease in HIV incidence) if the observed decreases in HIV and HCV incidence were towards the upper (86%) and lower (78%) bounds, respectively, of what data suggested and there had been considerable sexual HIV transmission (τ = 25%).
Discussion
HIV treatment to prevent heterosexual HIV transmission is well accepted at the individual level,1,2 and community randomized trials are under way to assess its impact at the population level.54 Although HIV treatment is also likely to reduce parenteral HIV transmission, current evidence for its effectiveness is limited4.
Although both modelling and observational data will suffer from weaknesses, specifically in terms of evidence for causation, our analyses are still useful for raising alternative hypotheses for why HIV incidence declined in Vancouver. In contrast to earlier studies, our evaluation suggests large decreases in injecting risk dramatically reduced HIV incidence in Vancouver between 1996 and 2007, with the scale-up of HIV treatment over that period playing a smaller role.4 The current analysis addresses concerns voiced by other researchers.5,6 Without question, scale-up of ART occurred35 and this scale-up probably contributed to a decline in ‘community viral load’.4,55 However, the concurrent decline in HCV incidence10,12 observed during the scale-up of ART indicates that injecting risks also decreased,10,38 and contributed to the decrease in HIV incidence. Indeed, our model projections suggest that the reductions in injecting risk required to reproduce the observed declines in HCV incidence probably accounted for most (∼ 90%) of the observed decline in HIV incidence. These projections are consistent with ART only contributing an additional 8% (2–19%) decrease in HIV incidence on top of reduced injecting risk. Although uncertain, possible reasons for this small contribution of ART could be the moderate ART coverage (∼ 40% of HIV-infected PWID) and low proportion of HIV-infected PWID that were virally suppressed (less than 28%) over this period.4,36,55
Limitations
As with all modelling studies, this analysis has limitations. First, we cannot reject the possibility that the decreases in HIV and HCV incidence were partly due to a closed cohort effect, where the observed HIV and HCV incidence in a cohort tends to decrease over time because the highest-risk PWIDs become infected first with high HIV/HCV incidence risk, followed by successively lower-risk PWID with decreasing HIV/HCV incidence risk.56 However, this should not be a concern because the Vancouver PWID cohort was an open cohort,11 and data from other more recent cohorts in Vancouver (ARYS) suggest similar HCV incidence rates among PWID (6.5 per 100 person-years) and very little HIV transmission.57 Also, one could hypothesize that HCV incidence decreased due to the epidemic saturating or peaking at high prevalence, rather than due to decreases in injecting risk. However, this was not considered the main effect in a recent analysis evaluating the decreases in HCV incidence in Vancouver since 1996.10 This is supported by data showing HCV incidence remained high till 2000 (> 15 per 100 person-years) despite there being high HCV sero-prevalence (82%),10,11 and as Figure 1 shows, the decreases in HCV incidence followed HIV incidence trends suggesting that common factors affected both infections, which coincided with large reductions in injecting risk and increases in intervention coverage.10,12,38
Second, uncertainty in the HIV and HCV incidence data made it hard to determine the precise reductions in incidence. Uncertainty in many model parameters also hampered the analysis. To counter these uncertainties, smooth curves were fit to the incidence trends, and our modelling incorporated the uncertainty in these incidence trends as well as the model parameters, and were consistent despite this.
Third, we modelled sexual HIV transmission simply, which we feel is warranted because evidence suggests that it played a small role over this period (see Methods). Further, we assumed the observed decrease in HIV incidence was solely due to decreases in injecting risk and the prevention effect of ART, whereas decreases in sexual HIV risk behaviour may have also contributed. If decreases in sexual risk occurred, our ART impact projections would be optimistic and so should not affect our conclusion of a limited effect of ART. We also assumed there was negligible sexual HCV transmission, which is rare9,13 unless associated with anal sex,14,27 This behaviour was reported by less than 10% of PWID in Vancouver,58,59 and even among MSM much lower HCV incidence rates normally occur than among PWID.27,60
Fourth, our modelling did not attempt to explicitly attribute the decline in injecting risk to specific interventions, although our modelled decline (60%) was consistent with observed reductions in syringe sharing.38 However, a number of important determinants of injecting risk changed concurrently with the declines in HIV/HCV incidence, and so could account for our predicted decrease in injecting risk. These include OST scaling-up from about 12% to 40% of PWID,12 changes in syringe exchange programme policy,38 recent incarceration decreasing from 35% to 15% of PWID in the past 6 months and unstable housing12 decreasing from 63% to 50% of PWID, all of which have been shown to be associated with decreased individual HIV and HCV acquisition risk in Vancouver,10,38,43,61–63 Subsequent analyses should evaluate the potential population impact of these intervention and structural changes.
Fifth, because of a lack of evidence we assumed that ART does not affect HCV infectivity. This could be a conservative assumption as some studies suggest HCV viral loads are elevated among individuals on ART.26 Last, we did not consider the impact of ART in Vancouver for more recent years8,36,37 because this was not the primary aim of our analysis. It is likely that ART has had more impact since 2007, as has been considered in other recent modelling,64 because the coverage of ART, retention and viral suppression are now much higher.8,36,37
Other evidence
The impact of HIV treatment as prevention among PWIDs has been considered in other modelling analyses,65–69 including Vancouver64. Despite limited evidence, these analyses a priori assumed that ART had moderate to high efficacy for preventing parenteral HIV transmission.64 Through modelling competing hypotheses for why HIV incidence decreased in Vancouver, we estimate the potential effectiveness of treatment as prevention among PWID in a specific setting, and test the robustness of findings from earlier analyses.
Conclusions
Reducing HIV and HCV transmission among PWID remains a critical goal. The considerable (> 75%) reductions in HCV and HIV incidence that occurred among PWID in Vancouver represents a remarkable success for intensive harm reduction interventions. Although ART is undoubtedly important for reducing HIV morbidity and mortality,70 our analyses suggest that it may not have substantially reduced HIV transmission among PWID in Vancouver over this period. As with all modelling, our analysis cannot replace empirical evidence, but the insights obtained do give alternative hypotheses for why HIV incidence declined. This does not diminish the potential for HIV treatment as prevention among PWID, but rather suggests that further studies are needed to determine its benefits.54
Supplementary Data
Supplementary data are available at IJE online.
Funding
Authors acknowledge support from the NIHR Health Protection Research Unit on Intervention Evaluation, the National Institute for Drug Abuse [grant number R01 DA037773‐01A1] and the University of California San Diego Center for AIDS Research(CFAR), a National Institute of Health (NIH)-funded programme [grant number P30 AI036214]. P.V. also acknowledges support from the Bill and Melinda Gates-funded HIV Modelling Consortium. Role of funding body: none.
Author contributions
P.V. developed the initial research question. P.V. and N.K.M. developed the initial analysis plan. C.M. developed the model and undertook initial modelling analyses, which were then adapted and finalized by H.F. P.V. wrote the initial draft manuscript with C.M. and N.K.M. All authors contributed to the analysis concept and gave in-depth comments on the analyses undertaken and the manuscript. All authors have full access to all data from the study.
Conflict of interest: N.K.M. has received unrestricted research grants from Gilead unrelated to this work, and honoraria from Gilead, AbbVie and Merck. All authors declare: no further support from any organization for the submitted work; no financial relationships with any organizations that might have an interest in the submitted work in the previous 3 years;and no other relationships or activities that could appear to have influenced the submitted work.
Key Messages
Existing evidence for the prevention benefit of ART among people who inject drugs (PWID) is based on observed temporal associations between community measures of decreasing HIV viral load and decreasing HIV incidence in Vancouver and Baltimore.
Through examination of concurrent declines in HCV incidence in Vancouver, our modelling suggests that reductions in injecting risk may have been the main reason for the observed declines in HIV incidence among PWID, with ART playing a smaller role.
Further evidence for the potential prevention benefit of ART among PWID is urgently needed.
References

