


Abstract
Preterm birth (PB) is an important predictor of childhood morbidity and educational performance. Beyond the known risk factors, environmental factors, such as air pollution and noise, have been implicated in PB. In urban areas, these pollutants coexist. Very few studies have examined the effects of multi-exposure on the pregnancy duration. The objective of this study was to analyse the relationship between PB and environmental chronic multi-exposure to noise and air pollution in medium-sized cities.
A case-control study was conducted among women living in the city of Besançon (121 671 inhabitants) or in the urban unit of Dijon (243 936 inhabitants) and who delivered in a university hospital between 2005 and 2009. Only singleton pregnancies without associated pathologies were considered. Four controls were matched to each case in terms of the mother’s age and delivery location. Residential noise and nitrogen dioxide (NO2) exposures were calculated at the mother’s address. Conditional logistic regression models were applied, and sensitivity analyses were performed.
This study included 302 cases and 1204 controls. The correlation between noise and NO2 indices ranged from 0.41 to 0.59. No significant differences were found in pollutant exposure levels between cases and controls. The adjusted odds ratios ranged between 0.96 and 1.08. Sensitivity analysis conducted using different temporal and spatial exposure windows demonstrated the same results.
The results are in favour of a lack of connection between preterm delivery and multi-exposure to noise and air pollution in medium-sized cities for pregnant women without underlying disease.
Preterm birth (PB) is an important predictor of childhood morbidity and educational performance. Environmental factors, such as air pollution and noise, have been incriminated in PB.
In urban areas, noise and air pollution exposures are cumulative. Very few studies have examined the effects of multi-exposure over the duration of pregnancy.
The results favour a lack of connection between preterm delivery and low to moderate exposure to noise and air pollution in medium-sized cities for pregnant women without underlying disease.
Introduction
Preterm birth (PB) is defined as birth before 37 weeks of gestation, and the prevalence ranges from 5% to 18% of births worldwide.1 A rising trend in PB has been observed over the past decade. In 2010, the rate was 7.4% in France.2 PB is an important predictor of childhood morbidity and educational performance. It has also been associated with adult chronic diseases, including cardiovascular diseases and diabetes.3–5 Risk factors suggested to be associated with PB include the following: pregnancy diseases (antepartum haemorrhage, hypertensive disorders, infectious pregnancy complications and diabetes); intrinsic and behavioural maternal factors (extreme maternal age or pre-pregnancy body mass index and maternal smoking); and socioeconomic conditions.6–11
However, half of preterm births remain unexplained, and the environment appears to have a possible effect on preterm delivery.12 In the urban environment, due to the density of road and rail traffic which is a common source of noise and air pollutants, people are subject to multi-environmental exposure. Nearly 15% of the European population is exposed to daily average noise or air pollutant levels exceeding the threshold set by the European community.13–14 In cities with more than 250 000 inhabitants, 55% of the population is exposed to daily road noise levels exceeding these thresholds.
There is growing evidence that exposure to high levels of air pollution during gestation is associated with adverse birth outcomes, such as PB. This is especially true for high levels of nitrogen dioxide (NO2), a gaseous pollutant known to be the main indicator of road traffic.15–17 The effects of noise on the pregnancy duration have been discussed, and there are contradictory results, depending on the study.18,19 The pathophysiological pathways involved in the potential effect of noise or air pollution rely on similar mechanisms: interference with the immune system,20–21 endothelial dysfunction, atherosclerosis and increased blood pressure.22–28 Noise and air pollution are both suspected to increase oxidative stress29–30 and to induce a pro-inflammatory and pro-thrombotic state.31 Such a state induces placental hypoperfusion, which could lead to in utero fetal death when severe and to gestational hypertension when moderate;32 it could also induce intrauterine growth restriction.33
However, the relative contributions of noise and air pollution to adverse pregnancy outcomes and how these effects could act in combination (potentiation, mediation etc.) remain unknown so far. The few existing studies quantifying multi-exposure to noise and air pollution have shown a moderate correlation, and the results are influenced by the methods used to assess exposure.34–37 Few epidemiological studies have simultaneously analysed the health effects of noise and air pollution, and they have mainly investigated the effects on cardiovascular diseases.38–40 To the best of our knowledge, there is only one published study on the consequences of multi-environmental exposure to noise and air pollution during pregnancy.41
The main objective of this study was to analyse the relationship between preterm birth and chronic environmental multi-exposure to noise and NO2 air pollution in medium-sized cities. The secondary objective was to assess the relative contribution of each factor.
Methods
A multicentric, case-control study was conducted to compare the level of residential exposure to noise and air pollution of women who delivered prematurely and women who delivered at term.
Study population
This study focused on pregnancies resulting in singleton births that occurred in the university hospitals of Besançon and Dijon (medium-sized cities in eastern France) between 1 January 2005 and 31 December 2009. Inclusion criteria for mothers were the following: age 18 and over and living in Besançon City (65 km2, 121 671 inhabitants in 2008) or in the urban unit of Dijon (166 km2, 243 936 inhabitants in 2008) on the date of delivery.42 These two cities were sharing common environmental pollution sources: road and railway traffic were considered as the main contributor to both noise and air pollution. The 5-year period was chosen for homogeneity of the environment, and this period ended just before the beginning of the tram network building in the two cities. The sample included both stillborn and live newborns, whose births occurred after 22 completed weeks of gestation and/or with a birth weight >500 g. Women were considered only once in the study. In the case of repeated deliveries during the period, one delivery was randomly selected. Multiple pregnancies were not included because of special characteristics in terms of the pregnancy duration and fetal growth. Induced abortions and pregnancies with missing or invalid data for the delivery date or address were excluded. Pregnancies with associated pathology (antepartum haemorrhage, hypertensive disorders, infectious pregnancy complications, diabetes, fetal growth restriction, hydramnios, abnormalities of the female reproductive tract, uterine scarring and infant congenital abnormalities) were excluded (Supplementary Table 1, available as Supplementary data at IJE online). Some of these pathologies are suspected to be associated with noise or air pollution. This choice was made to control for a potential mediation or confusion effect and to homogenize the target population to be a ‘healthy pregnant population’.
All eligible pregnancies with delivery before 37 weeks of gestation were included as cases. For each case, four controls (deliveries after 37 weeks of gestation) that were matched to the place of delivery and the mother’s age (+/− 1 year) were randomly selected. The number of necessary cases was estimated as 212 cases (unilateral approach, proportion of exposure among controls = 0.33, odds ratio = 1.5 and statistical power = 80%).
Individual data
Data on pregnancies and deliveries were obtained from the computerized obstetrical record of each university hospital (DIAMMTM software for Besançon and Burgundy perinatal network for Dijon) and from the medical records for women who delivered at Dijon hospital. The maternal address and age at delivery, maternal pre-pregnancy body mass index (BMI), maternal employment during pregnancy, household (living alone versus married, cohabitation and other), parity, maternal smoking during pregnancy and associated pathologies were collected.
Collective socioeconomic data
A deprivation index was computed at the geographical scale of the French ‘IRIS’ areas (approximately 2000 people).43 The 2008 population censuses database and R package SesIndexCreatoR44 were used. Women living in an IRIS ranked in the 10th decile were considered to have a very low neighbourhood socioeconomic level.
Noise and air pollution residential exposure assessment
The residential exposure assessments were previously described.45–49 Outdoor noise levels and NO2 concentrations were calculated for each residential building. Exposures were linked to participants through their addresses at the date of delivery.
Noise levels were calculated in accordance with the European Commission’s Environmental Noise Directive 2002/49/CE using MITHRA-SIG v3.7 (Geomod/CSTB) software.50 The following four types of noise sources were considered: road traffic, rail traffic, pedestrian streets, and fountains. Individual aircraft noise data were not available for the 2005–09 period (military airport located inside the site of Dijon). Women living in the area exposed to aircraft noise (according to the urban unit noise exposure plan) were not considered in this study. Theoretical noise levels were calculated in front of each building façade on each floor. Measurement campaigns were used for validation (76 points). For each woman, the average building noise levels in front of the entire facade, in front of the most exposed façade and in front of the less exposed façade were calculated using the following three indices: the daily equivalent A-weighted noise level, LAeq,24h; night equivalent A-weighted noise level LAeq,night (22:00–6:00 h); and combined day-evening-night A-weighted noise level Lden, with evening and night exposures penalized by 5 and 10 dB, respectively.
The NO2 pollution levels were calculated by the French air quality monitoring agencies ATMO Franche-Comté and Atmosf’AirBourgogne, using Circul’Air and ADMS-Urban (Numtech/Cambridge Environmental Research Consultants) software. To adjust for seasonal variations, hourly meteorological data were used to calculate the monthly NO2 concentrations from January 2004 to December 2009. ESRI arcGIS© (V9.3.1) software was used to produce a 4-m2 (2 m × 2 m) raster grid with each pixel giving the NO2 concentration at 2 m above ground (µg/m3). NO2 models were validated using field measurements made by the air quality monitoring agencies (863 passive samplers and nine air-quality monitoring stations). Averaged indices were calculated over the following defined periods from the date of delivery: first trimester, second trimester, third trimester, entire pregnancy and 2 months before delivery. The NO2 indices were calculated in front of the building and in the immediate neighbourhood (i.e. within 50 m around the building) according to previous studies on multiple noise and air pollution exposure assessments in an urban area.49,51
Statistical analysis
Descriptive statistics are presented as the means and standard deviations (SD) or as the frequencies and percentages (%). Missing data were analysed in a search for a non-random distribution, particularly a statistical link with the case-control status and environmental noise and NO2 levels. Conditional logistic regression models were used to assess the relationship between the PB and both the LAeq,24h and NO2 exposure levels. Sensitivity analyses were performed using Lden and LAeq,night for each building instead of LAeq,24h, as well as using the mean NO2 during each trimester of the pregnancy and during the last and last two months before delivery instead of the NO2 level during the entire pregnancy. A missing value category was assigned to subjects for whom no values for the potential confounding factor(s) were available. The variables associated with PB at a P-value ≤ 0.20 in the bivariate analysis were included in the multivariate analysis using a backward step-by-step elimination procedure. Multilevel models were also performed to consider the potential hierarchical structure of the data as follows: city of birth level, IRIS level and individual level. SAS version 9.4 software (SAS Institute, Cary, NC) and MLwiN 2.24 (University of Bristol, UK) were used to perform the analyses.
Ethics
This study was approved by the French National Advisory Committee for the Treatment of Information in Health Research (CCTIRS) and by the French National Computing and Freedom Committee (CNIL). An information letter was sent to each woman included in the study.
Results
Over the 2005–09 period, 10 905 deliveries with the mother’s residential address located in the study area were identified. The proportions of singleton pregnancies without associated pathology were 61% and 63% in the Besançon and Dijon hospitals, respectively. Among them, the proportion of preterm births was 6.74% in the Besançon hospital and 5.71% in the Dijon hospital. One case and one control refused to participate in this study. Finally, 1506 singleton pregnancies were included in the analysis, consisting of 302 cases and 1204 controls. All but two cases were matched with four controls; one case was matched with only one control, and one was matched with three controls.
Characteristics of mothers, pregnancies and newborns
Cases and controls were similar in terms of the year of delivery, mother’s employment status, socioeconomic index and newborn’s sex. Conversely, cases and controls differed in terms of the nulliparity, maternal age, pre-pregnancy body mass index, Apgar score at 5 min, birthweight and newborn head circumference (Table 1).
Study population characteristics according to the inclusion case or control status (n = 1506, conditional logistic regression)
| Cases | Controls | P | |||
|---|---|---|---|---|---|
| n | (%) | n | (%) | ||
| Total | 302 | 1204 | |||
| Hospital of delivery | |||||
| Dijon University Hospital | 180 | (59.6) | 719 | (59.7) | |
| Besançon University Hospital | 122 | (40.4) | 485 | (40.3) | |
| Year of delivery | 0.42 | ||||
| 2005 | 53 | (17.6) | 209 | (17.4) | |
| 2006 | 60 | (19.9) | 221 | (18.3) | |
| 2007 | 62 | (20.5) | 224 | (18.6) | |
| 2008 | 69 | (22.9) | 256 | (21.3) | |
| 2009 | 58 | (19.2) | 294 | (24.4) | |
| Maternal age at delivery (years) | 0.03 | ||||
| <20 | 12 | (4.0) | 61 | (5.1) | |
| 20–35 | 246 | (81.4) | 948 | (78.7) | |
| >35 | 44 | (14.6) | 195 | (16.2) | |
| Pre-pregnancy body mass index (kg/m2)a | 0.08 | ||||
| <18.5 | 31 | (11.3) | 86 | (7.5) | |
| 18.5–25 | 178 | (65.0) | 746 | (64.9) | |
| 25–30 | 44 | (16.1) | 224 | (19.5) | |
| ≥30 | 21 | (7.7) | 93 | (8.1) | |
| Maternal employment during pregnancya | 176 | (65.4) | 697 | (64.7) | 0.57 |
| Householda | 0.09 | ||||
| living alone | 32 | (11.5) | 96 | (8.4) | |
| married, cohabiting, others | 247 | (88.5) | 1041 | (91.6) | |
| Neighbourhood socioeconomic index: 10th decile | 43 | (14.2) | 193 | (16.0) | 0.42 |
| Nulliparitya | 184 | (61.7) | 644 | (54.4) | 0.03 |
| Maternal smoking during pregnancya | 64 | (22.0) | 211 | (18.0) | 0.14 |
| Premature rupture of membranes | 87 | (28.8) | 139 | (11.5) | <0.001 |
| Preterm labour | 229 | (75.8) | 40 | (3.3) | <0.001 |
| Mode of delivery | 0.55 | ||||
| vaginal delivery | 266 | (88.1) | 1076 | (89.4) | |
| caesarean delivery | 36 | (11.9) | 128 | (10.6) | |
| Sex of childa | 0.34 | ||||
| male | 162 | (53.6) | 610 | (50.8) | |
| female | 140 | (46.4) | 592 | (49.3) | |
| Apgar score at 5 min = 10 | 222 | (84.1) | 1089 | (92.5) | <0.001 |
| Mean | (SD) | Mean | (SD) | ||
| Maternal age at delivery (years) | 29.0 | (6.1) | 28.9 | (5.9) | <0.001 |
| Pre-pregnancy body mass index (kg/m2)a | 23.0 | (4.5) | 22.5 | (4.4) | 0.02 |
| Birthweight of child (g)a | 2341.3 | (664.4) | 3373.3 | (425.7) | <0.001 |
| Head circumference of child (cm)a | 31.7 | (3.2) | 34.3 | (1.4) | <0.001 |
aMissing data : pre-pregnancy BMI (n = 83), maternal employment during pregnancy (n = 160), household status (n = 90), nulliparity (n = 24), maternal smoking during pregnancy (n = 44), sex (n = 2), Apgar score at 5 min (n = 65), birthweight (n = 1), head circumference (n = 87).
Environmental noise and NO2 exposure
The correlation between noise and NO2 indices ranged from 0.41 to 0.59. Correlations between various NO2 exposure indices ranged from 0.79 to 0.99, and correlations between various noise exposure indices ranged from 0.52 to 0.97. The distribution of the daily average building noise level in front of the entire facade (Building LAeq,24h) and the average NO2 concentration in 50 m around the residential building (50 ‐m NO2) during the entire pregnancy according to the case/control status of deliveries are presented in Figure 1.
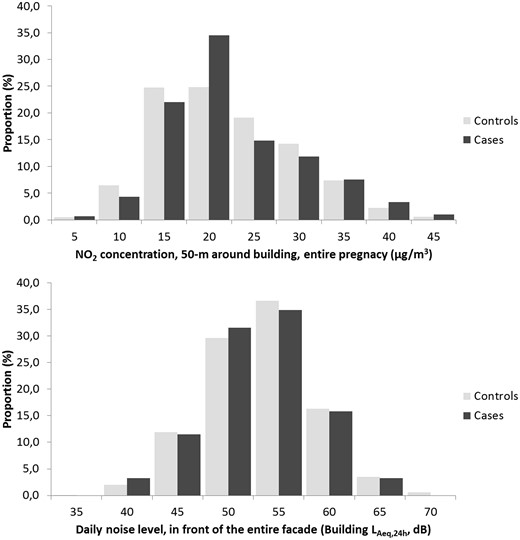
Distribution of the daily average building noise level (LAeq,24h), per 5 dB, and the 50-m average NO2 concentration during the entire pregnancy, per 5 µg/m3, for the cases and controls.
The odds ratios associated with Building LAeq,24h were 0.94, 95% confidence interval (CI) = (0.83–1.07) (treated as quantitative), and 0.94 (0.84–1.07) (using the 55-dB threshold). The results are very similar for various noise indices. Similarly, the odds ratios associated with the 50 ‐m NO2 concentration during the entire pregnancy were 1.05 (0.87–1.27) (treated as quantitative) and 1.06 (0.75–1.51) (threshold: 40 μg/m3 during at least 1 month of pregnancy). Sensitivity analysis, which was conducted by varying the exposure window, did not modify the results. The analysis based on multi-exposure indices (combined noise and NO2) led to similar results (Table 2).
Noise and NO2 exposure levels according to the inclusion case or control status (n = 1506, conditional logistic regression)
| Cases | Controls | OR | 95% CI | P | ||||
|---|---|---|---|---|---|---|---|---|
| (n = 302) | (n = 1204) | |||||||
| Noise exposure | ||||||||
| Mean | (SD) | Mean | (SD) | |||||
| Building LAeq,24h (dB) | 55.5 | (5.2) | 55.8 | (5.4) | 0.94b | 0.83 | 1.07 | 0.35 |
| Building LAeq,night (dB) | 51.7 | (5.6) | 52.1 | (5.9) | 0.93b | 0.83 | 1.04 | 0.21 |
| Building Lden (dB) | 57.9 | (5.6) | 58.3 | (5.9) | 0.94b | 0.85 | 1.05 | 0.30 |
| n | (%) | n | (%) | |||||
| Building LAeq,24h ≥ 55 dB | 164 | (54.3) | 687 | (57.1) | 0.94c | 0.84 | 1.07 | 0.35 |
| Building LAeq,night (dB) ≥ 55 dB | 85 | (28.5) | 353 | (29.3) | 0.93c | 0.83 | 1.04 | 0.21 |
| Building Lden ≥ 55 dB | 209 | (69.2) | 843 | (70.0) | 0.97c | 0.73 | 1.29 | 0.81 |
| NO2 exposure | Mean | (SD) | Mean | (SD) | ||||
| 50 ‐m NO2, entire pregnancy (µg/m3) | 24.8 | (7.5) | 24.6 | (7.4) | 1.05d | 0.87 | 1.27 | 0.60 |
| 50 ‐m NO2, first trimester (µg/m3) | 24.8 | (7.8) | 24.8 | (7.8) | 1.02d | 0.85 | 1.22 | 0.87 |
| 50 ‐m NO2, second trimester (µg/m3) | 24.9 | (7.6) | 24.6 | (7.8) | 1.08d | 0.90 | 1.29 | 0.43 |
| 50 ‐m NO2, third trimester (µg/m3)a | 24.8 | (8.1) | 24.6 | (7.7) | 1.05d | 0.87 | 1.26 | 0.62 |
| 50 ‐m NO2, during the 2 last months before delivery (µg/m3) | 24.7 | (8.0) | 24.7 | (8.1) | 1.05d | 0.88 | 1.25 | 0.58 |
| n | (%) | n | (%) | |||||
| 50 ‐m NO2 ≥ 40 µg/m3 during at least 1 month of pregnancy | 53 | (17.8) | 203 | (16.9) | 1.06c | 0.75 | 1.51 | 0.74 |
| Multi-exposure 1 | 0.26 | |||||||
| Building LAeq,24h < 55 dB AND 50 ‐m NO2 < 40 µg/m3 during at least 1 month of pregnancy (as reference) | 132 | (43.7) | 482 | (40.0) | 1 | |||
| Building LAeq,24h ≥ 55 dB OR 50 ‐m NO2 ≥ 40 µg/m3 during at least 1 month of pregnancy | 123 | (40.7) | 554 | (46.0) | 0.82 | 0.62 | 1.06 | |
| Building LAeq,24h ≥ 55 dB AND 50 ‐m NO2 ≥ 40 µg/m3 during at least 1 month of pregnancy | 47 | (15.6) | 168 | (14.0) | 1.03 | 0.70 | 1.57 | |
| Multi-exposure 2 | 0.78 | |||||||
| Building LAeq,night (dB) < 55 dB AND 50 ‐m NO2 < 40 µg/m3 during at least 1 month of pregnancy (as reference) | 196 | (64.9) | 767 | (63.7) | 1 | |||
| Building LAeq,night (dB) ≥ 55 dB OR 50 ‐m NO2 ≥ 40 µg/m3 during at least 1 month of pregnancy | 74 | (24.5) | 318 | (26.4) | 0.92 | 0.68 | 1.23 | |
| Building LAeq,night (dB) ≥ 55 dB AND 50 ‐m NO2 ≥ 40 µg/m3 during at least 1 month of pregnancy | 32 | (10.6) | 119 | (9.9) | 1.06 | 0.68 | 1.65 | |
aMissing data: term less than 29 weeks (n = 23).
bThe ORs are expressed for an increase of 5 dB.
cThe ORs are expressed for exposed versus non exposed patients (reference).
dThe ORs are expressed for an increase of 10 µg/m3.
After adjusting for the maternal age at delivery, the BMI before pregnancy and smoking status during pregnancy, nearly all odds ratio associated with noise and NO2 exposure converged to 1 (Table 3). Multi-level analyses demonstrated similar results.
Relation between noise exposure, NO2 exposure and prematurity after adjustment (conditional logistic regression)
| Adjusted OR | 95% CI | P | ||
|---|---|---|---|---|
| Noise exposure for an increase of 5 dB | ||||
| Building LAeq,24h (dB) | 0.96a | 0.84 | 1.10 | 0.52 |
| Building LAeq,night (dB) | 0.93a | 0.68 | 1.28 | 0.67 |
| Building Lden (dB) | 0.95a | 0.84 | 1.07 | 0.40 |
| Exposed vs nonexposed to noise (as reference) | ||||
| Building LAeq,24h ≥ 55 dB | 0.96a | 0.72 | 1.28 | 0.80 |
| Building LAeq,night (dB) ≥ 55 dB | 0.93a | 0.68 | 1.28 | 0.67 |
| Building Lden ≥ 55 dB | 1.05a | 0.77 | 1.45 | 0.75 |
| NO2 exposure for an increase of 10 µg/m3 | ||||
| 50 ‐m NO2, entire pregnancy (µg/m3) | 1.03a | 0.83 | 1.28 | 0.77 |
| 50 ‐m NO2, first trimester (µg/m3) | 1.03a | 0.84 | 1.23 | 0.79 |
| 50 ‐m NO2, second trimester (µg/m3) | 1.06a | 0.87 | 1.30 | 0.68 |
| 50 ‐m NO2, third trimester (µg/m3)c | 0.99b | 0.80 | 1.21 | 0.90 |
| 50 ‐m NO2, during the last 2 months before delivery (µg/m3) | 1.00a | 0.82 | 1.21 | 0.96 |
| Exposed vs non exposed to NO2 (as reference) | ||||
| 50 ‐m NO2 ≥ 40 µg/m3 during at least 1 month of pregnancy | 1.08a | 0.72 | 1.62 | 0.70 |
| Multi-exposure 1 | 0.65 | |||
| Building LAeq,24h < 55 dB AND 50 ‐m NO2 < 40 µg/m3 during at least 1 month of pregnancy (as reference) | 1 | |||
| Building LAeq,24h ≥ 55 dB OR 50 ‐m NO2 ≥ 40 µg/m3 during at least 1 month of pregnancy | 0.90a | 0.66 | 1.22 | |
| Building LAeq,24h ≥ 55 dB AND 50 ‐m NO2 ≥ 40 µg/m3 during at least 1 month of pregnancy | 1.08a | 0.69 | 1.69 | |
| Multi-exposure 2 | 0.99 | |||
| Building LAeq,night (dB) < 55 dB AND 50 ‐m NO2 < 40 µg/m3 during at least 1 month of pregnancy (as reference) | 1 | |||
| Building LAeq,night (dB) ≥ 55 dB OR 50 ‐m NO2 ≥ 40 µg/m3 during at least 1 month of pregnancy | 0.99a | 0.71 | 1.38 | |
| Building LAeq,night (dB) ≥ 55 dB AND 50 ‐m NO2 ≥ 40 µg/m3 during at least 1 month of pregnancy | 0.98a | 0.60 | 1.60 | |
aAdjusted on: maternal age at delivery, nulliparity and smoking status during pregnancy (n = 1191).
bAdjusted on : maternal age at delivery, BMI before pregnancy and smoking status during pregnancy (n = 1175).
cMissing data: term less than 29 weeks (n = 23).
Discussion
This study was performed among pregnant women living in an urban area, and it focused on chronic environmental exposure to ambient noise and air pollution at their residential address. No environmental pollutant exposure difference was observed between women who delivered at term and those who gave birth prematurely, for noise and air pollution. Whatever the temporal or spatial modulations used to defined exposure assessments, the results did not change.
The study population only included women from two public university hospitals and did not cover deliveries managed by private hospitals. However, the main characteristics observed in our sample were similar to those observed in the French perinatal survey in 2010, especially for the maternal age and PB rate.2 The retrospective collection of sociodemographic and medical data from computerized obstetric records could have led, at least in some cases, to missing data. However, among the variables with missing data (household, pre-pregnancy BMI, parity, maternal employment status, maternal smoking during pregnancy and sex of the newborn), none of the missing data were associated with the case-control status or environmental multi-exposure to noise and NO2. Care was taken to only include pregnancies without associated pathology, to overcome a possible confounding or modulation effect on the risk of preterm birth.7 Another strength of this study was the inclusion of the mother’s socioeconomic status, both through individual variables (maternal employment during pregnancy and household status) and a deprivation index that was defined with an accurate and reproducible procedure.43 Environmental criteria were directly extracted from the mother’s geocoded address using an entirely reproducible process, and particular attention was paid to identifying the actual address of women at delivery instead of the last address recorded in the hospital information system. Considering the recommendations developed by different authors, many indicators were calculated, and sensitive analyses were performed.52,53 This approach allowed for assessment of the impact of variations in the exposure window and spatial definition (building façade and immediate neighbourhood).
However, our study also has some limitations, especially in the exposure level estimation. Outdoor exposure levels were not measured, but they were modelled, which could have introduced uncertainty in the data. The retrospective nature of the study and long delay between the study period and present time prevented collection of supplementary data that were valid and accurate. Therefore, details of the women's exposure profiles (daily changes and modification during the different trimesters of pregnancy) or residential characteristics (such as building insulation, bedroom location and duration of residence) were not recorded. Furthermore, occupational exposure to noise and air pollution could not be considered. Some features of the pregnancies and deliveries differ slightly between the two sites (Dijon and Besancon). To address these differences, controls were matched to the city where the cases delivered.
Preterm delivery was not associated with noise or NO2 environmental exposure, irrespective of the chosen exposure indices. To quantify the statistical power of the study, the odds ratios that could be statistically identified were calculated a posteriori with consideration of the study size and proportion of controls effectively exposed (Lnight ≥ 55 dB = 29%, NO2 over 40 µg/m3 at least one of the pregnancy months = 17%). These odds ratios were then reported to an increase of 10 µg/l and 5 dB, using the differences between the average exposure levels in the two subgroups (i.e. exposed to Lnight ≥ 55 dB versus Lnight < 55 dB). The smallest odds ratios, which were associated with an increase of 10 µg/m3 of NO2 and an increase of 5 dB (noise), were 1.17 and 1.09, respectively.
The city of Besançon and urban community of Dijon are European ‘medium sized’ cities (i.e. cities of 100 000 to 500 000 inhabitants).54 Pregnant women in these two cities had similar environmental exposure profiles, such as a moderate noise level between 55 and 60 dB (building Lden) and low NO2 exposure, with a median near 20–25 μg/m3 (50 ‐m NO2 during the entire pregnancy). Environmental pollution (especially air pollution) is expected to be higher in larger cities. The similarity in the noise exposure levels between cases and controls favours the absence of a relationship between environmental noise and PB, which is consistent with most studies.18 Conversely, the results from two reviews highlight the association between preterm delivery and NO2 environmental exposure. However, studies showing a statistical relationship have generally been conducted in major cities with higher exposure levels than those observed in this study.15,16 All annual air pollution levels assessed in this study are below the thresholds fixed by legislation and equivalent to or below the European annual average for urban background concentrations, as well as with respect to the values that the World Health Organization (WHO) recommends for protecting public health (data not shown).13,55,56 The two medium-sized cities in this study could be considered as slightly air polluted areas.
Furthermore, a ‘healthy pregnancy effect’ could not be definitively ruled out. Indeed, the study focused on pregnancies in which there were no major health problems during the first or second trimester and no other adverse pregnancy outcomes were identified. Evaluation of these pregnancies could have resulted in the selection of women who could be less sensitive to potential risks factors, such as environmental pollution.
In conclusion, our results are in favour of a lack of connection between preterm delivery and chronic multi-exposure to noise and air pollution in medium-sized cities for pregnant women without underlying disease. These results are reassuring from the public health standpoint, considering that European medium-sized cities represent the largest demographic category of cities. Indeed, more than 44% of the European population lives in a medium-sized city.57 However, the question of multi-exposure of pregnant women with associated pathologies or living in highly polluted areas remains unanswered.
Supplementary Data
Supplementary data are available at IJE online.
Funding
This work was supported by the French Environment and Energy Management Agency (ADEME) [1217C0065] as part of the National Environmental Research and Occupational Health Program 2012 of the French Agency for Food, Environmental and Occupational Health & Safety (ANSES). This study is a part of the ‘PremaBquA’ project: Preterm Delivery and Environmental Multiple Exposure: Noise and Air in Urban areas.
Acknowledgements
Computations were performed on the supercomputer facilities at the Mésocentre de calcul de Franche-Comté. The authors would like to acknowledge the following local associations for air quality monitoring: Atmo Franche-Comté and Atmosf’air Bourgogne; Odile Allemandet, Aude Burtembourg, Alain Dussaucy, Astrid Eckmann and Anne-Laure Parmentier from the Centre Hospitalier Régional Universitaire of Besançon, France; Johan Besson and Said Belhadj from the Centre Hospitalier Universitaire of Dijon; Quentin Tenailleau (Département de Géographie, University of Paris Ouest, France); and the Maison des sciences de l’Homme et de l’environnement (MSHE USR3124) for assistance in this project.
Conflict of interest: The authors declare that they have no competing interests.

