


Abstract
Cross-sectional studies suggest that more green space may lower the odds of prevalent diabetes, hypertension and cardiovascular diseases (CVD) in cities. We assess if these results are replicable for tree canopy exposure and then extend the study longitudinally to examine incident cardiometabolic outcomes.
The study was set in the Australian cities of Sydney, Wollongong and Newcastle. Total green space and tree canopy as percentages of landcover within 1.6 km (1 mile) from home were linked to a residentially stable sample of 46 786 participants in the Sax Institute’s 45 and Up Study (baseline 2006–09; follow-up 2012–15). Separate multilevel models were used to investigate whether the odds of prevalent and incident doctor-diagnosed diabetes, hypertension and CVD were associated with total green space and tree canopy provision, adjusting for age, sex, income, education, employment and couple status.
Lower odds of prevalent diabetes were observed with 1% increases in total green space [odds ratio (OR) 0.993, 95% confidence interval (CI) 0.988 to 0.998] and tree canopy (0.984, 0.978 to 0.989). Lower odds of prevalent CVD were found with a 1% increase in tree canopy only (0.996, 0.993 to 0.999). Lower odds of incident diabetes (0.988, 0.981 to 0.994), hypertension (0.993, 0.989 to 0.997) and CVD (0.993, 0.988 to 0.998) were associated with a 1% increase in tree canopy, but not total green space. At ≥30% compared with 0–9% tree canopy, there were lower odds of incident diabetes (0.687, 0.547 to 0.855), hypertension (0.828, 0.719 to 0.952) and CVD (0.782, 0.652 to 0.935). However, ≥30% compared with 0–4% total green space was associated with lower odds of prevalent diabetes only (0.695, 0.512 to 0.962).
Restoring local tree canopy in neighbourhoods may help to prevent the incidence of cardiometabolic diseases.
Introduction
Prevention of diabetes and other noncommunicable diseases (NCD) is a global health priority that requires multisectoral action.1 Recent studies (e.g.2–5), mostly of cross-sectional design, suggest that protection and restoration of urban green space may be an important component. A meta-analysis6 reported odds ratios (OR) comparing high with low green space near where people lived for prevention of type 2 diabetes [six studies; OR = 0.72, 95% confidence interval (CI) 0.61 to 0.85], hypertension (four studies, OR = 0.99, 95% CI 0.81 to 1.20), and CVD (two studies, OR = 0.92, 95% CI 0.78 to 1.07). Indirect evidence suggests that green spaces may help to prevent diabetes and other NCDs by mitigating air7 and noise8 pollution, reducing stress9 and supporting physical activity.10
Two contexts are important. First, from a methodological perspective, it is known that cross-sectional studies of green space and health are vulnerable to bias induced by healthier people moving to greener areas and vice versa. This health-selective migration can exaggerate and induce correlations where there may be no causation.11 Second, most previous studies examine associations with any form of green space, so when urban planners and landscape architects ask about the health benefits of specific urban greening strategies, such as restoring urban tree canopy, there are no compelling data available to provide strong recommendations.
Triangulation of findings from a range of related studies suggests that the provision of nearby tree canopy may actually be highly consequential. For example, tree canopy may be particularly important for cooling pedestrian areas and ameliorating heat islands.12 This in turn may make it more comfortable (and, perhaps, preferential13) to walk and socialize outdoors, which could explain why previous work has reported higher levels of social capital14 and lower levels of psychological distress15 among populations living nearby more tree canopy. The presence of tree canopy may also be key for cognitive restoration and stress recovery through exposure to natural soundscapes, birdlife and other forms of biodiversity.16
Accordingly, this study had two objectives. First, to assess if the results of previous cross-sectional studies of green space and cardiometabolic health are replicable for tree canopy exposure; And second, to then extend the study longitudinally to examine associations between total green space, tree canopy and incident cardiometabolic outcomes.
Methods
Person-level data
Data on 110 233 participants living in the cities of Sydney, Wollongong or Newcastle in the baseline (2006–09) postal survey of the Sax Institute’s 45 and Up Study17 were extracted in December 2018. Participants at baseline had been randomly sampled from the Department of Human Services (formerly Medicare Australia) enrolment database, which provides near complete coverage of the population. Baseline data were linked to responses from 53 196 (48.3%) of the same individuals in the follow-up postal survey (2012–15). A total of 6410 of these participants relocated from one geographic area to another (proxied by the Statistical Area 2 of residence) between baseline and follow-up and were omitted, leaving a residentially stable population of 46 786. The Statistical Area 2 is a medium-sized geographical unit of 10 000 residents on average and is constructed by the Australian Bureau of Statistics to represent a community that interacts together socially and economically. Participants provided consent for follow-up. The cities of Sydney, Wollongong and Newcastle were defined by the Australian Bureau of Statistics (ABS) Urban Centre and Locality boundary data. The University of New South Wales Human Research Ethics Committee (HREC) approved the 45 and Up Study, and ethics approval for the analyses in this paper was awarded by the University of Wollongong HREC.
Self-reporting of doctor-diagnosed diabetes, hypertension and cardiovascular diseases (CVD) were measured at baseline and follow-up. Affirmative responses to ‘Has a doctor ever told you have […]?’, along with questions pertaining to medication use in the 4 weeks preceding survey completion and previous operations, were used to identify prevalence and incidence of diabetes, hypertension and CVD at baseline and follow-up, respectively. Although there was no distinction made in the survey with respect to type 1 or type 2 diabetes, at age 45 most of the prevalent cases and the vast majority of incident cases will be for type 2 diabetes. Prevalence was defined as affirmative responses to each of the NCDs at baseline, whereas incidence was defined as new cases reported at follow-up. A range of sociodemographic and economic markers of potential confounding used in this study were measured at baseline including age, sex, annual household income, economic status (i.e. employed, retired, unemployed, unpaid work, homemaker, other status), highest educational qualification and couple status.
Green space data
The centroid of the ABS ‘Mesh Block’ of residence for each participant was used as a proxy residential address for assigning indicators of green space provision. At between 30 to 60 dwellings each, the Mesh Block is the smallest geographical scale at which ABS releases census count data and is designed to form the building blocks of larger areas. A 1.6-km (1-mile) road network buffer was constructed around each centroid, based upon published guidance around travel distances by foot.18 Geovision raster data (supplied by Pitney Bowes Ltd for 2016) were used to calculate percentage land use within each buffer pertaining to any type of green space. and a separate indicator for tree canopy. The Geovision data classify a 2-m raster surface into descriptive classes including total green space and tree canopy, including street trees and trees in parks (both deciduous and evergreen). These green space exposures were tested as continuous variables and also in categories (total green space 0–4%, 5–9%, 10–19%, 20–29%, ≥30%; tree canopy 0–9%, 10–19%, 20–29%, ≥30%). Selection of these categories was a priori and based around existing green space standards in Perth (Western Australia), where approximately 10% of subdivisible land is allocated to some form of green open space.19
Statistical analysis
Cross-tabulations, percentages and chi square values were used to explore patterns in prevalent and incident diabetes, hypertension and CVD with respect to both of the green space indicators and the sociodemographic and economic variables. Age and sex-adjusted multilevel logistic regressions were constructed to test associations between each outcome and green space indicator separately. These models were then adjusted sequentially for markers of potential confounding. All of these models were fitted with each person at level 1 and three higher levels of geography corresponding to local communities of 10 000 persons on average (Statistical Area 2), local government areas, major transport and commercial hubs of between 30 000 to 130 000 residents (Statistical Area 3), and labour markets of between 300 000 to 500 000 residents (Statistical Area 4). All models were estimated in MLwIN using Markov Chain Monte Carlo method.20
Results
Prevalences of diabetes, hypertension and CVD at baseline were 6.8%, 39.0% and 12.3%, respectively (Table 1). Comparing people who had ≥30% green space land use within 1.6 km with those with 0–4% green space, the difference in prevalence of CVD was 0.3 percentage points lower, the difference in hypertension prevalence was 1.9 percentage points lower and the difference in diabetes prevalence was 2.7 percentage points lower. Reduced incidences of each NCD were also observed among people with ≥30% as compared with 0–4% of all green space. This was especially so for hypertension (2.5 percentage point difference).
A mostly cross-sectional evidence base suggests that more green space is associated with lower prevalences of diabetes, hypertension and cardiovascular diseases (CVD).
We find that tree canopy is associated with lower odds of incident diabetes, hypertension and CVD.
Total green space was associated with lower odds of prevalent diabetes only.
Larger percentage point reductions were found for the prevalence and incidence of CVD, hypertension and diabetes when restricting the green space indicator to percentage tree canopy. For example, there were 2.4, 6.8 and 5.7 percentage point reductions in the prevalence of CVD, hypertension and diabetes, respectively, between those with ≥30% as compared with 0–9% of tree canopy within 1.6 km. Similar, albeit smaller, percentage point reductions were also observed for NCD incidences.
Full results from the regression models are reported in Supplementary Tables 1–3 (available as Supplementary data at IJE online), with a summary of the results analysing continuous green space exposures reported in Table 2. Lower odds of prevalent diabetes were observed with a 1% increase in total green space (OR 0.993, 95% CI 0.988 to 0.998) and tree canopy (0.984, 0.978 to 0.989). Lower odds of prevalent CVD were found with a 1% increase in tree canopy only (0.996, 0.993 to 0.999). Lower odds of incident diabetes (0.988, 0.981 to 0.994), hypertension (0.993, 0.989 to 0.997) and CVD (0.993, 0.988 to 0.998) were associated with a 1% increase in tree canopy, but not total green space. Square and cubic terms of each green space exposure did not reveal any evidence of non-linearities and were omitted from the models.
Descriptive statistics for the baseline sample with prevalent and incident cardiometabolic diseases
| Baseline prevalence (%) | Incidence by follow-up (n, %) | |||||||||
|---|---|---|---|---|---|---|---|---|---|---|
| Baseline total | CVD | Hypertension | Diabetes | CVD | Hypertension | Diabetes | ||||
| 46786 | 12.3 | 39.0 | 6.8 | 41029 | 5.3 | 28555 | 16.4 | 43137 | 3.9 | |
| Total green space | ||||||||||
| 0–4% | 741 | 11.88 | 40.22 | 8.50 | 653 | 5.82 | 443 | 18.28 | 674 | 3.41 |
| 5–9% | 11056 | 12.06 | 37.64 | 6.69 | 9723 | 5.04 | 6894 | 15.75 | 10212 | 3.73 |
| 10–19% | 12455 | 13.18 | 39.74 | 7.46 | 10814 | 5.84 | 7505 | 17.26 | 11403 | 4.17 |
| 20–29% | 12712 | 12.23 | 39.77 | 7.02 | 11157 | 5.37 | 7657 | 16.68 | 11693 | 4.12 |
| ≥30% | 9822 | 11.61 | 38.34 | 5.76 | 8682 | 4.83 | 6056 | 15.80 | 9155 | 3.35 |
| Chi square | 14 | 17 | 30 | 12 | 9 | 12 | ||||
| P-value | 0.007 | 0.002 | <0.001 | 0.019 | 0.056 | 0.015 | ||||
| Tree canopy | ||||||||||
| 0–9% | 4972 | 13.78 | 43.52 | 10.56 | 4287 | 6.32 | 2808 | 18.84 | 4412 | 5.83 |
| 10–19% | 18041 | 12.44 | 39.54 | 7.60 | 15796 | 5.51 | 10908 | 17.34 | 16472 | 4.36 |
| 20–29% | 11816 | 12.42 | 38.44 | 6.04 | 10348 | 5.47 | 7274 | 16.18 | 10995 | 3.39 |
| ≥30% | 11957 | 11.37 | 36.73 | 4.86 | 10598 | 4.43 | 7565 | 14.53 | 11258 | 2.84 |
| Chi square | 20 | 72 | 210 | 27 | 39 | 95 | ||||
| P-value | <0.001 | <0.001 | <0.001 | <0.001 | <0.001 | <0.001 | ||||
| Age group | ||||||||||
| 45–54 y | 15443 | 3.68 | 24.00 | 3.73 | 14875 | 2.44 | 11736 | 11.49 | 14694 | 2.76 |
| 55–64 y | 16604 | 9.44 | 37.91 | 6.62 | 15037 | 4.41 | 10309 | 17.41 | 15360 | 4.20 |
| 65–74 y | 9178 | 19.88 | 51.83 | 10.07 | 7353 | 8.36 | 4421 | 22.98 | 8163 | 5.01 |
| ≥75 y | 5561 | 32.31 | 62.43 | 10.63 | 3764 | 14.24 | 2089 | 25.66 | 4920 | 4.25 |
| Chi square | 3700 | 3400 | 512 | 1000 | 483 | 83 | ||||
| P-value | <0.001 | <0.001 | <0.001 | <0.001 | <0.001 | <0.001 | ||||
| Sex | ||||||||||
| Male | 21633 | 16.70 | 40.41 | 8.41 | 18020 | 7.09 | 12892 | 18.97 | 19455 | 4.90 |
| Female | 25153 | 8.52 | 37.73 | 5.45 | 23009 | 3.91 | 15663 | 14.37 | 23682 | 3.02 |
| Chi square | 721 | 35 | 160 | 203 | 109 | 102 | ||||
| P-value | <0.001 | <0.001 | <0.001 | <0.001 | <0.001 | <0.001 | ||||
| Annual household income | ||||||||||
| $0–$19 999 | 5573 | 23.20 | 54.89 | 12.69 | 4280 | 9.88 | 2514 | 22.28 | 4818 | 6.00 |
| $20 000–$29 999 | 3261 | 19.87 | 49.80 | 10.09 | 2613 | 8.23 | 1637 | 20.59 | 2903 | 4.99 |
| $30 000–$39 999 | 3114 | 15.06 | 46.40 | 7.23 | 2645 | 6.28 | 1669 | 19.65 | 2866 | 4.19 |
| $40 000–$49 999 | 3190 | 13.82 | 41.07 | 6.83 | 2749 | 5.53 | 1880 | 17.71 | 2946 | 4.28 |
| $50 000–$69 999 | 5347 | 10.23 | 36.54 | 6.02 | 4800 | 4.60 | 3393 | 17.15 | 4963 | 3.47 |
| ≥$70 000 | 17611 | 7.23 | 29.91 | 4.32 | 16338 | 3.31 | 12344 | 13.16 | 16652 | 2.73 |
| Not stated | 8690 | 12.50 | 41.10 | 7.25 | 7604 | 6.04 | 5118 | 18.19 | 7989 | 4.53 |
| Chi square | 1300 | 1500 | 539 | 370 | 207 | 140 | ||||
| P-value | <0.001 | <0.001 | <0.001 | <0.001 | <0.001 | <0.001 | ||||
| Highest educational qualification | ||||||||||
| None | 2927 | 18.76 | 51.04 | 11.72 | 2378 | 8.16 | 1433 | 23.80 | 2550 | 7.14 |
| School | 8054 | 13.88 | 46.35 | 7.75 | 6936 | 6.06 | 4321 | 18.93 | 7377 | 4.27 |
| High school | 4419 | 12.38 | 39.94 | 8.03 | 3872 | 5.32 | 2654 | 17.48 | 4023 | 4.42 |
| Trade | 4170 | 18.06 | 44.72 | 9.04 | 3417 | 8.40 | 2305 | 19.09 | 3729 | 5.04 |
| Certificate/diploma | 10366 | 11.13 | 37.97 | 6.04 | 9212 | 5.18 | 6430 | 16.87 | 9644 | 3.65 |
| University | 16398 | 9.48 | 31.98 | 4.98 | 14843 | 3.79 | 11154 | 13.48 | 15414 | 2.81 |
| Not stated | 452 | 17.92 | 42.92 | 11.06 | 371 | 8.09 | 258 | 17.05 | 400 | 5.25 |
| Chi square | 407 | 768 | 274 | 185 | 162 | 143 | ||||
| P-value | <0.001 | <0.001 | <0.001 | <0.001 | <0.001 | <0.001 | ||||
| Economic status | ||||||||||
| Employed | 26040 | 6.53 | 29.97 | 4.73 | 24339 | 3.44 | 18236 | 14.09 | 24538 | 3.24 |
| Retired | 16762 | 21.30 | 52.64 | 9.74 | 13192 | 8.81 | 7938 | 21.92 | 14971 | 4.68 |
| Unemployed | 645 | 11.94 | 40.00 | 8.37 | 568 | 4.75 | 387 | 19.12 | 585 | 5.30 |
| Unpaid work | 663 | 8.90 | 39.06 | 6.18 | 604 | 4.80 | 404 | 16.83 | 620 | 4.19 |
| Disabled | 566 | 23.32 | 49.29 | 17.49 | 434 | 8.29 | 287 | 17.42 | 463 | 7.56 |
| Homemaker | 1541 | 7.92 | 36.21 | 5.00 | 1419 | 3.95 | 983 | 12.82 | 1456 | 3.85 |
| Other (e.g. study) | 569 | 16.87 | 43.76 | 9.84 | 473 | 6.13 | 320 | 21.56 | 504 | 5.16 |
| Chi square | 2200 | 2200 | 524 | 504 | 265 | 75 | ||||
| P-value | <0.001 | <0.001 | <0.001 | <0.001 | <0.001 | <0.001 | ||||
| Couple status | ||||||||||
| Not in a couple | 10236 | 14.81 | 43.11 | 8.14 | 8720 | 6.43 | 5823 | 17.48 | 9310 | 4.26 |
| In a couple | 36550 | 11.60 | 37.81 | 6.45 | 32309 | 5.00 | 22732 | 16.18 | 33827 | 3.76 |
| Chi square | 76 | 95 | 36 | 28 | 6 | 5 | ||||
| P-value | <0.001 | <0.001 | <0.001 | <0.001 | 0.017 | 0.026 | ||||
CVD: cardiovascular diseases; y, years; income measured in Australian dollars
Adjusted odds of prevalent and incident cardiometabolic diseases in association with total green space and tree canopy: multilevel logistic regressions adjusted for confounding and estimated using Markov Chain Monte Carlo method
| Odds ratio (95% credible interval) | ||
|---|---|---|
| Prevalence | Incidence | |
| Type 2 diabetes | ||
| Total green space | 0.993 (0.988 to 0.998) | 0.998 (0.992 to 1.003) |
| Tree canopy | 0.984 (0.978 to 0.989) | 0.988 (0.981 to 0.994) |
| Hypertension | ||
| Total green space | 0.999 (0.996 to 1.001) | 0.998 (0.994 to 1.002) |
| Tree canopy | 0.997 (0.993 to 1.000) | 0.993 (0.989 to 0.997) |
| CVD | ||
| Total green space | 0.999 (0.996 to 1.002) | 0.998 (0.994 to 1.002) |
| Tree canopy | 0.996 (0.993 to 0.999) | 0.993 (0.988 to 0.998) |
All models adjusted for age, sex, annual household income, highest educational qualification, economic status, couple status.
CVD, cardiovascular diseases.
These results were also largely reflected in the analyses of total green space and tree canopy exposures in categorical format (Supplementary Tables 4–6, available as Supplementary data at IJE online). Figure 1A shows the odds of prevalent diabetes were 0.695 (95% CI 0.512 to 0.962) with ≥30% compared with 0–4% total green space. Total green space was not associated with prevalent hypertension or CVD (Figure 1B and C), or incidence of any of these cardiometabolic diseases (Figure 2A–C). By contrast, clearer associations were observed for tree canopy (Figures 1 and 2). For example, the odds of prevalent diabetes were 0.839 (0.741 to 0.952), 0.744 (0.634 to 0.872) and 0.622 (0.516 to 0.746) for populations with 10—19%, 20–29% and ≥30% tree canopy compared with 0–9% tree canopy. At ≥30% tree canopy, lower odds of incident diabetes (0.687, 0.547 to 0.855), hypertension (0.828, 0.719 to 0.952) and CVD (0.782, 0.652 to 0.935) were also observed.
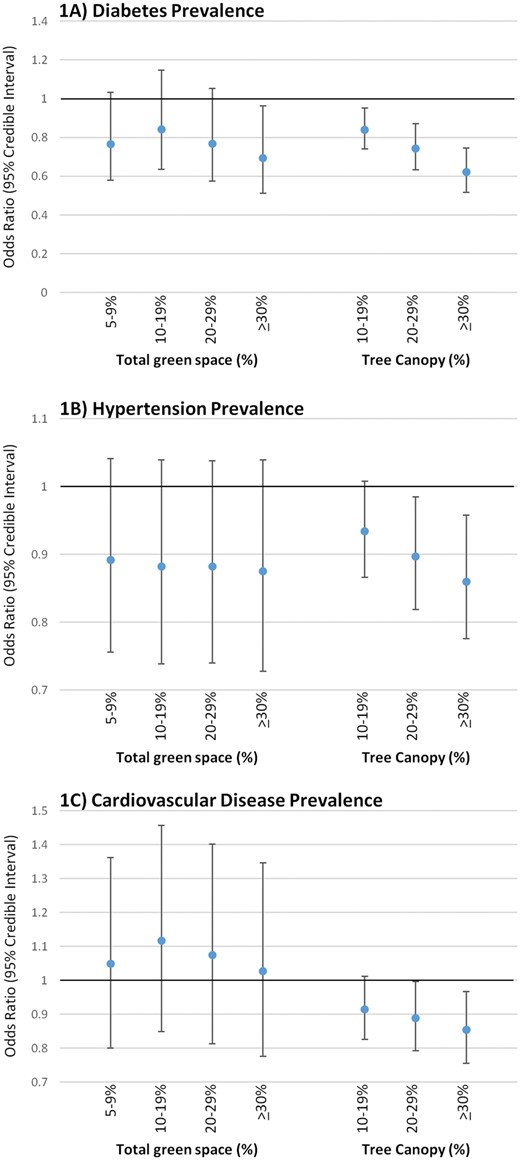
Adjusted odds of prevalent diabetes, hypertension and cardiovascular disease in association with total green space and tree canopy: multilevel logistic regressions adjusted for confounding and estimated using Markov Chain Monte Carlo method.
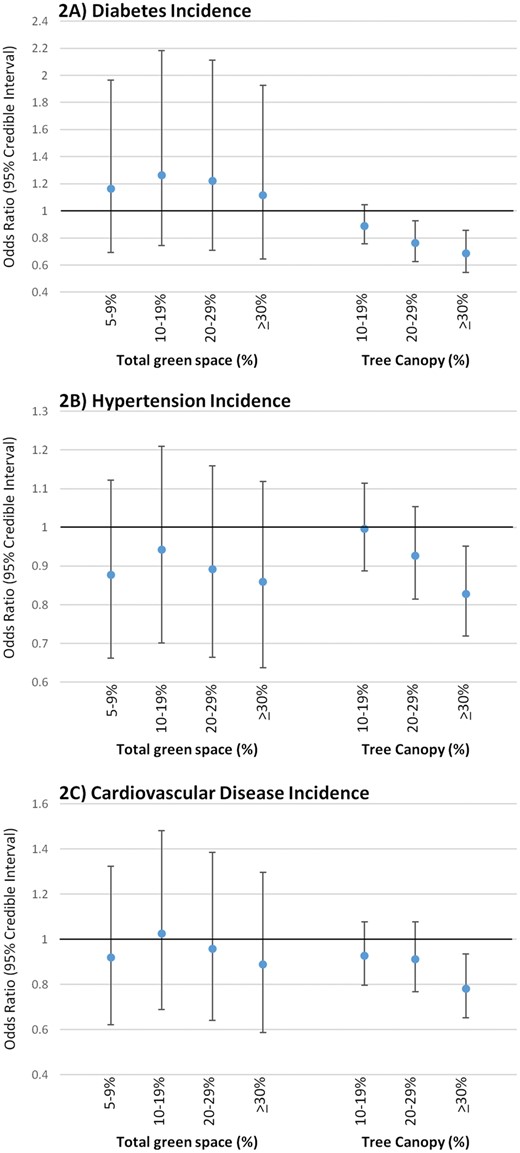
Adjusted odds of incident diabetes, hypertension and cardiovascular disease in association with total green space and tree canopy: multilevel logistic regressions adjusted for confounding and estimated using Markov Chain Monte Carlo method.
Discussion
The key findings from this study are that the odds of prevalent and incident diabetes, hypertension and CVD were all consistently lower with higher tree canopy provision within 1.6 km, whereas total green space was only associated with lower odds of prevalent diabetes. Our longitudinal findings and investigation of potential cardiometabolic health benefits of tree canopy have extended a mostly cross-sectional evidence6 base that has tended to focus on overall green space provision. Although mediation was not a focus of this study, the specific importance of tree canopy may indicate particular mechanisms at play, such as the mitigation of harms from poor air quality and excess heat, natural shade supporting outdoor social and active recreation, and interactions with biodiverse habitats that restore and inspire.
Previous work includes cross-sectional studies in Australia,2 the UK,3 Germany,21 The Netherlands22 and China,5 which have all reported lower prevalence of type 2 diabetes with higher quantities of green space or living within shorter distance of a park. Previously only two longitudinal studies had been conducted, each finding lower odds of developing type 2 diabetes among people living near higher quantities of green space in the UK4 and Australia.23 Three cross-sectional studies in China,24 The Netherlands22 and Austria25 reported lower odds of prevalent hypertension among people living near more green space, with the latter also finding similar results specifically for increased tree canopy within 1000 m. Only one longitudinal study of green space and incident hypertension had been previously conducted, finding no association in Australia.23 Three studies of prevalent CVD and green space had been conducted, each finding affirmative results in The Netherlands,22 the USA26 and China.24 One longitudinal study in Lithuania observed a lower risk of fatal and non-fatal CVD events among people living closer to a green space.27
The consistency of the findings from these studies is encouraging from the perspective of the health case for urban greening in general. Although no non-linearities were observed in our study, the ≥30% interval for tree canopy within 1.6 km was more consistently associated with every NCD outcome. These results for tree canopy compared favourably with those from a recent meta-analysis on green space more generally,6 which found an OR = 0.72 (95% CI 0.61 to 0.85) for diabetes prevalence, whereas we observed an OR of 0.62 (95% CI 0.52 to 0.75) for the prevalence and an OR of 0.69 (95% CI 0.54 to 0.85) for the incidence of diabetes among people with ≥30% versus 0–9% tree canopy. Our study therefore provides new evidence that could play a consequential role in refining expectations on how much NCD prevention could be achieved given investments in protecting and restoring tree canopy in local neighbourhoods. It is possible that tree canopy may be crucial in the design of urban greening strategies within contexts that experience substantial NCD challenges, prone to heat islands, or increasing in population densification. These findings may also be a waypoint for future studies to develop more in-depth knowledge of mediating pathways, including measures of physical activity, social interactions, stress and air quality/temperature regulation.
Strengths of this study include the large residentially stable sample tracking prevalence and incidence of public health priority NCDs over 4 to 10 years, spread across three cities (Sydney, Wollongong and Newcastle) and the use of fine-grained geographical information to construct indicators of green space within 1.6 km road network distance buffers at baseline. Person-level markers of potential confounding, known to influence both NCD risk and the types of neighbourhoods people can select into in the housing market, were adjusted for in the models and were associated with each NCD outcome in the expected directions. Limitations include use of self-reported (albeit, doctor diagnosed) data to measure NCD outcomes and potential underestimation in green space land use, due to loss of provision in some areas over time which could not be measured with the data available. Other environmental characteristics of the local area may influence the associations observed between the cardiometabolic disease outcomes and green space exposures in this study. For example, these associations may be stronger in areas where levels of safety and walkability are high. Our use of random effects to account for multiple hierarchical structures in the data was dependent upon geographies available, and other strategies (e.g. use of a smoothing term with geographical coordinates) could be an alternative in future work. The models considered location at baseline in this residentially stable sample to examine potential lagged effects on NCD incidence, which was important to align exposure before outcome and to minimise bias due to reverse causation, wherein an NCD diagnosis could in some cases result in residential mobility (e.g. for purposes of residing nearer to health care). This strength of the lagged effects design applies to the incidence (i.e. longitudinal) models. However, bias due to reverse causation may still be present in the prevalence (cross-sectional) models. It is worth noting that the results of the prevalence and incidence models were reasonably consistent, but the findings from the longitudinal models ought to be considered more robust.
In conclusion, this paper has taken the epidemiological research on green space and prevention of diabetes and other NCDs forwards, from predominantly cross-sectional studies of prevalence and singular green space indicators to longitudinal studies capable of examining the role of urban tree canopy. The take-home message is that tree canopy may make a substantial contribution towards prevention of diabetes, hypertension and CVD. Future work to isolate potential domain pathways, contingencies and downstream impacts on health service use, disability, quality of life, premature mortality and health economic evaluation are needed to strengthen the business case for the multisectoral action proposed by the World Health Organization (WHO) Action Plan.1 All of these advances are important to provide high quality, evidence-based guidelines for urban planners and landscape architects, to design and manage urban green spaces in under-served areas in such a way as to not only reach standard city planning indicators, but also to help keep entire communities healthy and out of hospital.
Supplementary Data
Supplementary data are available at IJE online.
Funding
This work was supported by the Hort Frontiers Green Cities Fund, part of the Hort Frontiers strategic partnership initiative developed by Hort Innovation, with co-investment from the University of Wollongong (UOW) Faculty of Social Sciences, the UOW Global Challenges initiative and contributions from the Australian Government (project number #GC15005). T.A-B. was supported by a National Health and Medical Research Council Boosting Dementia Research Leader Fellowship (#1140317). X.F. was supported by a National Health and Medical Research Council Career Development Fellowship (#1148792). The work was also supported by a National Health and Medical Research Council Project Grant led by T.A-B. and X.F. (#1101065). All aspects related to the conduct of this study including the views stated and the decision to publish the findings are that of the authors only.
Acknowledgements
This research was completed using data collected through the 45 and Up Study [www.saxinstitute.org.au]. The 45 and Up Study is managed by the Sax Institute in collaboration with major partner Cancer Council NSW; and partners: the National Heart Foundation of Australia (NSW Division); NSW Ministry of Health; NSW Government Family & Community Services – Ageing, Carers and the Disability Council NSW; and the Australian Red Cross Blood Service. We thank the many thousands of people participating in the 45 and Up Study.
Author Contributions
The study design, analysis, interpretation of the data, writing the report and decision to submit the report for publication are of the authors only. T.A-B. and X.F. initiated the study. T.A-B. did the analysis and drafted the report with X.F. Both authors revised the report and provided intellectual input. Both authors approved the final manuscript.
Conflict of interest: None declared.
References
World Health Organization.
National Prevention Council. Annual Status Report. Washington, DC: Department of Health and Human Services, Office of the Surgeon General,
Western Australian Planning Commission. Liveable Neighbourhoods: A Western Australian Government Sustainable Cities Initiative. Perth, WA: WAPC,

