


Abstract
The relation between blood pressure and kidney cancer risk is well established but complex and different study designs have reported discrepant findings on the relative importance of diastolic blood pressure (DBP) and systolic blood pressure (SBP). In this study, we sought to describe the temporal relation between diastolic and SBP with renal cell carcinoma (RCC) risk in detail.
Our study involved two prospective cohorts: the European Prospective Investigation into Cancer and Nutrition study and UK Biobank, including >700 000 participants and 1692 incident RCC cases. Risk analyses were conducted using flexible parametric survival models for DBP and SBP both separately as well as with mutuality adjustment and then adjustment for extended risk factors. We also carried out univariable and multivariable Mendelian randomization (MR) analyses (DBP: ninstruments = 251, SBP: ninstruments = 213) to complement the analyses of measured DBP and SBP.
In the univariable analysis, we observed clear positive associations with RCC risk for both diastolic and SBP when measured ≥5 years before diagnosis and suggestive evidence for a stronger risk association in the year leading up to diagnosis. In mutually adjusted analysis, the long-term risk association of DBP remained, with a hazard ratio (HR) per standard deviation increment 10 years before diagnosis (HR10y) of 1.20 (95% CI: 1.10–1.30), whereas the association of SBP was attenuated (HR10y: 1.00, 95% CI: 0.91–1.10). In the complementary multivariable MR analysis, we observed an odds ratio for a 1-SD increment (ORsd) of 1.34 (95% CI: 1.08–1.67) for genetically predicted DBP and 0.70 (95% CI: 0.56–0.88) for genetically predicted SBP.
The results of this observational and MR study are consistent with an important role of DBP in RCC aetiology. The relation between SBP and RCC risk was less clear but does not appear to be independent of DBP.
The relationship between blood pressure and kidney cancer risk is complex.
The current study sought to better describe the relation of diastolic and systolic blood pressure using prospective data on >700 000 followed research participants of whom 1692 were diagnosed with incident kidney cancer.
The results supported a consistent positive role of diastolic blood pressure in kidney cancer aetiology in both observational and Mendelian randomization studies.
The association of systolic blood pressure with renal cell carcinoma risk does not seem to be independent of diastolic blood pressure.
Introduction
There is a well-established link between elevated blood pressure, hypertension and kidney cancer risk.1–6 Renal cell carcinoma (RCC) accounts for ∼90% of kidney cancers in adults.7 Clinically diagnosed elevated blood pressure—or hypertension—is generally considered a causal risk factor in RCC aetiology.8–12 However, given the central role of the kidneys in regulating blood pressure, the relationship between blood pressure and RCC risk is complex considering the potential for reverse causation due to pre-clinical cancer and confounding by other obesity-related risk factors.1 We previously carried out a study based on genetic markers of blood pressure in a Mendelian randomization (MR) framework and found clear support for a relationship of diastolic blood pressure (DBP), but not systolic blood pressure (SBP), with RCC risk.13 This MR-based study was not subject to the same limitations relating to confounding as traditional observational studies where blood pressure is measured directly and would not be biased by reverse causation. The MR study raised several questions regarding previous observations from prospective cohorts, including whether the respective associations of DBP and SBP with RCC risk are independent and whether undiagnosed kidney cancer may itself cause high blood pressure and bias traditional observational studies through reverse causation.
We sought to describe the relation between blood pressure and RCC in detail based on data on >700 000 prospectively followed research participants from the European Prospective Investigation into Cancer and Nutrition (EPIC) and UK Biobank (UKB). In particular, we aimed to address two specific questions: (i) whether the association between DBP, SBP and RCC risk is influenced by early neoplastic transformations in the kidneys (i.e. by reverse causation) and (ii) whether the risk associations of DBP and SBP with RCC are independent.
Methods
Observational study
Study population
EPIC
EPIC is a large ongoing prospective study of ∼521 000 participants recruited from 1992 to 1999 across 10 European countries. We initially identified 492 762 participants in EPIC (excluding participants from Greece, n = 28 561). We first excluded 12 968 participants with cancer prior to recruitment. We subsequently excluded 200 665 patients due to the lack of diastolic or systolic blood pressure measurements or due to a large difference between the two repeated measures of DBP or SBP (details in ‘Blood pressure measurements’ section), including all participants from four centres due to unavailable blood pressure measurements (two centres in Norway and two in Spain, n = 53 826). We also removed participants (n = 304) without a date of blood pressure measurement and participants with cancer diagnosis before blood pressure measurement (n = 516) (Supplementary Figure S1, available as Supplementary data at IJE online). Data on lifestyle, environmental factors and anthropometric measurements were collected at baseline and the procedures have been described in detail previously.14 Approval for this study was obtained from the ethical review boards of the International Agency for Research on Cancer and from all the EPIC participating centres. Written informed consent was obtained from all participants before entry into the study.
UKB
UKB is a general population cohort study that recruited 502 421 participants from 2006 to 2010 across the UK.15 We excluded 37 580 participants due to cancer prior to recruitment. We also removed participants without DBP or SBP measurement or with a large difference (details in ‘Blood pressure measurements’ section) between the two repeated measures of DBP or SBP (n = 42 122) (Supplementary Figure S1, available as Supplementary data at IJE online). Detailed descriptions of data collection, including information on lifestyle, environmental and anthropometric measurements, have been described in detail previously.15 All participants provided written consent and the study protocol was approved by the North West Multicenter Research Ethics Committee in the UK. This study was conducted accessing the UK Biobank data under application number 15825.
Blood pressure measurements
DBP and SBP were measured in millimetres of mercury (mmHg). In the EPIC cohort, we used the average of the two consecutive readings at the same visit as the exposure variable, except for patients from Sweden and Denmark for whom only one measure was available. If the two measures showed a large difference, defined as >20 mmHg for SBP or >10 mmHg for DBP, the participant was excluded. Blood pressure measures were taken at the date of recruitment visit in Italy, The Netherlands and Denmark centres and at later visits for the centres in France, Spain, the UK, Germany and Sweden. In the UK Biobank cohort, SBP and DBP were each taken twice, a few minutes apart, using an automated reading at the date of recruitment in all centres. We used the same rules in EPIC to calculate DBP and SBP.
Covariates
Data on smoking status (never, former, current), diabetes (yes, no), alcohol intake (grams/week) and medication for hypertension (yes, no) were collected via questionnaires at baseline in both cohorts. Body mass index (BMI) was calculated from height and weight (weight/height,2 kg/m2) measured at the baseline visit.
Follow-up of incident cancer
In EPIC, incident RCC cases were identified either actively through reviews of health insurance records, cancer pathology registries and direct contact with study participants (in France and Germany) or passively through linkage with regional or national cancer registries (in the UK, Denmark, Italy, The Netherlands, Spain, Sweden and Norway). The participants were followed until a first primary malignant cancer, death, loss of follow-up or end of the follow-up (defined as 1 January 2015), whichever came first. The final analysis included 278 309 research participants in EPIC, of whom 715 were diagnosed with an incident RCC (code C64 from the International Classification of Diseases of Oncology 2nd Revision—ICDO-2,16 excluding Wilms tumours, neuroendocrine tumours and sarcomas)17 during 3 966 871 person-years of follow-up (Supplementary Figure S1, available as Supplementary data at IJE online).
In UKB, incident renal cancers and death status were ascertained via individual record linkage to national cancer and mortality registries. Patients were followed until the first primary malignant cancer, death or end of follow-up (defined as 1 April 2021). The final analysis included 422 718 research participants in UKB, of whom 977 were diagnosed with incident RCC (Supplementary Figure S1, available as Supplementary data at IJE online) during 4 739 438 person-years of follow-up.
Statistical analyses
All blood pressure risk analyses estimated hazard ratios (HRs) of RCC per standard deviation increment in SBP or DBP, calculated by cohort. The standard deviation scale was chosen to provide comparable HR estimates between SBP and DBP. In case of missing data, the covariable for the medication for hypertension was defined as ‘No’ if the hypertension was ‘No’. We imputed the missing data for alcohol consumption (29% in EPIC and 31% in UKB), BMI (<1% in EPIC and UKB), diabetes (3% in EPIC and 1% in UKB) and medication for hypertension (15% in EPIC and <1% in UKB) using predictive mean matching (pmm, mice package).18 To evaluate the association between blood pressure and RCC risk, we initially used Cox proportional hazards models with time from blood pressure measurement to event or censoring as the timescale. All models were adjusted for age at baseline and stratified by sex, countries and cohorts. The proportional hazard assumptions were evaluated using Schoenfeld residuals. Due to the high correlation between DBP and SBP, to evaluate the potential for bias due to collinearity, we also fitted ridge regression models, which use L2 regularization that generates penalized association estimates.19
We subsequently modelled the relative hazards of RCC for blood pressure as a function of the follow-up time using flexible parametric survival models.20 The timescale and standard adjustments were the same as in the Cox proportional hazards models. We were interested in evaluating the association between blood pressure and renal cancer risk, both for blood pressure measurements done several years prior to diagnosis—where reverse causation is less likely to influence the association and closer to diagnosis—where reverse causation may have a greater impact. We therefore estimated the relative hazards of RCC for blood pressure by restricted cubic splines, with a manually defined internal knot at 5 years prior to diagnosis and boundary knots at 1 and 10 years before diagnosis. These choices were based on a sensitivity analysis in which the 5-year internal knot provided stable results and made biological sense in that it splits the follow-up period in one in which reverse causation is unlikely to bias the results (i.e. >5 years) and in one in which reverse causation may influence the results (i.e. <5 years). We modelled time-dependent HRs for DBP and SBP separately and mutually adjusted first with minimal adjustment models (adjusted for age at baseline, stratified by sex, countries and cohorts) then multivariable-adjusted models with additional adjustments for known risk factors, including BMI (kg/m2), medication for hypertension (yes, no), diabetes (yes, no), alcohol intake (grams/week) and smoking status (never, former, current).
All analyses were performed using R, version 4.0.0 software. The following specific packages were used: package survival for Cox proportional hazards models,21 version 2.44–1.1; package glmnet for ridge regression,19 version 4.1; package rstpm2 for flexible parametric survival models,22 version 1.5.0; package mice for imputation,18 version 3.13 and package ggplot2 for figures,23 version 3.2.1. This study followed the Strengthening the Reporting of Observational Studies in Epidemiology (STROBE) guidelines (Supplementary Table S1, available as Supplementary data at IJE online).24
MR analyses
In addition to the analyses of measured DBP and SBP, we performed two-sample MR analysis to evaluate the causal effect of DBP and SBP on the risk of RCC. The DBP and SBP genetic instruments were identified from a UKB genome-wide association study (GWAS) based on 375 091 participants of European ancestry by performing the relevant exclusions for each of these exposures separately. We first excluded non-genome-wide significant single-nucleotide polymorphisms (SNPs) (P > 5.10–8) and SNPs with a low imputation quality (IMPUTE2 info score < 0.7).25 We removed the SNPs with a minor allele frequency (MAF) of <0.01. We excluded correlated SNPs in linkage disequilibrium (LD; r2 > 0.01 and separated by <10 000 kb). Palindromic SNPs were either removed or, where possible, replaced with proxy SNPs in genetic linkage (r2 > 0.8) based on data from the Ensembl Project26 if the MAF was <0.4. As result, we finally extracted the summary statistics of 251 SNPs for DBP association (4.6% of variance explained) and 213 SNPs for SBP association (4.2% of variance explained) (Supplementary Table S2, available as Supplementary data at IJE online). These genetic instruments provided an F-statistic for the strength of the relationship between the genetic instrument and the blood pressure levels of 72.0 and 77.7, respectively, which are an estimation of the magnitude of the instrument bias (e.g. F-statistic < 10 for the weak instruments).27 We additionally obtained the corresponding RCC risk GWAS summary statistics from 10 784 cases and 20 406 controls of European ancestry.25 First, we performed a univariable MR and used the random-effects inverse variance-weighted method (IVW) as the main analysis to calculate the odds ratio (OR) of developing RCC for a standard deviation increment in genetically predicted DBP or SBP. To check the robustness of the main results, we compared them with the results of the weighted median approach28 and evaluated the presence of directional (unbalanced) pleiotropy using the MR-Egger method.29 We assessed the effect of potential outlier SNPs on our results using the MR-PRESSO method.30 The contamination mixture model helped us to evaluate the causal effect even in the presence of potential invalid instruments.31 We constructed a funnel plot and a leave-one-out plot to identify potential individual SNPs that might be influencing the overall effect estimate.
Finally, we performed a multivariable MR analysis to provide mutually adjusted association estimates for DBP and SBP with RCC. The 251 and 213 instruments from the univariable analysis were used again here after undertaking further LD clumping (r2: 0.01, clumping windows: 10 000 kb) to account for instrument correlation between the two sets, including 33 SNPs in common for both exposures. As for univariable models, we used the IVW estimates and MR-Egger to assess potential horizontal pleiotropy in the multivariable models. Odds ratios were given for a 1-SD increase in genetically predicted blood pressure.
All MR analyses were done in R (version 4.0) with the packages MendelianRandomization (version 0.5.1),32 TwoSampleMR (version 0.5.6)33,34 and MRPRESSO (version 1.0).30
Results
The characteristics of the study participants from EPIC and UKB are displayed in Table 1. The EPIC final study population included 278 309 eligible participants of whom 715 were diagnosed with RCC during 3 966 871 person-years of follow-up. The final UKB study population included 422 718 eligible participants of whom 977 were diagnosed with RCC during 4 739 438 person-years of follow-up. The majority of cohort participants were women (64% in EPIC and 54% in UKB) and the median age at blood pressure measurement (baseline) was 53 years in the EPIC cohort (IQR: 12.1) and 58 years in UKB (IQR: 13.3). The median age at RCC diagnosis was 66 years old in both cohorts. An important difference between the two cohorts was the recruitment period and thus the length of follow-up (see ‘Methods’ section). This resulted in marked differences in the lead-time distribution: 42% of RCC cases (n = 408) occurred within the first 5 years of follow-up in UKB compared with only 24% in EPIC (n = 173). Conversely, 44% of RCC (n = 314) occurred after 10 years of follow-up in EPIC compared with 9% (n = 85) in UKB. The correlation between SBP and DBP was 0.75 in EPIC and 0.71 in UKB (Supplementary Figure S2, available as Supplementary data at IJE online).
Characterization of EPIC and UKB study participants included in the analyses of blood pressure in relation to risk of renal cell carcinoma
| EPIC | UKB | Overall | |||||
|---|---|---|---|---|---|---|---|
| (PYears: 3 966 871) | (PYears: 4 739 438) | (PYears: 8 706 309) | |||||
| RCC cases | All participants | RCC cases | All participants | RCC cases | All participants | ||
| Overall | 715 | 278 309 | 977 | 422 718 | 1692 | 701 027 | |
| Sex | Female | 320 (44.8%) | 176 812 (63.5%) | 346 (35.4%) | 226 972 (53.7%) | 666 (39.4%) | 403 784 (57.6%) |
| Male | 395 (55.2%) | 101 497 (36.5%) | 631 (64.6%) | 195 746 (46.3%) | 1026 (60.6%) | 297 243 (42.4%) | |
| Age at blood pressure measurement (years) | Median (IQR) | 57.2 (9.8) | 53.3 (12.1) | 61.4 (8.9) | 57.6 (13.3) | 60.1 (9.8) | 55.7 (12.9) |
| BMI (kg/m2) | Median (IQR) | 26.1 (5.0) | 25.0 (5.1) | 28.4 (6.3) | 26.7 (5.7) | 27.5 (5.9) | 26.0 (5.6) |
| Diastolic blood pressure (mmHg) | Median (IQR) | 84.0 (14.0) | 80.0 (14.0) | 83.5 (13.5) | 81.5 (13.5) | 84.0 (13.5) | 81.0 (13.5) |
| Systolic blood pressure (mmHg) | Median (IQR) | 139.0 (25.0) | 130.0 (24.0) | 141.5 (24.0) | 135.5 (24.5) | 140.0 (25.0) | 133.0 (25.5) |
| Smoking status | Current | 213 (30.1%) | 68 376 (24.9%) | 146 (15.0%) | 45 083 (10.7%) | 359 (21.4%) | 113 459 (16.3%) |
| Former | 218 (30.8%) | 80 934 (29.5%) | 406 (41.7%) | 143 311 (34.1%) | 624 (37.1%) | 224 245 (32.3%) | |
| Never | 277 (39.1%) | 124 872 (45.5%) | 421 (43.3%) | 232 199 (55.2%) | 698 (41.5%) | 357 071 (51.4%) | |
| Hypertension treatment | No | 117 (45.7%) | 43 864 (58.6%) | 578 (59.9%) | 335 075 (80.0%) | 695 (56.9%) | 378 939 (76.7%) |
| Yes | 139 (54.3%) | 30 966 (41.4%) | 387 (40.1%) | 83 940 (20.0%) | 526 (43.1%) | 114 906 (23.3%) | |
| Alcohol (g/week) | Median (IQR) | 67.4 (120.5) | 55.8 (97.5) | 156.8 (179.1) | 151.6 (176.6) | 116.4 (155.2) | 111.1 (159.9) |
| Age at diagnosis (years) | Median (IQR) | 66.2 (10.0) | 66.9 (8.9) | 66.7 (9.2) | |||
| Follow-up time to diagnosis (years) | 0–2 | 80 (11.2%) | 146 (14.9%) | 226 (13.4%) | |||
| 2–5 | 93 (13.0%) | 262 (26.8%) | 355 (21.0%) | ||||
| 5–10 | 228 (31.9%) | 484 (49.5%) | 712 (42.1%) | ||||
| >10 | 314 (43.9%) | 85 (8.7%) | 399 (23.6%) | ||||
RCC, renal cell carcinoma; EPIC, European Prospective Investigation into Cancer and Nutrition; UKB, UK Biobank; IQR, interquartile range; PYears, person-years.
The relation between blood pressure and RCC
When initially testing the proportional hazard assumptions based on Schoenfeld residuals, we found them to be dependent on follow-up time (P-value: 0.005 for DBP, 0.007 for SBP, and 0.01 when DBP and SBP were modelled together). To describe the relation between blood pressure and RCC risk during the follow-up, we therefore used the flexible parametric modelling framework and included interaction terms between blood pressure parameters and time.
The minimally adjusted HRs for DBP and SBP as functions of follow-up time are depicted in Figure 1A and D, respectively. Both DBP and SBP were positively associated with risk throughout the follow-up period but the risk associations appeared accentuated closer to diagnosis (P-value for interaction with follow-up time was 0.11 for DBP and 0.04 for SBP). Specifically, a standard deviation increment in DBP (10.4 mmHg) was associated with a hazard ratio (HRSD) of 1.18 (95% CI: 1.11–1.25) when measuring DBP 10 years before diagnosis, 1.17 (95% CI: 1.11–1.23) 5 years before diagnosis and 1.40 (95% CI: 1.11–1.76) close to diagnosis (2 months before diagnosis). The corresponding HRSD estimates for SBP (19.0 mmHg) were similar, at 1.14 (95% CI: 1.08–1.21) 10 years before diagnosis, 1.16 (95% CI: 1.11–1.23) 5 years before diagnosis and 1.46 (95% CI: 1.16–1.83) close to diagnosis (2 months prior to diagnosis). According to the Supplementary Figure, the long-term association of DBP appeared slightly stronger in EPIC (Supplementary Figure S3, available as Supplementary data at IJE online) than in UKB (Supplementary Figure S4, available as Supplementary data at IJE online).
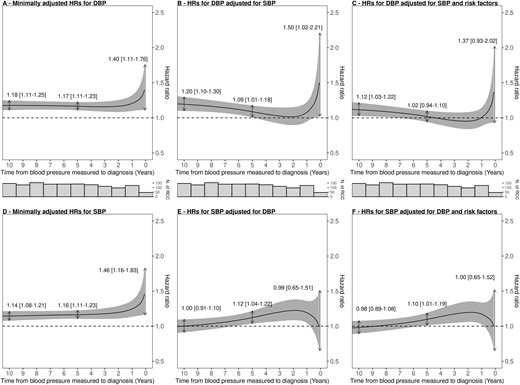
Hazard ratios for renal cell carcinoma from EPIC and UKB per standard deviation on diastolic and systolic blood pressure as a function of time from blood pressure measurement to diagnosis. Model-based HR point estimates are indicated for blood pressure measurements taken 10 years, 5 years and 2 months prior to diagnosis. Hazard ratios (HRs) were estimated using flexible parametric survival models for diastolic blood pressure (DBP) and systolic blood pressure (SBP), respectively, using follow-up time as the timescale, adjusted for age at baseline and additionally stratified by sex, country and cohorts. (A) DBP standard adjustment model; (B) DBP adjusted for SBP in addition to standard variables; (C) DBP adjusted for SBP, body mass index (BMI), hypertension, weekly alcohol intake (in grams) and smoking status in addition to standard variables; (D) SBP standard adjustment model; (E) SBP adjusted for DBP in addition to standard variables; (F) SBP adjusted for DBP, BMI, hypertension, weekly alcohol intake (in grams) and smoking status in addition to standard variables. In addition, histograms of number of RCC cases are shown. EPIC, European Prospective Investigation into Cancer and Nutrition; UKB, UK Biobank.
To evaluate whether the respective risk associations of DBP and SBP were independent, we subsequently included both parameters in the same flexible parametric models whilst maintaining the interaction parameters with follow-up time (Figure 1B and E). After accounting for SBP, we found that DBP remained associated with risk when measured 10 years before diagnosis (HRSD: 1.20, 95% CI: 1.10–1.30), at 5 years before diagnosis (HRSD: 1.09, 95% CI: 1.01–1.18) and increased close to diagnosis (2 months before diagnosis—HRSD: 1.50, 95% CI: 1.02–2.21). Conversely, after accounting for DBP, we did not observe any clear association with risk for SBP (10 years HRSD: 1.00, 95% CI: 0.91–1.10; HRSD close to diagnosis: 0.99, 95% CI: 0.65–1.51).
After additionally adjusting for risk factors (Figure 1C and F), DBP remained associated with risk when measured 10 years before diagnosis (HRSD: 1.12, 95% CI: 1.03–1.22) but not close to diagnosis (2 months before diagnosis—HRSD: 1.37, 95% CI: 0.93–2.02). For SBP, we did not observe a clear association with risk when measured close to diagnosis (HRSD: 1.00, 95% CI: 0.65–1.52) nor a few years before diagnosis.
As a sensitivity analysis, we performed a ridge regression analysis to assess the influence of the collinearity on our association estimates which suggested that such influence was minimal (Supplementary Figure S5, available as Supplementary data at IJE online).
MR results
The results of the MR analysis, together with the long-term association results for EPIC (10-year estimates) and UKB (7-year estimates), are summarized in Figure 2. The univariable MR analysis estimated an OR for RCC risk of 1.12 (0.95–1.33) per SD increment in (genetically predicted) DBP and a corresponding OR of 0.87 (0.72–1.05) for SBP. In contrast, the multivariable MR analysis provided an accentuated OR estimate for DBP of 1.34 (1.08–1.67), whereas SBP was inversely associated with risk [IVW OR: 0.70 (0.56–0.88)] (Figure 2). None of the sensitivity analyses indicated directional pleiotropy (Supplementary Figure S6, available as Supplementary data at IJE online), influential outlier SNPs (Supplementary Figure S6, available as Supplementary data at IJE online and funnel plot shown in Supplementary Figure S7, available as Supplementary data at IJE online) or impact of potential invalid instruments (Supplementary Figure S6, available as Supplementary data at IJE online).
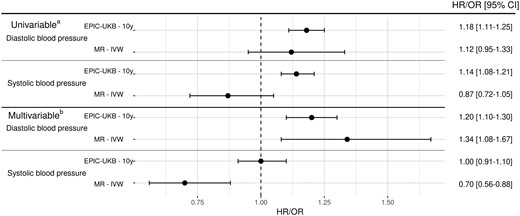
Long-term association between blood pressure and renal cell carcinoma risk and comparison with Mendelian randomization. (a) Diastolic blood pressure (DBP) or systolic blood pressure (SBP) minimally adjusted; (b) DBP or SBP adjusted with each other. MR, Mendelian randomization; IVW, inverse variance-weighted method; OR, odds ratio; HR, hazard ratio; EPIC, European Prospective Investigation into Cancer and Nutrition; UKB, UK Biobank.
Discussion
In this study, we carefully modelled the temporal relation between blood pressure and RCC risk separately in EPIC and UKB based on a total of 700 000 prospectively followed research participants. We found that DBP was consistently associated with RCC risk when measured ≥5 years prior to diagnosis, including when accounting for SBP and other risk factors. Conversely, after taking DBP into account, SBP did not present a clear and independent association with RCC. We also carried out a complementary multivariable MR analysis that provided additional support for a positive association between DBP and RCC risk.
The association between elevated blood pressure and risk of RCC has been well described in the literature.1,3,4,6,8,9,11,12,35,36 The first major prospective study describing this relation in both men and women by Weikert et al. was based on 250 incident RCC cases from the EPIC cohort in 2008.4 The authors estimated a >2-fold risk increase for both SBP (160 vs 120 mmHg) and DBP (100 vs 80 mmHg) after accounting for other risk factors. The Metabolic Syndrome and Cancer Consortium (Me-Can)37 confirmed a clear positive association of both DBP and SBP with RCC based on 855 incident cases diagnosed in four separate cohort studies.6 Most recently, two studies provided further confirmatory evidence of higher RCC risk experienced in individuals with elevated DBP or SBP, including Christakoudi et al.35 in an updated cancer-wide analysis in the EPIC cohort and Kim et al. who carried out a registry based study on 9 746 445 Korean individuals of whom 11 083 were diagnosed with incident RCC. Other approaches addressed the relation between blood pressure and RCC risk, most notably by MR by our group in 2019 where we estimated a clear positive association of DBP but no clear risk association for SBP.13 In contrast to the traditional cohort studies described above that use direct measurements of blood pressure, in the MR framework, we used genetic proxies of blood pressure to evaluate the association with risk in a large renal cancer GWAS.
Our current analysis represents an attempt to reconcile the partly discrepant observations between the traditional observational studies and the MR study. Specifically, we sought to address two hypotheses. The first is that early neoplastic transformations in the kidneys may influence DBP or SBP levels several years prior to diagnosis, thereby biasing traditional prospective studies of measured blood pressure through reverse causation. This hypothesis was addressed by carefully modelling the temporal relation between blood pressure and RCC risk as a function of time from blood pressure measurement to diagnosis with the use of flexible parametric survival models. Second, we hypothesized that SBP is associated with RCC risk because of its correlation with DBP (i.e. confounded by the DBP). This hypothesis was addressed by carrying out mutually adjusted risk analysis for DBP and SBP to evaluate whether their respective associations with risk were independent. We additionally included an updated MR analysis to address both hypotheses; as highlighted in the introduction, MR studies cannot be affected by reverse causation and are less sensitive to confounding.
In the initial univariable risk analyses, we observed clear long-term positive associations for SBP and DBP with RCC risk when measured >5 years prior to diagnosis (Figure 1A and D). However, for blood pressure measurements performed within the last year leading up to diagnosis, the HR estimates increased close to diagnosis (Figure 1A and D). When adjusting for SBP and additionally for risk factors, the long-term risk association for DBP measured >5 years prior to diagnosis remained largely unaffected in both EPIC and UKB (Figure 1B and F). Conversely, when adjusting for DBP, the long-term risk association for SBP was attenuated and no longer evident (Figure 1E and F). In the complementary MR analysis, we used a more stringent selection criteria of blood pressure-associated SNPs than in the study from 201913 and also performed a multivariable analysis. The univariate MR analysis resulted in weaker OR estimates for both DBP and SBP than in the previous study (Figure 2). The subsequent multivariable MR analysis generated an accentuated positive OR estimate for DBP that was consistent with the long-term risk association in the analysis of measured DBP (Figure 2). However, the multivariable OR estimate for SBP suggested an inverse association with risk that is not readily interpretable. This finding may have arisen because of collinearity issues between the DBP and SBP instruments.
The short-term risk association of blood pressure measured within 2 years of diagnosis was also complicated to interpret in adjusted analyses. In EPIC, DBP in adjusted analyses did not show a clear association with RCC risk, with some indication of a remaining positive association for SBP. In UKB on the other hand, we did not observe any indication of a strong association with RCC risk for SBP when measured close to diagnosis after adjustments.
Taken together, these observations support a positive association of DBP with RCC risk when measured >5 years prior to diagnosis. The long-term association with RCC risk for SBP was more complicated to interpret but does not appear to be independent of DBP. Furthermore, whilst we observed an association consistent with an inverse causation effect on blood pressure measurements performed close to diagnosis in univariable analysis, the confidence intervals were wide and the multivariable analysis was challenging to interpret and did not clarify whether this phenomenon primarily influences DBP or SBP.
The mechanistic underpinnings of the role of blood pressure in RCC carcinogenesis is not well understood and the current study does not inform this question. There are several hypothesized mechanistic pathways, including an influence of elevated blood pressure on chronic inflammation and downstream hypoxia,38,39 and endothelial dysfunction and the formation of reactive oxygen species,40–42 but they do not readily explain why DBP but not SBP would influence RCC risk. The relation between kidney function and blood pressure is complex; renal dysfunction often results in elevated blood pressure, but systemic hypertension may in turn cause renal disease. There is some epidemiological evidence of a link between poor kidney function as measured by eGFR and incident RCC43 but it remains unclear whether this association reflects a causal relationship.44
The primary strengths of our study include the large number of study participants and the application of flexible parametric survival modelling, specifically allowing us to describe the temporal association between DBP and SBP with RCC risk. We additionally performed a complementary MR analysis that partly corroborated the results of the analyses of measured blood pressure. An important limitation of our study concerns the lack of repeated blood pressure measurements amongst the study participants. Considering the important role of the kidneys in regulating blood pressure and thereby the potential for reverse causation, it would be informative to analyse consecutive repeat blood pressure measurements in the years leading up to diagnosis to better describe this relation on an individual level. Notwithstanding the limitations of this study, we argue that it will be challenging to further strengthen the causal inference of DBP in RCC aetiology whilst remaining in an observational research framework. Randomized trials of blood pressure-lowering drugs with an ample number of incident kidney cancer cases will be needed to conclusively establish blood pressure as a causal risk factor for RCC.
In conclusion, this study describes the temporal relation between blood pressure and RCC risk in two large European cohorts involving >700 000 prospectively followed research participants and 1692 incident RCC cases. With complementary evidence from a MR analysis, we report evidence consistent with an important role for DBP—but not clearly for SBP—in RCC aetiology. Future prospective studies with repeat blood pressure measurements are warranted to better describe its relationship with RCC in the years leading up to diagnosis. We also encourage studies that can explain the mechanistic underpinnings of DBP in RCC carcinogenesis.
Ethics approval
For EPIC, approval for this study was obtained from the ethical review boards of the International Agency for Research on Cancer and from all the EPIC participating centres. Written informed consent was obtained from all participants before entry into the study. For UKB, all participants provided written consent and the study protocol was approved by the North West Multicenter Research Ethics Committee in the UK. This study was conducted accessing the UK Biobank data under application number 15825.
Data Availability
The data are available upon request to UKB or EPIC, respectively.
Supplementary data
Supplementary data are available at IJE online.
Author contributions
Author contributions are available as a Supplementary file at IJE online. International Agency for Research on Cancer (IARC) disclaimer: Where authors are identified as personnel of the International Agency for Research on Cancer/World Health Organization, the authors alone are responsible for the views expressed in this article and they do not necessarily represent the decisions, policy or views of the International Agency for Research on Cancer/World Health Organization.
Funding
This analysis was supported by Cancer Research UK (Martin; C18281/A29019). The coordination of EPIC is financially supported by IARC and by the Department of Epidemiology and Biostatistics, School of Public Health, Imperial College London which has additional infrastructure support provided by the NIHR Imperial Biomedical Research Centre. The national cohorts are supported by: Danish Cancer Society (Denmark); Ligue Contre le Cancer, Institut Gustave Roussy, Mutuelle Générale de l’Education Nationale, Institut National de la Santé et de la Recherche Médicale (Inserm) (France); German Cancer Aid, German Cancer Research Center (DKFZ), German Institute of Human Nutrition Potsdam- Rehbruecke (DIfE), Federal Ministry of Education and Research (BMBF) (Germany); Associazione Italiana per la Ricerca sul Cancro-AIRC-Italy, Compagnia di SanPaolo and National Research Council (Italy); Dutch Ministry of Public Health, Welfare and Sports (VWS), Netherlands Cancer Registry (NKR), LK Research Funds, Dutch Prevention Funds, Dutch ZON (Zorg Onderzoek Nederland), World Cancer Research Fund, Statistics Netherlands (Netherlands); Health Research Fund (FIS)—Instituto de Salud Carlos III (ISCIII), Regional Governments of Andalucía, Asturias, Basque Country, Murcia and Navarra, and the Catalan Institute of Oncology—ICO (Spain); Swedish Cancer Society, Swedish Research Council and County Councils of Skåne and Västerbotten (Sweden); Cancer Research UK (14136 to EPIC-Norfolk; C8221/A29017 to EPIC-Oxford), Medical Research Council (1000143 to EPIC-Norfolk; MR/M012190/1 to EPIC-Oxford) (UK).
Conflict of interest
None declared.
References
Percy Constance Holten Valerie van, Muir CS, & WHO. International classification of diseases for oncology/editors, Constance Percy, Valerie Van Holten, Calum Muir, 2nd ed. World Health Organization. Published

