


Abstract
The immune system has many adaptive and dynamic components that are regulated to ensure appropriate, precise and rapid response to a foreign pathogen. A delayed or inadequate immune response can lead to prolonged disease, while an excessive or under-regulated response can lead to autoimmunity. The cytokine, interleukin-2 (IL-2) and its receptor IL-2R play an important role in maintaining this balance.
The IL-2 receptor transduces pSTAT5 signal through both the intermediate and high affinity receptors, which differ from each other by the presence of CD25 chain in IL-2 receptor. We present experimental data on the kinetics of pSTAT5 signalling through both of the receptors and develop a model that captures this kinetics. We then use this model to parameterize key aspects of two additional models in which we propose and study two different mechanisms by which IL-2 receptor can transduce distinct signals leading to either an activated or a non-activated cell state. We speculate that this initial state differentiation, perhaps enhanced by downstream feedbacks, may eventually lead to differential cell fates.
Our result shows that non-linear dynamical models can suggest resolution of a puzzling array of seemingly contradictory experimental results on IL-2 effect on proliferation and differentiation of T-cells.
Despite the fact that interleukin-2 (IL-2) and its receptors (Fig. 1) represent one of the most extensively studied cytokine signalling systems, unexpected findings emerging from therapeutic manipulations of this system in-vivo cannot be explained by simple conceptual models (Boyman & Sprent, 2012; Malek & Castro, 2010). Instead, mathematical modelling is likely required to elucidate the varied effects that IL-2 exerts on the immune system.
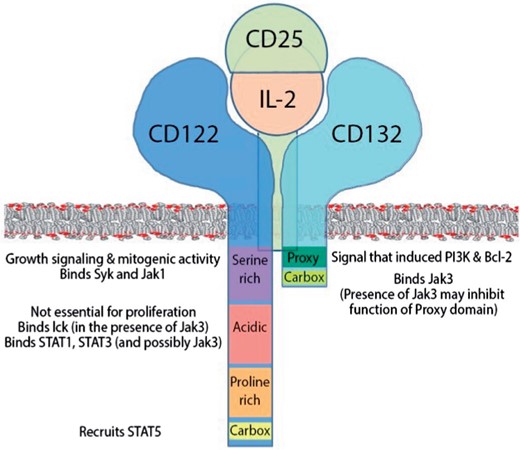
Schematic depiction of IL-2R chains, their intracellular domains and their putative function, assembled based on the literature review. The IL-2R complex is not pre-assembled before IL-2 binding: CD25, IL-2 or CD122 alone (without bound IL-2) have no measurable affinity for CD132; instead, IL-2 is required for the assembly of signalling complex. IL-2 can bind CD25 (low-affinity IL-2R; Kd |$\approx$| 10nM) and CD122 (Kd |$\approx$| 100nM), which, associated with CD132 upon IL-2 binding, form an intermediate affinity IL-2R (Kd |$\approx$| 1nM). When CD25 associated with CD122, it increases IL-2 binding to CD122 approximately 100 fold and this tertiary complex then recruits CD132 to form high affinity IL-2R (Kd 10-50pM) (Wang & Smith, 1987). In the quaternary IL-2R structure, IL-2 makes separate contacts with IL-2R|$\alpha$| (CD25), -|$\beta$| (CD122) and common |$\gamma$|-chain (CD132). CD25 makes no contact with either CD122 or CD132.
On a functional level, growth-promoting effects of IL-2 on different lymphocytes, which have been widely explored in in-vitro studies, lie in striking contrast to lymphoproliferation and autoimmunity that characterizes in-vivo genetic deletion of IL-2 or its signalling chains (Sadlack et al., 1993; Suzuki et al., 1995; Willerford et al., 1995). As soon as this unanticipated in-vivo phenotype was explained by the lack of FoxP3+ T regulatory cells (T-regs), the scientists were again surprised by observations that the monoclonal antibody against CD25 (Daclizumab) that blocks signalling through high-affinity IL-2 receptor (IL-2R), potently inhibits the human autoimmune disorder, multiple sclerosis (MS) (Malek et al. 2002; Bielekova et al. 2004; Malek & Castro 2010; Gold et al. (2013)). This is surprising considering its in-vivo inhibitory effect on T-regs (Martin et al., 2010). These data revealed that IL-2 has both stimulatory and regulatory effects on the immune system, that go beyond simple paradigm based on effector and regulatory T cell competition.
On the immuno-stimulatory side, recent animal studies identified the role of IL-2 in development of memory T cells and terminal differentiation of effector T cell (Malek & Castro, 2010). In human data, both genetic and Daclizumab-treatment related experiments demonstrated that inhibition of high-affinity IL-2 signalling is associated with increased susceptibility to infections (even early in life), presumably due to inefficient T cell priming by dendritic cells (DCs) (Roifman, 2000; Bielekova et al., 2004; Caudy et al., 2007; Gold et al., 2013). These cells trans-present IL-2 to primed T cells across the immune synapse at the time when T cells do not yet express high affinity IL-2R (Wuest et al., 2011). It is likely that this early IL-2 signal provides essential survival signal to primed T cells.
Human studies also revealed an important role of IL-2 signalling through intermediate affinity IL-2R in the differentiation of innate lymphoid cells, including expansion and activation of immuno-regulatory CD56bright Natural Killer (NK) cells and inhibition of lymphoid tissue inducer (LTi) cells. These effects likely contribute to the efficacy of Daclizumab in MS (Bielekova et al., 2006; Perry et al., 2012). Thus, at least in the human system, IL-2 regulates immune responses not only via activation of FoxP3-Tregs, but also via CD56bright NK cells, and by priming effector T cells activated via high-affinity IL-2R to later undergo apoptosis (Lenardo, 1991).
In order to understand these complex, and sometimes seemingly contradictory effects of IL-2 signalling, we need to consider at least two levels of control of IL-2 signal transduction. Both of these depend on a complex structure of the IL-2 receptor, which has three different subunits. The ‘intermediate affinity’ receptor is the dimer of the IL-2R|$\beta$| (CD122) and the common |$\gamma$|-chain (|$\gamma_c$|), while the ‘high affinity’ receptor is the heterotrimer of those two subunits in addition to the IL-2R|$\alpha$| chain (CD25) (Wang et al., 2005). The |$\gamma_c$| subunit is known as the common |$\gamma$|-chain because of its incorporation in the receptors for numerous cytokines (IL-2, IL-5, IL-7, IL-15 and IL-21), while CD122 is shared by the two structurally similar cytokines IL-2 and IL-15 (Waldmann et al., 1998; Yamane & Paul, 2012). Each of these two cytokines have their respective alpha chains which serve to increase the affinity of IL-2 for the ‘intermediate affinity’ receptor.
The first level of control resides in inter-cellular competition for limited amount of IL-2 or IL-15. The surface expression of different IL-2R signalling chains determines to a large extent which cell receives IL-2 signal (Feinerman et al., 2010; Busse et al., 2010). The expression of IL-2R signalling chains, especially CD25 (IL-2R|$\alpha$|), varies greatly on different immune cells and is generally linked to immune activation (Feinerman et al., 2010). CD25 expression is induced on adaptive immune cells by T cell- (TCR) and B cell (BCR) receptor signalling events and on innate immune cells, such as DCs and macrophages, by pathogen associated molecular patterns and/or pro-inflammatory cytokines (Malek & Castro, 2010; Boyman & Sprent, 2012). Additional complexity comes from the fact that activated immune cells can shed CD25 in form of soluble CD25 (sCD25), which increases in pro-inflammatory (i.e. protease-rich) environments. This may exert a decisive role on which immune cells ultimately win the tug-of-war for the limited IL-2, because soluble sCD25 competes with cell-surface expressed CD25 for IL-2 binding (Boyman & Sprent, 2012). To the extent that the sCD25-IL2 complex can bind to intermediate affinity IL-2R, but not to high affinity IL-2R, sCD25 may share functional similarities with Daclizumab, since it may channel IL-2 signalling through intermediate affinity at the expense of high-affinity IL-2R. Note that this cellular competition for IL-2 links innate and adaptive immune responses to the type and quantity of the pathogen that is inducing an immune response, thus increasing a chance for effective pathogen clearance, while avoiding excessive immune activation. Due to multiple positive (e.g. activating role of IL-2 on CD25 expression, IL-2-driven T cell survival signal) and negative (e.g. regulatory role of T-regs and CD56bright NK cells on effector T cells, IL-2 driven programming for T cell apoptosis) feedback loops, this inter-cellular aspect of IL-2 effects is well suited for mathematical modelling (Lenardo, 1991; Feinerman et al., 2010; Busse et al., 2010). New models will have to include more cellular elements than previously studied T-effectors and T-regs and, ideally, should also explore the pathogen-driven aspects of the immune response (Feinerman et al., 2010).
The second level of IL-2 signal control, which, to our knowledge has not been explored by any modelling approaches previously, resides in the intracellular compartment. The individual binding reactions determine the functional outcome of IL-2 signalling on a cellular level. Because signalling chains of the IL-2R (i.e. IL-2R|$\beta$|, or CD122 and IL-2R|$\gamma$|, otherwise called common |${\it{\gamma}}$|-chain, or CD132) do not contain any intrinsic enzymatic activity, the outcome of IL-2 signalling is dependent on the presence of intracellular signal transducers and adaptor molecules, see Fig. 1. The temporal and spatial availability of these varied molecules is affected by cellular activating signals in a manner analogous to activation-induced changes in the availability and compartmentalization of IL-2R signalling chains. For example, resting T cells generally lack CD25 (unless they are FoxP3+ T-reg cells), have limited surface expression of CD122 (i.e. only small proportion of T cells in peripheral blood stains with anti-CD122 Ab in-vivo and the proportion is higher for CD8+ T cells in comparison to CD4+ T cells) and also lack the tyrosine kinase Jak3 (Janus kinase 3), which is essential for mediating IL-2-driven proliferation (Gonzalez-Garcia et al., 1997; Bielekova et al., 2006; Malek & Castro, 2010). Thus, only small proportion of resting (human) T cells can receive exogenous IL-2 signal and this signalling (measured as phosphorylation of STAT5) is significantly inhibited by Daclizumab (Martin et al., 2010). In contrast, we observed that Daclizumab, provided in concentrations that are achievable in peripheral blood under current dosing, has no significant effect on IL-2-induced STAT5 phosphorylation of polyclonally activated human T cells, once they upregulated CD25 and CD122 signalling chains (data shown below). Nevertheless, T cells that received IL-2 signal under Daclizumab therapy have different functional outcome: while they enter proliferation cycle normally, they have enhanced survival, linked to upregulation of anti-apoptotic molecule bcl-2 (Roifman, 2000).
We therefore asked the question what could be the possible mechanism(s) by which the presence of CD25 functionally affects the outcome of IL-2 signalling on activated T cells, when high expression of CD122 assures that these T cells can phosphorylate STAT5 in response to exogenous IL-2 with surprisingly similar kinetics when they receive IL-2 signal via intermediate affinity (i.e. when CD25 is blocked by Daclizumab) versus high-affinity IL-2R.
While exploring conceptual models of this problem, we realized that the current knowledge of intracellular IL-2 signalling events is not sufficient to provide unequivocal mechanistic explanation. Even though many studies investigated functional components of IL-2R signalling chains (see excellent reviews Malek & Castro (2010); Boyman & Sprent (2012) and Figure 1, which depicts a schematic summary of current knowledge), these studies were performed in varied (human and animal) cell lines or primary cells (resting or activated), which differed in the level of expression of IL-2R signalling chains, their localization to lipid rafts and availability and composition of signal transducers and adaptor molecules (Gonzalez-Garcia et al., 1997; Ellery & Nicholls, 2002). Without detailed understanding of these differences, generalization of observations from one cellular system to another is not currently possible.
The literature about IL-2-induced survival signalling to T cells is especially ambiguous (Miyazaki et al., 1995; Gonzalez-Garcia et al., 1997; Malek & Castro, 2010). In particular, it seems that the survival signal mediated by high-affinity IL-2R (within the context of providing also proliferation signal to activated T cells) and the survival signal mediated by intermediate-affinity IL-2R (provided to resting T cells, but also to activated T cells in the presence of Daclizumab or sCD25) are likely mediated by different mechanisms:
On one hand, there is a short-term survival signal, dependent on repeated IL-2 signalling through high-affinity IL-2R, which also primes effector T cells to apoptosis upon subsequent IL-2 withdrawal (Lenardo, 1991).
On the other hand, there is a long-term survival signal, observed in T cells that downmodulated CD25 and consequently received mostly intermediate affinity IL-2R signal (Boyman & Sprent, 2012).
These two distinct signals through IL-2R have been shown to correlate with qualitatively different cell fates. Experiments have shown that cells receiving extended ‘high affinity’ signalling terminally differentiate into effector T cells, while cells that have lower levels of CD25 preferentially differentiate into memory cells (Burchill et al., 2007; Kalia et al., 2010; Boyman & Sprent, 2012). IL-2 signalling in cells with high CD25 levels (typical of T effector cells) is associated with activation and rapid proliferation followed by increased susceptibility to apotosis (Kalia et al., 2010). On the other hand, IL-2 signalling in cells with relatively low CD25 levels (typical of memory T cells) leads to homeostasis and survival (Burchill et al., 2007; Boyman & Sprent, 2012).
Consequently, the current study seeks to present a series of models that provide an explanation of the observed surprising phenomenon that the different functional outcomes of IL-2 signalling is dependent only on the presence versus absence of the receptor chain (CD25) and do not require any distinct extracellular signals. We model the initial differentiation of cells into highly activated state and non-activated state and speculate that this initial discrimination may be at least partially responsible for the eventual cell fate. We hope that proposed solutions will spur further biological studies that would confirm, or refine the provided mathematical models.
1. Summary of results
We provide experimental evidence that the kinetics of pSTAT5 production from IL-2 signal transduction through high affinity and intermediate affinity IL-2R are very similar. The kinetics of intermediate affinity IL-2R is delayed with respect to that of high affinity IL-2R, but the concentrations of pSTAT5 at 30 minutes differ by only about 11%, and we hypothesize that at equilibrium, the differences in concentration are even smaller (see Fig. A1). We propose a model of IL-2 receptor, which properly parameterized captures quantitatively the experimental pSTAT5 levels. This model (Model I) captures the kinetics of the receptor on a time scale of minutes. There are several papers that suggest that both the strength and duration of IL-2 signalling are important for cell fate (Obar et al., 2010; Kalia et al., 2010; Boyman & Sprent, 2012). Additionally, the experimental evidence in this article suggests that if the IL-2 activation lasts more than about 30 minutes, there will be almost no difference in signal transmission between high- and intermediate-affinity receptors (See Fig. A1). Therefore, a IL-2 signal lasting more than 30 minutes should be considered sustained. Cells deficient for CD25 shows persistent phosphorylation of STAT5 whereas cells that can form the high-affinity IL2R (CD25 positive cells) show only transient pSTAT5 signalling (Ring et al., 2012), and this difference likely has important downstream effects. However, our current understanding of the IL-2R structure and the pSTAT5 signalling cascade do not provide an obvious mechanism leading to this difference in signal duration. We argue that the difference in persistence of the pSTAT5 signal is the result of a downstream feedback, and the primary goal of this article is to describe some potential mechanisms which are capable of differentiating the initial difference in pSTAT5 signalling between the intermediate-/high-affinity receptor. Such a mechanism likely leads to downstream feedback which affects the persistence (or lack there of) of pSTAT5 signalling. The time scale of this initial signalling (on the order of 30 minutes) is a much shorter time than what is usually considered the time scale of cell fate differentiation, which is on order of hours and days.
We then concentrate on the central question of this article, which is how can two different cellular states emerge from signalling through the same IL-2 receptor and with the same signalling molecule (pSTAT5) when the signals only differ in their kinetics for 30 minutes after exposure. In order to explore this questions, we hypothesize two distinct mechanisms and construct their models. The first hypothesis suggests that feedback regulation of CD25 expression by pSTAT5 signalling could be sufficient to cause the differentiation of cells with different initial concentrations of CD25 into two distinct cell states. We propose a model (Model II) that includes positive feedback of CD25 production by a dimer of pSTAT5. This model builds on Model I, taking from it the dependence of equilibrium pSTAT5 signal on the amount of CD25 (and thus number of high-affinity receptors) in the membrane. While there are numerous downstream feedback loops that likely play a role in the ultimate cell-fate decision (e.g. Blimp-1 and Bcl-6 Malekm 2008; Diehl et al. 2008; Johnston et al. 2009; Crotty et al. 2010), the understanding of these feedback loops and their kinetic parameters is incomplete. In our simple model, we aim only to identify the initial differentiation into two cell states, that may be subsequently enhanced and stabilized by these (and perhaps others) feedback loops. These cellular states are identified in our model with stable equilibria. We hasten to add that the time scale at which the system converges to these equilibria is significantly longer than that of IL-2 receptor equilibration, but shorter than that of full commitment to a particular cell fate. As such, the bistability between two equilibria that we find in Model II may represent an initial decision and a transient state on a path to a particular fate in context of a larger framework. Model II exhibits bistability where at one stable equilibrium the cell produces low level of CD25 and thus receives mostly intermediate affinity signal, while at the other stable equilibrium the cell produces high level of CD25 and thus receives mostly high affinity signal. These two equilibria may correspond to two different cell states where cells with low-initial expression of CD25 receive long-term survival signal and eventually become memory T-cells, while the cells with high initial CD25 expression receive short term survival and proliferation signal and eventually terminally differentiate into effector T-cells. We emphasize that these states represent a first step in the cell fate decision, but that terminal differentiation is likely dependent on other downstream regulators. This model represents the conceptual feasibility of differentiating cells into different states based on random initial distribution of number of high-affinity receptors that then predispose cells to one of the two terminal fates. Non-linear feedback is the key ingredient in this process. However, Model II only exhibits bistability for a relatively small parameter range and this lack of robustness certainly dampens our enthusiasm for this explanation. One way to make the bistability more robust would be to include more downstream intermediaries between pSTAT5 and CD25; unfortunately, there is a lack of unambiguous information about them and their role. Instead, we consider another possible mechanism.
We consider the possibility that there is a secondary signal (in addition to pSTAT5) that plays a prominent role in IL-2 signalling. We propose a model (Model III) which, based on the structure of the IL-2 receptor, explores the possibility that the pSTAT5 signal is purely a short-term survival and proliferation signal, and that the secondary signal serves as a long term survival signal. We propose that when IL-2 is bound to IL-2R, pSTAT5 signalling takes place; but when subsequently IL-2 unbinds, the phosphorylated intracellular chains transmit a secondary signal. We do not speculate on the identity of the secondary signal, but remark that perhaps the Phosphoinositide 3-kinase (PI3K) cascade is a likely candidate, due to known downstream interactions with known survival signals, Bcl-2 and Bcl-6 (Johnston et al., 2009; Bratton et al., 2010; Crotty et al., 2010). The addition of a secondary signal can significantly increase the range of IL-2 in which we observe bistability. Additionally, the secondary signal can be used to help understand how differences in signalling (high versus intermediate) might be used to commit cells to different fates (memory cells versus effector cells).
We now discuss these results in detail, while delegating most of the mathematical analysis into the Appendix.
2. Daclizumab has no significant effect on IL-2-induced STAT5 phosphorylation of polyclonally activated human T cells
Daclziumab is a humanized monoclonal antibody that binds to CD25 at a site competing with IL-2 (Queen et al., 1989). Introduction of Daclizumab does not affect T cell viability or the surface expression of CD122 and |$\gamma_c$| (Goebel et al., 2000), but lowers surface expression of CD25 by about 20-30 % (Bielekova et al., 2006). However, treatment with Daclizumab has been shown to inhibit IL-2 mediated STAT5 activation, a fact that is not particularly surprising considering Daclizumab competes with IL-2 for CD25 binding (Goebel et al., 2000). While originally designed to prevent organ rejection in transplant patients, Daclizumab is now FDA approved for the treatment of relapsing-remitting multiple sclerosis (RRMS) (Bielekova et al., 2004, 2006, 2011; Borges et al., 2013; Ohayon et al., 2013).
Experimental data (see Appendix) demonstrates that cells treated with Daclizumab have indistinguishable rates of proliferation from those not treated with Daclizumab. However, Fig. A1 A demonstrates that cells treated with Daclizumab have increased cell counts. Therefore, we infer that the IL-2 signalling through the intermediate affinity receptor (cells treated with Daclizumab) versus high affinity receptor leads to prolonged survival. At the same time, the pSTAT5 production is very similar with only a slight delay in kinetics associated with the intermediate affinity signalling and possibly a slightly lower equilibrium concentration of pSTAT5 (Fig. A1C).
We now consider the model of IL-2 receptor with the goal to replicate the experimental data.
2.1 Dynamic model of IL-2 receptor (Model I)
To model the basic binding reactions of IL-2 with its receptor, we use mass action kinetics to arrive at the following set of differential equations.
See the Appendix for a detailed description of the modelled reactions as well as how conservation laws were used to minimize the number of differential equations. Here |$[pSTAT5]$| is the concentration of the signalling molecule produced by the IL-2 receptor when IL-2 is bound. Note that we assume that the intracellular signal pSTAT5 is generated at rate proportional to a product of concentration of receptor-ligand complex, both high (|$[IL2\alpha\beta]$|) and intermediate affinity (|$[IL2\beta]$|), with the concentration of the un-phosphorylated STAT5 molecule.
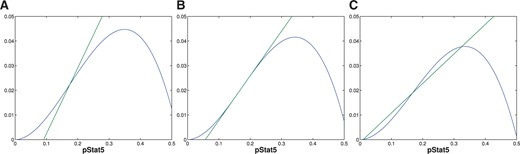
When comparing pSTAT5 signalling for intermediate affinity versus high affinity IL-2R, the model demonstrates very similar equilibrium concentrations of phosphorylated STAT5 (pSTAT5) with slightly delayed kinetics associated with intermediate affinity signalling, which matches the experimental results (Fig. 2A and A1C). These differences in kinetics quickly diminish in the presence of higher concentrations (5 nM) of IL-2 (Fig. 2B). Therefore, the model as well as the experimental data demonstrate that if pSTAT5 production is the primary factor in the differentiation of intermediate affinity versus high affinity signalling the mechanism would have to be very sensitive, it would have to work on a short time scale, and that it would be most effective for lower concentrations of IL-2.
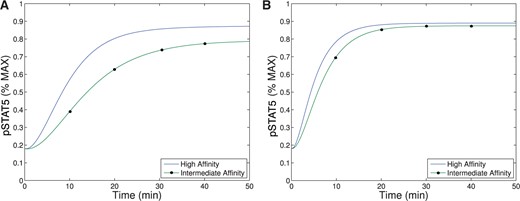
This figure shows qualitative matches to data presented in Fig. A1.C. In particular, Figure (A)plots the production of pSTAT5 for high and intermediate affinity IL-2 receptors for cells treated with 1 nM IL-2. Notice that there is delayed production of pSTAT5 associated with the intermediate affinity receptor with the equilibrium concentration being only slightly lower (|$< 10\%$|). Figure (B) shows the prediction of the model if we instead treat with a moderate levels of IL-2 (5 nM). In this case, the differences in equilibrium concentration decrease significantly (|$<2\%$|) and the kinetic differences become very small as well.
To explore the possible downstream effects of IL-2 signalling, we include a positive feedback regulation of CD25 by the pSTAT5.
3. Downstream regulation of CD25 by pSTAT5 can produce bistability (Model II)
Model Il incorporates the most important downstream positive feedback of IL-2 signalling, CD25 up-regulation. Specifically, we will consider the fact that the pSTAT5 up-regulates production of CD25, which promotes the switch from intermediate to high-affinity signalling as CD25 gets incorporated into the cellular membrane. On the time scale of the regulation of gene expression, the binding reactions associated with the receptors modeled by Model I will be considered to be at equilibrium and only production and decay of CD25 and pSTAT5 will be modelled explicitly.
3.1 Model
We analyse the model (3.1) in two steps. We first rescale the equations to decrease the number of total parameters in the system (|$V$|, |$C$|, |$K$|, |$n$|). We then find the equilibria of (3.3) and seek bistability in terms of these parameters. These parameters do not have direct biological interpretation. To provide such interpretation, we use A3.16 and A3.17 to relate these conclusions back to |$V_0$| and |$C_0$| and then use Model I to determine how these parameters, and hence bistability, depend on number of CD122 chains in the membrane and concentration of IL-2. Both of these parameters have direct biological and clinical interpretation.
We now outline the conclusion of the analysis of Model II; the full details can be found in the Appendix.
We first rescale the equation (3.1) in terms of the new parameters
If we view left hand side and right hand side as separate functions of |$x$|, the number of intersections of these functions determine the number of equilibria as a function of parameters |$C,V,K$| and |$n$|. We have the following Theorem.
See Appendix. ■
3.2 Range of parameter space supporting multiple equilibria
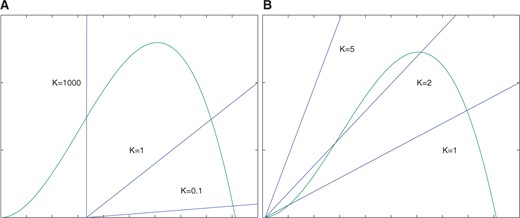
We now describe the region of parameter space (in |$V$|, |$C$|, |$K$| and |$n$|) that can support multiple equilibria. By Theorem 1 for a fixed |$n$| the inequality (3.5) describes the region in |$V, C$|-parameter space where bistability is possible for some |$K$|. We plot these regions in Fig. 3A. We observe that since for each |$n$| the bistability region has a vertical asymptote, for each value of |$n$| there is a maximum value of |$C$| at which bistability is possible. Additionally, for small |$n$| the inequality (3.5) suggest that in order to observe bistability the value |$V$| should be much larger than |$C$|. Since |$V$| and |$ C$| are constant multiples of |$V_0$| and |$C_0,$| this suggest that bistability is possible only with a very small number of bound receptors in the absence of CD25 (small |$C_0$|), and when the presence of CD25 significantly increases the number of bound receptors (large |$V_0$|).
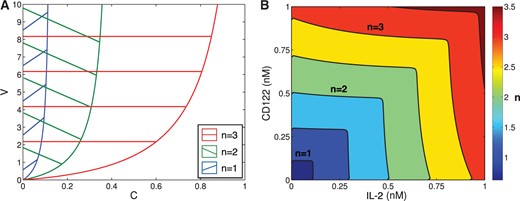
(A) shows the regions of parameter values of |$V$| and |$C$| where bistability is possible for different values of |$n$|. As |$n$| is increase, the size of the region expands. This figure does not show the effect of the parameter |$K$| on the size of the region of bistability. (B) shows the regions of parameter space in IL-2 and CD122 from Model I satisfying (A3.16) for different values of |$n$|. In particular, values to the left and below the curves represent values of CD122 and IL-2 where bistability is possible for different fixed values of |$n$|. Specifically, the curves plotted are for |$n =$| {0.5, 1, 1.5, 2, 2.5, 3}, as labelled on the legend.
Biologically, these observations indicate that the model predicts bistability when the concentration of IL-2 and CD122 are such that:
increasing the concentration of CD25 can significantly increase the concentration of receptors bound to IL-2; and
the production of pSTAT5 is low in the absence of CD25 (see Equation 3.2).
Both of these observations suggest that bistability will likely only occur for concentrations of IL-2 and CD122 near or below the binding affinity of the ‘intermediate’ affinity receptor (1 nM). We will use data from Model I to explore the concentrations of IL-2 and CD122 satisfying (3.5) and further refine these estimates for specific values of |$n$| (see Fig. 3B).
3.2.1 Effects of Daclizumab
Daclizumab has shown efficacy in controlling the rate of relapse in relapsing–remitting multiple sclerosis (RRMS) (Bielekova, 2013). We are interested to see how its presence affects the number and stability of the equilibria of the model. Recall that Daclizumab is an antibody which binds to CD25 thereby blocking high affinity IL-2R signalling. The inclusion of Daclizumab should not directly affect the kinetics of pSTAT5 or CD25 production (|$r_s$|, |$d_s$|, |$p_\alpha$|, |$d_\alpha$|) and should not affect the theoretical minimums or maximums of bound receptors (|$C_0$| or |$V_0$|) or the Hill coefficient (|$n$|). However, the introduction of Daclizumab will increase |$K_0$|, the concentration of CD25 required for the number of bound receptors to reach half of its maximum, since some of the introduced CD25 will be sequestered by Daclizumab.
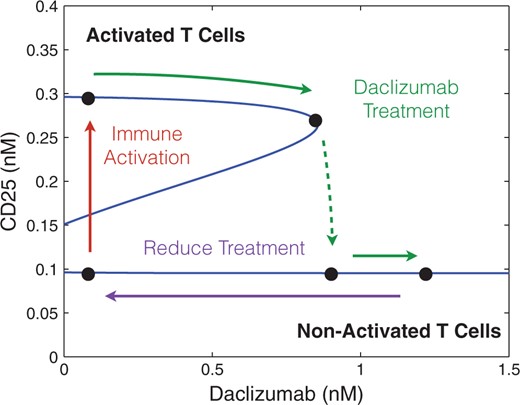
Our theoretical bifurcation analysis (see Appendix) shows that increasing |$K$| (and therefore |$K_0$|) in the parameter region which exhibits bistability always results in a saddle-node bifurcation leading to a loss of bistability. For values of |$K$| higher than the level at the saddle-node bifurcation, the system exhibits a single equilibrium with low-CD25 expression (see Fig. 4). If a low CD25 equilibrium corresponds to a system represented by non-activated T cells and a (relative) lack of effector cell phenotype, this agrees with experimental observations and may (at least partially) explain the effectiveness of the Daclizumab therapy. The model suggests Daclizumab shifts the population away from an effector T cells to a non-effector T cell phenotype, lowering the immune activity of the T cell population.
The figure demonstrates a saddle node bifurcation caused by adjusting the concentration of Daclizumab in the system for specific values of IL-2 and CD122 (0.1 nM of each). Values for |$V_0$|, |$C_0$|, |$K_0$| and |$n$| were determined by fitting data produced by Model I. Additionally, |$\frac{r_s}{d_s}$| and |$\frac{d_\alpha}{p_\alpha \, pS^*}$| were chosen to ensure the model demonstrated bistability when the concentration of Daclizumab was zero.
3.3 Bistability region in terms of IL-2 and CD122
We combine the results from Model I with results from Model II (in particular, Theorem 1 and Equation 3.5), to describe regions where bistability is possible in terms of three parameters: concentration of IL-2, concentration of CD122, and cooperativity |$n$|. The regions where the bistability is possible form a set of nested scalloped square regions in Fig. 3B, symmetric across diagonal, and parameterized by |$n$|. The contour lines in Fig. 3B separating these regions represent a specific value of |$n$|. For example, the contour line between the yellow and orange regions represents |$n=1.5$|.
Each region bounded by a line |$n= const$| in the IL-2 and CD122 plane in Fig. 3B and containing the origin, represents values of IL-2, CD122 and |$n \leq const$| that support multiple equilibria. At lower values of |$n$| (bottom left corner), the region is very small and it is centred at very low concentrations of IL-2 and CD122. For |$n=2.5$|, the concentrations of IL-2 and CD122 that permit bistability almost extends to |$0.75$| nM (union of first four squares). While the figure indicates that multiple equilibria are possible for certain concentrations of IL-2 and CD122 (given specific values of |$n$|), the precise size of the region of bistability still depends on |$K_0$| as well as the ratios |$\frac{r_s}{d_s}$| and |$\frac{d_\alpha}{p_\alpha \, pS^*}$|.
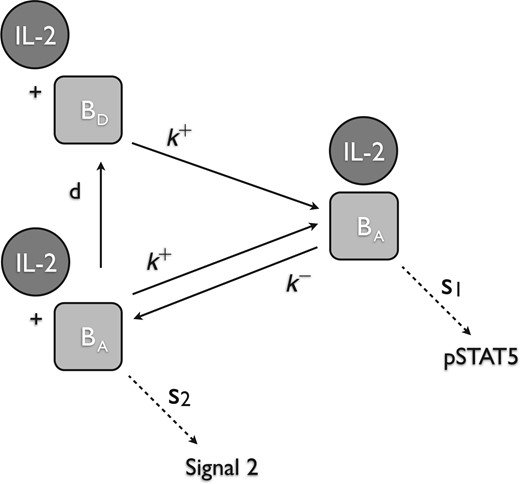
When IL-2 is bound to CD122 (either in the form of high- or intermediate-affinity receptor) as shown for the intermediate-affinity receptor, then the complex will preferentially produce pSTAT5. Alternately, when CD122 is ‘activated’, but IL-2 is not bound, then the complex will preferentially produce Signal 2.
3.3.1 Daclizumab induced saddle-node bifurcation
We illustrate the saddle-node bifurcation induced by Daclizumab for specific concentrations of CD122 and IL-2 (0.1 nM of each). We fit the values of |$n$| and |$K_0$| to data generated by Model I for different concentrations of Daclizumab to ensure bistability guided by the inequalities A3.16 and A3.17 (see appendix for details). Then a value of |$\frac{d_\alpha}{p_\alpha \, pS^*}$| was chosen to ensure that multiple equilibria existed with no Daclizumab. The solutions for (3.3) were solved numerically for the corresponding value of |$n$| and values of |$K$|. Since the dependence of K on the concentration of Daclizumab is very close to linear, we fit these values to a line to simplify the calculations (See Appendix for details). Then the corresponding solutions given by (3.3) were plotted in Fig. 4. As expected, the central feature of Fig. 4 is a saddle node bifurcation in which the high CD25 producing phenotype dissappears as the concentration of Daclizumab increases.
In the absence of Daclizumab, the system has two stable equilibria. The lower equilibrium represents a cell phenotype with low levels of CD25 expression and the higher equilibrium represents a phenotype with higher expression of CD25. The second type of equilibrium represents an activated T cell population, characteristic of effector cells, and the first type of equilibrium represents a non-activated T cell population (characteristic of non-effector T cells). The initial condition of each cell determines which phenotype it will acquire. However, after treatment with sufficient amount of Daclizumab, the high CD25 phenotype disappears and every new naive cell will acquire a non-activated phenotype. Biologically, this implies that treatment with Daclizumab shifts the composition of the community of cells towards a state with a larger fraction of non-effector cells. This matches experimental data which has demonstrated that treatment with Daclizumab decreases the number of effector cells (Zhang et al., 2014). Experimental evidence also suggests, that the decrease in effector cells is a result of both the inhibition of the activation of naive cells into effector cells and killing of effector cells by NK cells (Bielekova et al., 2006; Wuest et al., 2011). Importantly, subsequent withdrawal of the Daclizumab treatment will not induce re-emergence of the activated phenotype. The hysteresis effect ensures that the transient treatment with Daclizumab will make the low CD25 producing phenotype permanent, at least until the next large perturbation to the system.
We want to caution that this analysis is valid at a particular set of parameters, and other possibilities exist. For some parameters, there is no bistability. For other parameters, there may be an additional saddle-node bifurcation between the low CD25 equilibrium and the unstable equilibrium at very low- Daclizumab value. In the latter case, the termination of the Daclizumab treatment would lead to population shift back toward the high CD25 phenotype. The model would predict re-emergence of the MS symptoms upon termination of Daclizumab treatment.
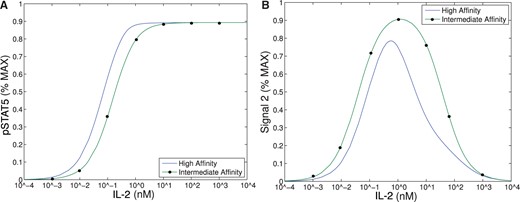
This figure demonstrates the range of IL-2 that could support bistability based solely on intracellular signal, pSTAT5 (Model II), versus both intracellular signals, pSTAT5 and Signal 2 (Model III). (A) Bistability in Model II can only occur where the difference between intermediate- and high-affinity signals are distinguishable, that is approximately in range |$10^{-3}$|–|$10$| nM. See text for detailed explanation. (B) Signal 2 shows difference between intermediate and high affinity receptor over a much larger range of IL-2 that extends to much larger concentrations of IL-2.
4. IL-2 receptor with secondary signal (Model III)
Examination of Models I and II showed that a cell can differentiate IL-2 signalling through the intermediate-affinity versus high-affinity receptor based on the production of pSTAT5 alone for relatively low concentrations of IL-2. This limited range is likely due mainly to our choice of a model where CD25 expression provides a simple feedback on pSTAT abundance. There could be multiple other unknown mechanisms in the cell that provide similar feedback that may expand the range of bistability. However, given the choice of our model the range of bistability is a result of Model 1 whose parameters have been fitted to the experimental data. To expand the range of IL-2 concentrations allowing for the differentiation of intermediate and high affinity signalling, we propose a third model. This model examines the hypothesis that there are two separate signal molecules transduced through the IL-2 receptor. In particular, we hypothesize that pSTAT5 acts as a short-lived survival and proliferation signal, while an alternative signal, which we will call |$S_2$|, acts as a longer-term survival signal. While this model is speculative in nature, we use detailed knowledge of the structure of IL-2 receptor in order to propose a mechanism for the production of |$S_2$|, and this mechanism will be shown to affectively differentiating signalling through the intermediate and high affinity of IL-2R based on the levels of pSTAT5 and |$S_2$| (Fig. 6). Again, while we will not explicitly speculate on the nature of |$S_2$|, we note that the PI3K cascade is a likely candidate due to its downstream targets Bcl-2 and Bcl-6 which have both been implicated in cell fate decisions (Miyazaki et al., 1995; Malekm, 2008; Johnston et al., 2009; Bratton et al., 2010; Crotty et al., 2010).
Since production of both signals will again depend on extracellular concentration of IL-2, the goal of the Model III is to exhibit the ability to differentiate signalling through the intermediate and high affinity signalling at wider ranges of IL-2 signalling than in Model I and II.
4.1 Modelling assumptions
We assume that intermediate affinity receptor has two states, an ‘activated’ state (|$[\beta_a]$|) and a ‘deactivated’ (|$[\beta_d]$|) state. These states correspond to the phosphorylation state the tyrosine kinases JAK1 and JAK3 on CD122 and the |$\gamma$|-chain, respectively. Recall, that when IL-2 is bound to CD122 (either in the form of the intermediate- or high-affinity receptor), the receptor is ‘activated’ as a result of the auto-phosphorylation of JAK1/JAK3 on CD122/|$\gamma$|, respectively. We make several assumptions about this second signalling molecule, |$S_2$|. First, we assume that even if IL-2 becomes unbound, CD122 will remain ‘activated’ while the tyrosine kinases remain phosphorylated. Eventually, if IL-2 remains unbound, then the ‘activated’ CD122 will decay into the ‘deactivated’ state when JAK1/JAK3 become dephosphorylated. While there is no direct experimental evidence for this mechanism, there are at least two other major pathways (PI3K, Ras-Raf-MAPK) associated with IL-2 signalling (see Fig. 1) (Gonzalez-Garcia et al., 1997; Meyer et al., 1997; Gaffen, 2001; Malekm, 2008; Bratton et al., 2010). Phosphorylation of different residues in the cytosolic portion of CD122/|$\gamma$| activates different pathways. It is possible that the binding of IL-2 to the receptor induces conformational change in the cytosolic portion of CD122/|$\gamma$|, and this change affects which pathway is preferentially activated.
Our main hypothesis for the model is that the activated IL-2 receptor will take on different configurations based on whether IL-2 is bound or not bound. When IL-2 is bound to IL-2R (either in the form of high or intermediate affinity receptor), then the complex will preferentially produce pSTAT5. Alternately, when IL-2R is ‘activated’, but IL-2 is not bound, then the complex will preferentially produce |$S_2$|. We hypothesize that differential signalling is a result of a conformational change caused by the presence and/or absence of the signalling molecule, IL-2. These assumptions are supported by our current understanding of the IL-2 receptor as described in the introduction and in the description of Model I.
4.2 Intermediate- versus high-affinity signalling in Model III
We summarize the results from Model III in Fig. 6 while we delegate the details of the analysis to the Appendix.
Our first observation is that the equilibrium concentration difference in the secondary signal (|$S_2$|) for intermediate- versus high-affinity receptors (~12%) observed in Model III shows only a slight improvement over the difference in pSTAT5 (~9%) for Model II at 1 nM concentrations of IL-2 (see Fig. 6), compare the left panel and right panel). However, the ability of Model III to distinguish between IL-2 signalling through intermediate-affinity versus high-affinity receptor does not diminish with increasing IL-2 as rapidly as the difference in pSTAT5 signal.
The difference in production of |$S_2$| between intermediate and high affinity receptors improves (~33% difference) for 5 nM concentrations of IL-2 while at this concentration of IL-2 the difference in pSTAT5 signalling is only ~1% (see Fig. 6). Furthermore, the |$S_2$| signal is still able to differentiate the two types of signalling at very high concentrations of IL-2, since we still observe a difference of ~10% at 100 nM IL-2. At this high concentration of IL-2, the pSTAT5 production through intermediate- and high-affinity receptors are virtually indistinguishable.
Recall that for bistability to occur in Model II, the difference between |$V_0+C_0$| (the equilibrium concentration of bound receptors in the presence of CD25) and |$C_0$| (the equilibrium concentration of bound receptors in the absence of CD25) must be significantly different. Notice, outside the range of IL-2 from |$10^{-3}$|–|$10$| nM in Fig. 6.A, the equilibrium concentrations of pSTAT5 for intermediate-and high-affinity receptors are indistinguishable, precluding the possibility of bistability. In fact, the analysis of Model II implies that the region may be even smaller than this figure implies. On the other hand, Fig. 6B shows significant difference between intermediate- and high-affinity receptor over a much larger range of IL-2 extending to much larger concentrations of IL-2. Therefore, the signal |$S_2$| is able to differentiate intermediate- and high-affinity signalling for much greater ranges of IL-2 concentration than the bistability mechanism that was explored in Model II. Since some of the downstream signals of pSTAT5 and the other IL-2 associated pathways (PI3K, Ras-Raf-MAPK) have been shown to demonstrate mutual inhibition (Bcl-6 and Blimp-1 e.g.), even relatively small initial signalling differences could be exaggerated further by downstream feedback (Malekm, 2008; Diehl et al., 2008; Johnston et al., 2009; Bratton et al., 2010; Crotty et al., 2010).
4.2.1 |$S_2$| as a long-term survival signal
The signal |$S_2$| may represent a longer-term survival signal. As mentioned in the introduction, experimental evidence suggests that cells with higher levels of membrane bound CD25 terminally differentiate into effector cells, and IL-2 signalling in effector T cells is associated with activation and rapid proliferation followed by increased susceptibility to apoptosis (Kalia et al., 2010). On the other hand, IL-2 signalling in cells with lower CD25 concentrations, typical of memory T cells, leads to homeostasis and survival (Burchill et al., 2007; Boyman & Sprent, 2012). The levels of pSTAT5 signalling alone are unlikely to be responsible for this difference in long-term outcomes as the difference in pSTAT5 concentration seems insufficient to elicit these long-term affects. However, the balance of pSTAT5 and |$S_2$| could be sufficient to initiate the differentiation towards these seemingly contradictory long-term outcomes. In particular, the pSTAT5 signal could act like a proliferation and short-term survival signal, while |$S_2$| provides a long-term survival signal. Differences in our model’s equilibrium levels of |$S_2$| signalling associated with the high and intermediate affinity receptors are significant for moderate concentrations of IL-2 (see Fig. 6). Therefore, a cell with many high-affinity receptors would receive significantly less long-term survival signal potentially leading to a higher rates of apoptosis.
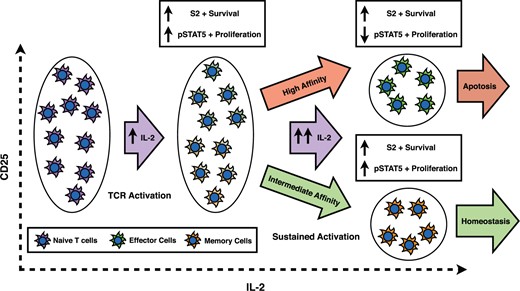
Human naive T cells, other than T-regs, are generally CD25 negative, but fully activated T cells have a broad range of initial CD25 concentrations (Feinerman et al., 2010), perhaps because during the TCR activation, DCs transpresent CD25 and may provide different CD25 support to different cells (Wuest et al., 2011). As the immune response continues, cytokines will be produced by both T cells and B cells. Depending on the initial concentration of CD25 as well as the level of TCR stimulation, each individual cell will receive different levels of high- versus intermediate-affinity signalling. While cytokine signalling is still at moderate levels, all cell types will receive both proliferation and survival signals (|$pSTAT5$| and |$S_2$|). However, as activation is sustained and the levels of IL-2 continue to increase, the response signals will change. At higher levels of IL-2, cells receiving primarily intermediate affinity signalling will still be receiving both proliferation and survival signals, while those cells receiving mostly high affinity signalling will no longer receive the survival signals (See Fig. 6). Ultimately, this will lead to homeostasis in cells receiving intermediate affinity signalling, while those cells receiving high-affinity signalling will be prone to apoptosis.
We propose a speculative model to explain how this initial differentiation into different cellular types based on the intermediate- versus high-affinity signalling may lead to different cell fates, see Fig. A12. Prior to activation, naive T cells have very low-initial CD25 concentrations. Upon antigen stimulation, T cells will undergo TCR activation as well transpresentation of CD25 by Dendriditic cells (Wuest et al., 2011). Perhaps as a result of differential levels of transpresentation to different cells, fully activated T cells have a broad range of CD25 concentrations (Feinerman et al., 2010). As the immune response continues, cytokines will be produced by both T cells and B cells. Depending on the activated T cell’s concentration of CD25 as well as the level of TCR stimulation, each individual cell will receive different levels of high- versus intermediate-affinity signalling. While cytokine signalling is still at moderate levels, all cell types will receive both proliferation and survival signals (|$pSTAT5$| and |$S_2$|). However, as activation is sustained and the levels of IL-2 continue to increase, the ratio of proliferation to survival signals will change depending on initial concentration of CD25. At higher levels of IL-2, cells receiving primarily intermediate affinity signalling will still be receiving both proliferation and survival signals, while those cells receiving mostly high-affinity signalling will no longer receive the survival signals (See Fig. 6). These signalling differences will lead to homeostasis in cells receiving intermediate affinity signalling, while those cells receiving high-affinity signalling will be primed to apoptosis.
5. Conclusions
The main goal of this contribution is to investigate complex signalling through IL-2 receptor. There seems to be a paradox where seemingly the same IL-2 signal produces very different outcomes in apparently identical populations of cells (terminal differentiation into effector T-cells versus memory T-cells). A similar conundrum in cancer biology, namely ability of p53 gene to integrate and transduce detailed information about the type and severity of DNA damage, was resolved by nonlinear dynamics. The p53 signal in response to different type and severity of damage changes in time producing sometimes isolated spikes and sometimes repeated periodic patterns (Gaglia et al., 2010; Batchelor et al., 2011). In principle, the number of dynamical states of a system of few genes is unlimited. The simplest type of states are stable equilibria and the presence of multiple such equilibria is known as bi- or multi-stabilty.
We seek a similar explanation in terms of nonlinear dynamics for the function of IL-2 receptor. Existence of two forms of IL-2 receptor (intermediate affinity and high affinity) provides attractive hypothesis that cells that receive predominantly one type of signal are predisposed to a particular fate. However, our experimental data shows that while the pSTAT5 signalling through intermediate affinity receptor is slower than that through the high affinity receptor, these differences diminish after about 30 minutes. In Model II, we study a hypothesis that the positive feedback of pSTAT5 on number of high-affinity receptors can produce bistability. Our model predicts that the initial distribution of number of high-affinity receptors can predispose the cell to end up in of two phenotypes that are represented by equilibria in our model. High affinity IL-2R phenotype receives majority of the signalling through high-affinity receptors, which may predispose cell towards the effector T-cell phenotype. Cells that initially have a lower number of high-affinity receptors will receive the majority of their signal through intermediate affinity receptor and assume a cell state that predisposes them towards a memory T-cell phenotype. Our simple model does not exhibit bistability in a range robust enough to be biologically plausible, but inclusion of additional downstream genes that are engaged in regulation of pSTAT5 and CD25 may change this. Unfortunately, the identity and dynamics of these intermediaries are largely unknown.
We therefore seek an alternative explanation in Model III. We propose that the dynamical character of assembly and disassembly of IL-2 receptor from its constitutive parts may be responsible for sending an additional signal, apart from pSTAT5. Our mechanism is independent on identity of this signal, but again, the PI3K cascade is a likely candidate. Our model shows that the difference in these two signals persists for much larger range of IL-2 signal, and for higher values of IL-2 signal. This increased robustness makes it a more likely biological explanation for observed differences in cell fate correlated to receiving intermediate vs. high affinity signal.
Our work is far from complete and perhaps raises more questions than it answers. Immune signalling is very complex and our knowledge is far from complete. While we believe that there are currently no experimental technologies that can directly validate or refute our mathematical models, the rapid development of highly sensitive proteomic assays based on mass spectroscopy, as well as improved design of specific antibodies, may allow experiment determination of the signalling pathways driven by high- versus intermediate-affinity signals in the near future. In particular, blocking high-affinity IL-2 signalling by daclizumab in conjunction with unbiased advanced mass-spectroscopy based proteomic assays, may disclose the nature of the separate signal transduced by the intermediate affinity IL-2 receptor proposed in Model III. Alternatively, a time-assay focusing on PI3K cascade may support or refute our hypothesis that this pathway is involved in proving long-term survival signal by intermediate affinity IL-2 receptor activation. Our goal here is not only to invite more experimental work to try to verify or refute predictions of our models, but also show that non-linear dynamics may play a key role in explaining puzzling behaviour of IL-2 receptor in immune response.
Funding
R.W. and T.G. were partially supported by NIH R01 grant 1R01AG040020-01. T. G. was partially supported by NSF grants DMS-1226213, DMS-1361240, and DARPA D12AP200025. J.P., S.H., and B.B. were partially funded by NIH/NINDS intramural research program.
References
Appendix
A1. Experimental results
In the experiments, CD4+ and CD8+ cells were treated with either MA251 or Daclizumab, both of which are antibodies that bind to the CD25 chain of the high-affinity receptor. Daclizumab binds to the active site of the CD25 chain, so it compets with IL-2 for binding, thus leading to increased intermediate affinity signalling. Alternately, MA251 binds to an alternative site on CD25 and serves as a control. Over the course of 8 days, absolute cell counts for the separate cultures were determined using flow cytometry (Fig. A1A). Additionally, Carboxyfluorescein succinimidyl ester (CSFE) was used to demonstrate the lymphocyte proliferation of cells treated with MA251 and Daclizumab (Fig. A1B). CFSE is a fluorescent dye used to label proteins in lymphocytes and is used to determine proliferation rates. After the initial staining the label is highly concentrated. As the cells divide the label proteins are divided among the daughter cells leading to a lower local concentrations and therefore lower fluorescences levels. The fluorescent distribution can then be used to estimate proliferation rates. Again cell counts were done using flow cytometry. On a shorter time scale, the kinetics for the production of pSTAT5 were compared for the two cell treatments by comparing mean fluorescent intensity (MFI) in both cases (Figure A1C). The third figure demonstrates the MFI distribution while the first two figures plot the MFI mean (with error bars).
Notice that Figure A1B demonstrates that cells treated with Daclizumab have indistinguishable rates of proliferation from those not treated with Daclizumab. However, Fig. A1A demonstrates that cells treated with Daclizumab have increased cell counts. Therefore, we infer that the IL-2 signalling through the intermediate affinity receptor (cells treated with Daclizumab) versus high affinity receptor leads to prolonged survival. At the same time, the pSTAT5 production is very similar with only a slight delay in kinetics associated with the intermediate affinity signalling and possibly a slightly lower equilibrium concentration of pSTAT5 (Fig. A1.C).
A2. Model of IL-2 receptor (Model I)
A2.1 Equations
IL-2 binding to its high affinity IL-2 receptor (IL-2R) results in the formation of a tetrameric complex with IL-2R|$\alpha$|, IL-2R|$\beta$| and common chain |$\gamma$|. In principle, there are 12 (|$=4 !/2$|) different orders of pairwise binding in which a tetrameric complex can be formed. This involves 30 different individual binding rates, most of which are unknown. Therefore, we use the specific information from literature about the IL-2R structure, binding affinities, and the order of the assembly, to limit the number of equations and parameters, yet still capture the essential description of the assembly process.
The central assumption is that both the high- and intermediate-affinity receptors form in an ordered fashion. In particular, we assume that IL-2 first binds to IL-2R|$\alpha$| which extends into the extracellular space. IL-2R|$\alpha$| then presents IL-2 to IL-2R|$\beta$| in cis-. Lastly, the IL-2/IL-2R|$\alpha$|/IL-2R|$\beta$| complex recruits the common |$\gamma$|-chain to form the high affinity IL-2R. The stepwise formation of the high-affinity receptor, or affinity conversion model, is widely accepted model of the formation of the IL-2 receptor (Shimizu et al., 1986; Kondo et al., 1986; Saito et al., 1988, 1990; Saito & Honjo, 1990). The second simplification we make is that we do not model explicitly the common |$\gamma$|-chain, since it is a part of both the intermediate and high-affinity receptor, and there is no evidence that its recruitment differs between the two receptor types. Additionally, |$\gamma$| chain is not specific to IL-2 receptor, but plays a role in at least six cytokine receptors. Therefore, we assume that the formation of the intermediate IL-2 receptor involves a single reaction A2.2 and the formation of high affinity receptor involves two reactions A2.1 and A2.3.
Since we assume that the binding and un-binding reactions are in equilibrium, we also consider the reverse reactions. The reverse reactions in A2.1 and in A2.2 are unique and the binding affinities are well known. However, the reaction A2.3 completes the formation of the high affinity receptor, and there are three possibilities for an initial reverse reaction: either IL-2, IL-2R|$\alpha$|, IL-2R|$\beta$| can first disengage from the high affinity complex. There does not exist experimental evidence to support either of these options: therefore, we chose reaction A2.4 where the complex disintegrates to its constituents. One justification for this choice involves the degrees of freedom of the constituents. In particular, both IL-2R|$\alpha$| and IL-2R|$\beta$| are tethered to the cell surface. Therefore, each of them undergoes thermal fluctuations in two dimensions. However, IL-2, as a free floating cytokine, has the ability to diffuse in three dimensions. Therefore, for IL-2 there are three dimensions of ‘escape’ from the high-affinity complex while either IL-2R|$\alpha$| or IL-2R|$\beta$| have only two dimensions of freedom in which to ‘escape’ from the high-affinity complex. This suggests that IL-2 will be the first component to unbind the complex. Since IL-2R|$\alpha$| and IL-2R|$\beta$| have no appreciable affinity to the common |$\gamma$|-chain and fairly low affinity for one another (Ricker et al., 2004), when IL-2 disengages the entire complex disassembles.
Therefore, this leaves us with the following set of binding reactions which describe the IL-2 signal transduction, as well as competition between intermediate and high affinity receptors.
The first two reactions are reversible reactions of binding and unbinding of IL-2 (|$[IL2]$|) to CD25 (|$[\alpha]$|) and CD122 (|$[\beta]$|), as described above. The third reaction forms a high-affinity receptor-ligand complex (|$[IL2\alpha\beta]$|). Upon unbinding of IL-2, the whole complex disassociates (reaction A2.4).
When comparing pSTAT5 signalling for intermediate-affinity versus high-affinity IL-2R, the model demonstrates very similar equilibrium concentrations of phosphorylated STAT5 (pSTAT5) with slightly delayed kinetics associated with intermediate affinity signalling, which matches the experimental results (Fig. 2A and A1C). These differences in kinetics quickly diminish in the presence of higher concentrations (5 nM) of IL-2 (Fig. 2B). Therefore, the model as well as the experimental data demonstrate that if pSTAT5 production is the primary factor in the differentiation of intermediate affinity versus high affinity signalling the mechanism would have to be very sensitive, it would have to work on a short time scale, and that it would be most effective for lower concentrations of IL-2.
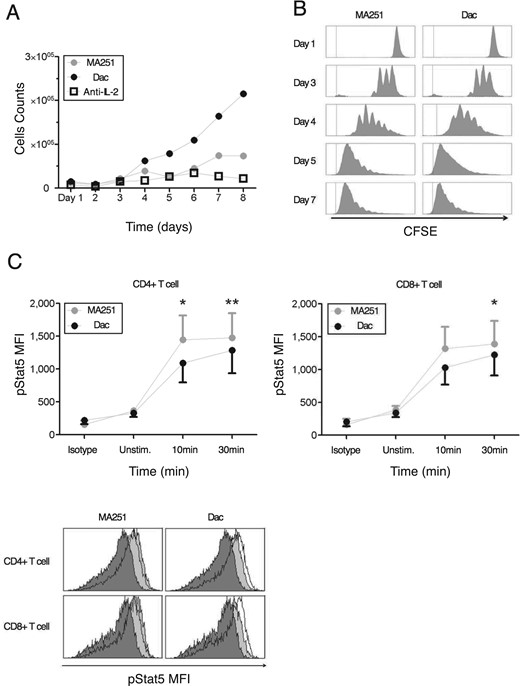
Daclizumab does not inhibit proliferation of activated T cells, but prolongs their survival, while exerting little effect on IL-2 induced STAT5 phosphorylation. (A) Activated T cells were cultured with MA251 or Daclizumab (Dac) for 8 days. Absolute counts of cells were determined by flow cytometry. (B) CFSE-stained activated T cells were cultured for 7 days. Proliferation of activated T cells with high-affinity(MA251) or intermediate-affinity(Dac) IL-2R was determined by flow cytometry. (C) Phosphorylation of STAT5 by measuring mean fluorescent intensity (MFI) at 10 and 30 minutes after exogenous IL-2 is given.
Here |$[pSTAT5]$| is the concentration of the signalling molecule produced by the IL-2 receptor when IL-2 is bound. Note that we assume that the intracellular signal pSTAT5 is generated at rate proportional to concentration of receptor-ligand complex, both high and intermediate affinity (|$[IL2\alpha\beta]$| and |$[IL2\beta]$|, respectively) and concentration of un-phosphorylated pSTAT molecule. The latter assumption corresponds to the assumption that there is a finite amount of STAT5 to be phosphorylated. Additionally, |$[pSTAT5]$| is assumed to decay at a rate proportional to its concentration. We rescaled the concentration of |$[pSTAT5]$| by the total concentration of STAT5, so that its value is a percentage of its maximum value.
A2.2 Parameter selection
Below we list all the parameters for the system. For parameters not directly cited from literature, the parameters denoted by * were determined by fitting data of Ring (Ring et al., 2012), while those denoted with a double dagger (|$\ddagger$|) were estimated using techniques described below. The binding affinity for Daclizumab to IL-2 was assumed to be that same as that of the high-affinity receptor to IL-2. The total concentration of Daclizumab, denoted with a single dagger (|$\dagger$|), was chosen to be as small as possible while still exhibiting experimentally observed phenomena that the presence of Daclizumab effectively changes IL-2 transduction from high affinity to intermediate affinity even in the cells that have high-affinity receptor chain, CD25. We demonstrate that this value of Dacliumab is sufficient in Section A4.4.2. The value denoted by ** is not needed because of the equilibrium assumptions previously, see (A2.7).
So we chose to approximate |$k^-_2$| as |$k^+_1 K_d$|. Since this is an upper bound, it is important to note that other choices for values of |$k^-_2$| must be less than or equal to the given approximation. Values for |$k_2^-$| up to two orders of magnitude less than the value given in the table were also tested in the model and differences in the level of |$[pSTAT5]$| were on the order of |$1\%$|.
This was solved using the constrained optimization function, using a constrained optimization method (Matlab function: fmincon), with constraint that all of the parameters be positive (We note that the constraints did not need to be enforced during the optimization.). The results of the best fit along with the data are plotted in Fig. A2 (|$R^2=0.9588$|). We fit a total of six parameters (three rate constants and three initial conditions). Since the system consists of four differential equations and thus four dependent variables, and we fit to 72 data points (six time points over four experiments run in triplicate), we feel that this analysis does not overfit the data.
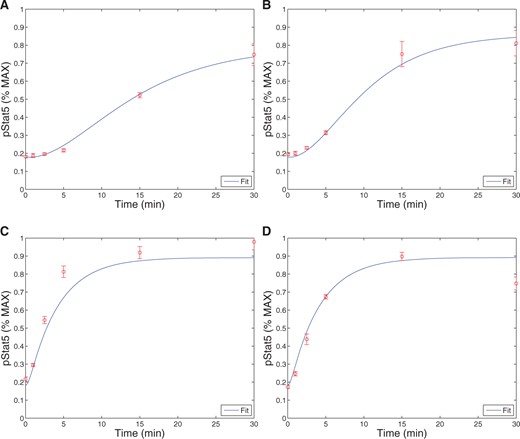
Model fits to the data from Ring et al. (2012). The experiments were run in triplicate. The plots show the model curve (curve) plotted with the experimental data. Figures (A) and (B) show the production of pSTAT5 over time for cells with no CD25 in the case of low (1 nM) and high (500 nM) IL-2, respectively. Figures C and D also shows the production of pSTAT5 over time except for cells with CD25, again in the case of low (1 nM) and high (500 nM) IL-2. Note that 5 parameters and two initial conditions were estimated by fitting this data (|$R^2=0.9588$|).
A2.3 Validation of fitted parameters
Both of these values fall comfortably within the range of values published in the literature of a range from 0-|$10^4$| proteins per cell for CD25, and of 0-|$10^2$| for CD122 (see Fig. 2B of Feinerman et al., 2010).
To further validate the parameters, we plotted pSTAT5 for various total concentrations of |$[IL2]$| and |$[\alpha]$| to ensure the model behaves as anticipated. First, we plotted pSTAT5 concentrations as a function of time for both the intermediate (IL-2R|$\beta$| = 0.51 nM, IL-2R|$\alpha$| = 0 nM) and high-affinity receptor (IL-2R|$\beta$| = 0.51 nM, IL-2R|$\alpha$| = 1.77 nM), where we also varied concentrations of IL-2 (See Fig. A3). Additionally, we plotted pSTAT5 concentrations as a function of time as we changed concentration of IL-2R|$\alpha$| (ranging from 0-100 nM) for a fixed IL-2 at 1 nM. All of these plots behave as anticipated. For both the high- and intermediate-affinity receptor, when the concentration of IL-2 increases, the equilibrium concentration of pSTAT5 increases and the characteristic response time decreases. Additionally, we see that the difference between pSTAT5 signalling through the intermediate- versus high-affinity receptor decreases as concentrations of IL-2 increases which matches experimental evidence (See Fig. A1). This is a consequence of higher occupancy of the receptor at higher concentration of IL-2 and is independent of binding affinity. Similarly, the results plotted in Fig. A4 match our expectations. As the concentration of IL-2R|$\alpha$| is increased, the pSTAT5 signalling becomes more sensitive to IL-2. In particular, the equilibrium concentration of pSTAT5 increases and the characteristic response time decreases. However, as expected, we see diminishing returns as IL-2R|$\alpha$| saturates all available IL-2R|$\beta$| and all intermediate affinity receptors are replaced by high affinity receptors.
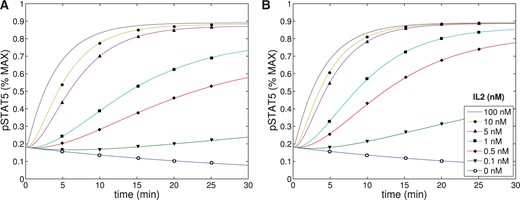
The concentration of pSTAT5 was plotted as a function of time for varying concentrations of IL-2 (0-100 nM) for both intermediate (A) and high (B) affinity receptors. The parameters shown in Tables A1–A4 were used.
Binding rates
| Reaction | Binding affinity (nM) | On-rate (nM|$^{-1}$|min|$^{-1}$|) |
| |$[IL2] + [\alpha] \rightleftharpoons [IL2\alpha]$| | 10|$^{\text{(Wang & Smith, 1987; Ricker et al., 2004).}}$| | 0.6|$^{\text{(Wang & Smith, 1987)}}$| |
| |$[IL2] + [\beta] \rightleftharpoons [IL2\beta]$| | 0.9(Wang & Smith, 1987; Hélène et al., 2011) | 0.048|$^{\text{(Wang & Smith, 1987)}}$| |
| |$[IL2\alpha] + [\beta] \rightarrow [IL2\alpha\beta]$| | - | 0.57|$^*$| |
| |$[IL2\alpha\beta] \rightarrow [IL2] + [\alpha] +[\beta] $| | - | 0.006|$^{\ddagger}$| |
| |$[\text{Dac}] + [\alpha] \rightleftharpoons [\text{D}\alpha]$| | 0.01 | -|$^{**}$| |
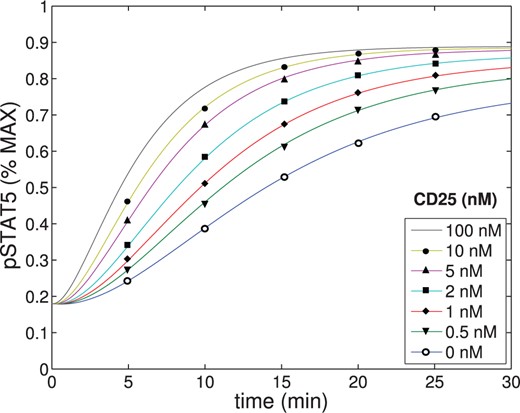
The concentration of pSTAT5 was plotted as a function of time for varying concentrations of IL-2R|$\alpha$|. The parameters shown in Tables A1–A4 were used.
Production/decay rates
| Signal | Production rate (nM|$^{-1}$|min|$^{-1}$|) | Decay (min|$^{-1}$|) |
| |$[pSTAT5]$| | 0.45|$^*$| | 0.028|$^*$| |
| Signal | Production rate (nM|$^{-1}$|min|$^{-1}$|) | Decay (min|$^{-1}$|) |
| |$[pSTAT5]$| | 0.45|$^*$| | 0.028|$^*$| |
Production/decay rates
| Signal | Production rate (nM|$^{-1}$|min|$^{-1}$|) | Decay (min|$^{-1}$|) |
| |$[pSTAT5]$| | 0.45|$^*$| | 0.028|$^*$| |
| Signal | Production rate (nM|$^{-1}$|min|$^{-1}$|) | Decay (min|$^{-1}$|) |
| |$[pSTAT5]$| | 0.45|$^*$| | 0.028|$^*$| |
Conservation equation maxima
| Conserved variable | Maximum (nM) |
| |$[IL2]$| | 1|$^{\text{(Ring et al., 2012)}}$|, 5, 100, 500|$^{\text{(Ring et al., 2012)}}$| |
| |$[\alpha]$| | 0, 1.77|$^*$| |
| |$[\beta]$| | 0.51|$^*$| |
| Conserved variable | Maximum (nM) |
| |$[IL2]$| | 1|$^{\text{(Ring et al., 2012)}}$|, 5, 100, 500|$^{\text{(Ring et al., 2012)}}$| |
| |$[\alpha]$| | 0, 1.77|$^*$| |
| |$[\beta]$| | 0.51|$^*$| |
Initial conditions
| Variable | Initial conditions (nM) |
| |$[\alpha]$| | 0, 1.77|$^{*}$| |
| |$[pSTAT5]$| | 0.18|$^*$| |
| |$[\beta]$|, |$[IL2\beta]$|, |$[IL2\alpha\beta]$| | 0 |
| |$[Dac]$| | 0, 2|$^\dagger$| |
| Variable | Initial conditions (nM) |
| |$[\alpha]$| | 0, 1.77|$^{*}$| |
| |$[pSTAT5]$| | 0.18|$^*$| |
| |$[\beta]$|, |$[IL2\beta]$|, |$[IL2\alpha\beta]$| | 0 |
| |$[Dac]$| | 0, 2|$^\dagger$| |
A3. Downstream regulation of CD25 by pSTAT5 can produce bistability (Model II)
A3.1 Rescaling and Bifurcation analysis of Model II
The number and stability of equilibria can change as we vary the parameters |$V$|, |$C$|, |$K$|, and |$n$|. In particular, we are interested in regions of parameter space that exhibit bistability, that is where there are two stable equilibria.
Notice that |$X_1 \le X_0$|. The intersection(s) of |$f$| and |$g$| represent the equilibria of the system, so our goal is to determine the number and stability of the equilibria, and additionally, how they depend on the parameters |$C$|, |$V$|, |$K$| and |$n$|.
We make several observations about the functions |$f(x) $| and |$g(x)$|.
|$f(x)$| does not depend on |$K$|;
|$g(x)$| is a line whose intersection with |$x$| axis does not depend on |$K$|. So |$K$| only affects the intersection of |$g(x)$| and the |$y$| axis, and therefore, the slope of |$g(x)$|;
the slope |$g'(x) = K^n(C+1) >0$| is always greater than zero.
The next key observation is that the central organizing centre for the bifurcation analysis is inflection point |$x_{inf}$|. We make the following observations:
- Since |$g'>0$|, if the intersection |$X_1$| of |$g(x)$| with the |$x$|-axis is greater than |$x_{inf}$|, that isthen the functions |$g(x)$| and |$f(x) $| have a unique intersection (see Fig. A6A).(A3.8)
- On the other hand, we will show below that if |$X_1 < x_{inf}$| then there is always a value of K, |$K_{int}=K_{int}(C,V)$|, such that(A3.9)
- Finally, we show that when |$C$| and |$V$| satisfy the equationthen(A3.10)(A3.11)
We note that the parameter values where both (A3.9) and (A3.11) are satisfied represent a locus of a family of pitchfork bifurcations. These parameter values satisfy (A3.10) and |$K_{int}=K_{int}(C,V)$|, where precise form of the latter function is below (A3.14). All panels in Fig. A5 satisfy (A3.9), while the middle panel represents a locus of a pitchfork bifurcation.
Finally, we show that when (3.5) is satisfied, then |$g'(x_{inf}) < f'(x_{inf})$| and therefore at |$K_{int}$| there are three intersections of |$f(x)$| and |$g(x)$|. Since existence of three intersections is an open conditions, for any values of |$C,V$| satisfying (3.5) there will be an open interval |$(K_{min}, K_{max})$| with |$K_{int} \in (K_{min}, K_{max})$|, such that there are three equilibria for all |$K \in (K_{min}, K_{max})$|. It is also easy to see from Fig. A5 that |$(K_{min}$| and |$K_{max})$| are loci of saddle-node bifurcations of equilibria.
Therefore if |$C$| and |$V$| satisfy this inequality, for all |$K$| there will only be one point of intersection of |$f$| and |$g$| (see Fig. A6A.).
Finally, we show that if |$C$| and |$V$| satisfy (3.5) then |$g'(x_{inf}) < f'(x_{inf})$|. This then implies that at |$K_{int}(C,V)$| there are three intersections of |$f$| and |$g$|, see Figs A5C and A6B.
To finish the proof we observe, that an analogous argument using the opposite inequality (3.4) implies |$g'(x_{inf}) >f'(x_{inf})$| and there is unique intersection of |$f$| and |$g$|, see Figs A5A and A6A.■
The figures represent different plots of |$f(x)$| (curve) and |$g(x)$| (line) for fixed |$V$|, three different values of |$C$|, and |$K$| chosen such that |$f(x)$| and |$g(x)$| intersect at the point of inflection of |$f(x)$|. (A) shows the plots for a value of |$C$| satisfying (3.4) specifically as a strict inequality. (B) shows the plots for a value when (3.4) is satisfied as an equality. (C) represents a value of |$C$| that satisfies (3.5).
A3.2 Results: conclusions of Model II
In A3.3, we will combine the results from Model I with our results from Model II, namely (A3.16) and (A3.17), to relate these conclusions to concentration of IL-2 (|$IL2^*$|) and CD122 (|$\beta^*$|) explicitly.
Just from analysis of the (A3.16) and (A3.17) alone, some biologically relevant conclusions can be made. Specifically, notice that for small Hill coefficients (values of |$n$|), the introduction of CD25 will need to significantly impact the concentration of bound receptors in order for the model to exhibit bistability. For example, notice that for |$n<\frac{\sqrt{2}+1}{2(\sqrt{2}-1)} \approx 2.91$|, the equation (A3.17) gives an estimate |$\frac{V_0}{C_0} > 1$|. This means that for the model to be capable of exhibiting bistability, we must require that |$\frac{V_0+C_0}{C_0} >2$|. Biologically, this indicates that the model would only project the possibility of multiple equilibria (at least for values of |$n< 2.91$|) when the concentration of IL-2 and CD122 are such that increasing the concentration of CD25 can double the concentration of receptors bound to IL-2 (see (3.2)). This step-like response will likely only occur for concentrations of IL-2 and CD122 near or below the binding affinity of the ‘intermediate’ affinity receptor (1 nM). In fact, we will use data from Model I to explore the concentrations of IL-2 and CD122 satisfying (A3.16) and (A3.17) and further refine these estimates for specific values of |$n$| (see Section A3.3, Fig. 3B).
A3.2.1 Different initial conditions allow cells to enter into different cell states
If we consider the amount of membrane bound CD25 as a proxy for the differentiation of effector T cells and memory T cells, then the bistability of this model indicates that cells can use only pSTAT5 signalling along with the up-regulation of CD25 to differentiate into these two cell types characterized by higher and lower equilibrium CD25 concentrations. In particular, the initial concentration of membrane bound CD25 may determine whether the cell will eventually differentiate into an effector cell (higher CD25 equilibrium) or a memory cell (lower CD25 equilibrium).
An alternative biological interpretation is that the initial level of T-cell ‘priming’, or activation, may determine whether the cell becomes an effector T cell or a memory T cell. During an infection, portions of the infectious agent are presented by an antigen presenting cell (APC) to the naive T cells through the temporary creation of an enclosed communication channel between the two cells, known as a ‘synapse’. During activation, in addition to the antigen, CD25 is also presented by the APC to the T cell, thereby temporarily changing the intermediate IL-2 receptor to a high affinity IL-2 receptor. The level of this CD25 presentation may be sufficient for determining differentiation of cell type.
Therefore our model suggests that T cells could be differentiated by either their level of membrane bound CD25 or level of ‘priming’ at TCR activation.
3.3 Results: combining Model I and II
All of the results of section (A3.2) hold for arbitrary Hill functions (3.2). To make additional observations about the effects of the concentrations of IL-2 and CD122 on the range of bistability in Model II, we will use Model I to determine parameter choices for Model II. In particular, we will compute explicitly values of parameters |$V_0$| and |$C_0$| (as well as |$n$| and |$K_0$| in Section A3.3.1) from Model I for specific concentrations of IL-2 and CD122. Recall that the parameters |$V_0$| and |$C_0$| are explicitly related to the total concentrations of IL-2, CD122 and CD25. Specifically, the value of |$C_0$| represents the number of bound IL-2 receptors at equilibrium in the absence of CD25 (for fixed concentrations of IL-2 and CD122). Similarly, |$V_0$| represents the increase in the number of bound receptors at equilibrium in the presence of excess CD25.
To compute |$V_0$| and |$C_0$| from Model I for specific concentrations of IL-2 and CD122, we simulate the Model I until equilibrium is reached. Then, the equilibrium concentration of bound IL-2 receptors (|$[IL2\beta] + [IL2\alpha\beta]$|) can be determined as a function of different concentrations of CD25 (see Fig. A7). In this model, |$C_0$| represents the number of ‘intermediate affinity’ receptors bound to IL-2 at equilibrium when there is no available CD25 while |$V_0+C_0$| represents the total number of receptors (both intermediate and high affinity) bound to IL-2 at equilibrium in the presence of excess CD25. Recall that |$K_0$| is given by the concentration of CD25 at which the number of total bound receptors is half of the maximum (|$V_0+C_0$|). For various concentrations of IL-2 and CD122, the values of |$V_0$| and |$C_0$| were estimated by determining the equilibrium concentration of bound receptors in Model I for no CD25 and excess CD25 (10 nM), respectively. In this way, we use Model I to take specific concentrations of IL-2 and CD122 to produce values of |$V_0$| and |$C_0$| that can be analysed for bistability in Model II.
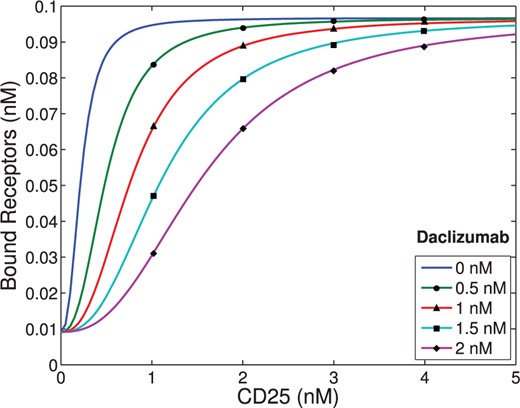
The Hill functions, given by 3.2, were fitted to data generated by Model I for fixed concentration of IL-2 and CD122 at 0.1 nM. The data generated from Model I was the equilibrium concentration of bound receptors as a function of increased concentration of CD25. Each curve represents a different fixed concentration of Daclizumab.
In order to use our analysis leading to (A3.17), we then take these values of |$V_0$| and |$C_0$| and compute their ratio for different values of IL-2 and CD122. In addition, we also include the parameter |$n$|. For different fixed values of |$n$|, we determine if the ratio |$\frac{V_0}{C_0}$| satisfies (A3.17) to find areas of potential bistability in terms of concentrations of IL-2 and CD122, see Fig. 3B. The regions where the bistability is possible form a set of nested square regions, symmetric across diagonal, that are parameterized by |$n$|. At low values of |$n$| (lower left corner), the region is very small and it is centred at very low concentrations of IL-2 and CD122. At |$n=1.5$| (union of first four squares), the region extends to concentrations of either IL-2 and CD122 of |$1$| nM, but, interestingly, both concentrations must be at least |$0.5$| nM.
The contour lines in Fig. 3B separating each region represent a specific value of |$n$|. For example, the contour line between the yellow and orange regions represents |$n=1.5$|. For this value of |$n$|, to satisfy (A3.16) and (A3.17), the ratio of |$V_0+C_0$| to |$C_0$| must equal 4. Recall that this indicates that the model would only exhibit bistability when the concentration of IL-2 and CD122 is such that increasing the concentration of CD25 increases the concentration of bound receptors by more than 400%.
While this analysis indicates that multiple equilibria are possible for certain concentrations of IL-2 and CD122 (given specific values of |$n$|), the precise size of the region of bistability still depends on |$K_0$| as well as the ratios |$\frac{r_s}{d_s}$| and |$\frac{d_\alpha}{p_\alpha \, pS^*}$|.
A3.3.1 Effect of Daclizumab in combined Model I and II
To better examine the effect of Daclizumab on the range of bistable behaviour predicted by Model II, we will use Model I to determine how the values of |$K_0$| and |$n$| change in response to increased concentrations of Daclizumab. For this numerical experiment, we will fix concentrations of IL-2 and CD122 at 0.1 nM each. For varying concentrations of Daclizumab (between 0 and 2 nM), we numerically simulated Model I until an equilibrium was reached as a function of concentration of CD25, ranging from 0 to 100 nM. As noted in Section 3.1, |$C_0$| is the concentration of bound receptors in the absence of CD25, and |$V_0 + C_0$| is the concentration of bound receptors in the presence of excess CD25 (0.0092 and 0.0875, respectively). Therefore, both can be determined directly from the numerical data by looking at the end points (0 nM CD25 and 100 nM CD25), see Fig. A7. Notice that the values for |$C_0$| (the y-intercept) and |$V_0+C_0$| (the horizontal asymptote) are not affected by the introduction of Daclizumab, which agree with our previous prediction (Section 3.2.1).
Then, using the Matlab function, fmincon, we fit the numerical data from Model I to Hill functions of the form (3.2) to estimate |$n$| and a |$K_0$| for each concentration of Daclizumab, see Fig. A7. Since the cooperativity parameter |$n$| should not depend on Daclizumab, we fit all Daclizumab curves with a single value of |$n$|, while varying the value of |$K_0$|. The best fit value of |$n$| was estimated at |$n=2.5088$| and the best fit curves are depicted in Fig. A7. The best values of |$K_0$| for |$n = 2.5088$| are plotted as a function of Daclizumab concentration, along with a quadratic curve fit through the points in Fig. A8. The quadratic fit was used to produce Fig. 4 in order to speed up the numerical calculations. Notice that |$K_0$| increases almost linearly with the concentration of Daclizumab in Fig. A8. This aligns with the discussion in Section 3.2.1 where we concluded that the introduction of Daclizumab will increase the value of |$K_0$|, and therefore, lead to a fold bifurcation, and a shift to a low CD25 equilibrium (and therefore a shift away from a precursor state of effector T call phenotype to a precursor state of memory T cell phenotype). While this analysis was done for IL-2 and CD122 concentrations of 0.1 nM, similar behaviour is observed at other values of IL-2 and CD122 (simulations not shown)
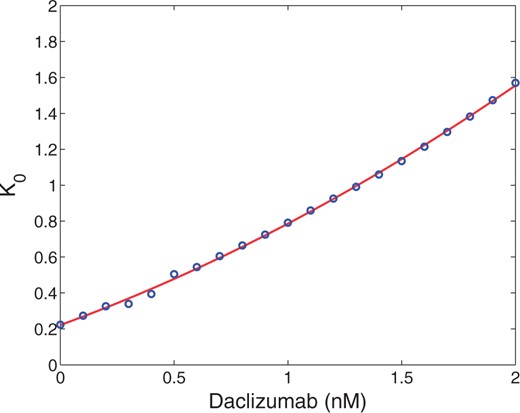
The Hill curves in Figure A7 are produced at different concentration of Daclizumab and differ by the value of |$K_0$|. Here we plot the values of |$K_0$| as a function of Daclizumab, along with the quadratic line of best fit (least squares) of these values.
A4. IL-2 Receptor with secondary signal (Model III)
A4.1 Summary of Model III assumptions
In addition to the assumptions made for Model I, we make the following additional assumptions:
The signalling portions of the receptor (CD122 and |$\gamma$|c) have two different states, specifically activated (phosphorylated) or deactivated (unphosphorylated).
The binding of IL-2 to CD122 and the |$\gamma$|-chain leads to the activation of the receptor.
The receptor will remain activated for some time even if IL-2 disengages, eventually decaying back into a deactivated state. This means that dephosphorylation is not instantaneous after IL-2 disengages.
Only activated receptors are capable of signalling.
The activated receptor has two different conformations based on whether IL-2 is bound or not leading to production of different preferential signals. If IL-2 is bound, the receptor preferentially phosphorylates STAT5 producing pSTAT5 as a signal. Alternately, if the receptor is activated, but IL-2 is not bound, then |$S_2$| will be preferentially produced.
A4.2 Equations
As in Model 1, we did not write differential equations for some of the variables, namely |$[IL2\alpha]$|, |$[\beta_d]$|, and |$[IL2]$|. These quantities will be determined from the three conservation laws above.
A3.3 New parameters
Because the presence of the secondary signal is being hypothesized, none of the parameters associated with this signal are known explicitly. The decay and initial conditions for |$S_2$| were chosen to be the same as those for |$[pSTAT5]$|. The production was chosen to be slightly higher to accentuate the differences in intermediate- versus high-affinity signalling.
Production/decay rates
| Production rate (nM|$^{-1}$|min|$^{-1}$|) | Decay rate (min|$^{-1}$|) | |
| |$[S_2]$| | 2.25|$^{\dagger}$| | 0.028|$^{\dagger}$| |
| |$[\beta_a] \rightarrow [\beta_d]$| | - | 0.05|$^{\dagger}$| |
| Production rate (nM|$^{-1}$|min|$^{-1}$|) | Decay rate (min|$^{-1}$|) | |
| |$[S_2]$| | 2.25|$^{\dagger}$| | 0.028|$^{\dagger}$| |
| |$[\beta_a] \rightarrow [\beta_d]$| | - | 0.05|$^{\dagger}$| |
Initial conditions
| Initial condition (nM) | |
| |$[S_2]$| | 0.18|$^{\dagger}$| |
| Initial condition (nM) | |
| |$[S_2]$| | 0.18|$^{\dagger}$| |
Initial conditions
| Initial condition (nM) | |
| |$[S_2]$| | 0.18|$^{\dagger}$| |
| Initial condition (nM) | |
| |$[S_2]$| | 0.18|$^{\dagger}$| |
A4.4 Results
A4.4.1 Differentiation of intermediate- versus high-affinity signalling
While the equilibrium concentration difference in the secondary signal (|$S_2$|) for intermediate- versus high-affinity receptors (~12%) shows only has a slight improvement over the difference in pSTAT5 (~9%) for 1 nM concentrations of IL-2 (see Fig. A9), the ability of this mechanism to distinguish between IL-2 signalling through intermediate-affinity versus high-affinity receptor does not diminish with increasing IL-2 as rapidly as the difference in pSTAT5 signal.
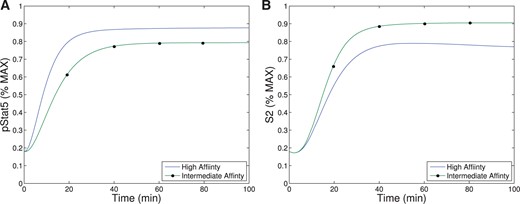
For low levels of IL-2 concentration, difference in concentration of |$S_2$|, (B), for the intermediate-affinity versus high-affinity receptor (~12%) does not provide a significant advantages over the difference in pSTAT5 signalling, (A), between these receptors (~9%).
In fact, the difference in production of |$S_2$| between intermediate and high affinity receptors actually improves ~33% for 5 nM concentrations of IL-2 while at this concentration if IL-2 the difference in pSTAT5 signalling has declined to ~1% (see Fig. A10). Furthermore, the |$S_2$| signal is still able to differentiate the two types of receptors at very high concentrations of IL-2, where we still observe a difference of ~10% at 100 nM IL-2. At this high concentration of IL-2, the pSTAT5 production through intermediate and high affinity receptors are virtually indistinguishable, see Fig. A11. Therefore, the signal |$S_2$| is able to differentiate intermediate and high affinity signalling for much greater ranges of IL-2 concentration that the bistability mechanism that was explored in Model II.
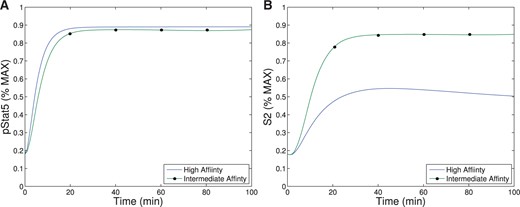
For moderate levels of IL-2 concentration, the difference in concentration of |$S_2$|, (B), for the intermediate-affinity versus high-affinity receptor (~33%) provides a significant advantages over the difference in pSTAT5 signalling, (A), between these receptors (~1%).
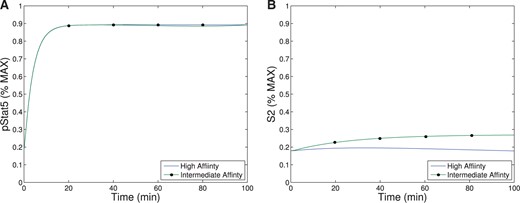
For high levels of IL-2 concentration, the difference in concentration of |$S_2$|, (B), for the intermediate-affinity versus high-affinity receptor remains ~10% while the difference in pSTAT5 signalling, (A), between these receptors is virtually indistinguishable.
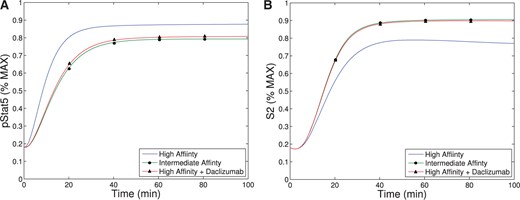
This figure plots the pSTAT5 signal (A) and |$S_2$| signal (B) for cells with CD25, which will demonstrate primarily high-affinity signalling (curve without circle or triangle), cells without CD25 (which can only have intermediate affinity signalling) with circle, and cells with CD25, but that have had their high affinity signalling blocked by Daclizumab (triangle). All three cases are for extracellular concentrations of IL-2 of 1 nM.
The signal |$S_2$| may represent a longer-term survival signal. As mentioned in the introduction, cells with higher levels of membrane bound CD25 terminally differentiate into effector cells, and IL-2 signalling in effector T cells is associated with activation and rapid proliferation followed by increased susceptibility to apotosis (Kalia et al., 2010). On the other hand, IL-2 signalling in cells with lower CD25 concentrations, typical of memory T cells, leads to homeostasis and survival (Burchill et al., 2007; Boyman & Sprent, 2012). The levels of pSTAT5 signalling alone are unlikely to be responsible for this difference long-term outcomes as the difference in pSTAT5 concentration seems insufficient to elicit these long-term affects. However, the balance of pSTAT5 and |$S_2$| could be sufficient to produce these seemingly contradictory long-term outcomes. In particular, the pSTAT5 signal could act like a proliferation and short-term survival signal, while |$S_2$| provides a long-term survival signal. Recall that difference in equilibrium level of |$S_2$| signalling associated with the high and intermediate affinity receptors is significant for moderate concentrations of IL-2 (see Fig. A10B). Therefore, a cell with many high-affinity receptors would receive significantly less long-term survival signal potentially leading to a higher rates of apoptosis. Additionally, some of the downstream signals of pSTAT5 and the other IL-2 associated pathways (PI3K, Ras-Raf-MAPK) have been shown to demonstrate mutual inhibition (bcl-6 and Blimp1 e.g.), so the small initial signalling differences could be enhanced further (Diehl et al., 2008; Johnston et al., 2009; Bratton et al., 2010; Crotty et al., 2010) by these downstream feedback loops.
A4.4.2 Daclizumab leads to intermediate affinity signalling
The use of Daclizumab to bind cellular CD25 and thus preventing IL-2 signalling through the high-affinity receptor has been used experimentally to represent intermediate affinity signalling because cells treated with sufficiently high level of Daclizumab will signal exclusively through intermediate affinity receptor (Queen et al., 1989; Bielekova, 2013). Therefore, this monoclonal antibody allows for the comparison of intermediate-affinity versus high-affinity signalling in identical cell types. We can use Model III to validate this experimental protocol. We show that in the model both signals associated with cells only containing intermediate affinity receptors are shown to be nearly identical to those of cells with high affinity receptors treated with Daclizumab. To see this observe that the triangle plots (cells containing CD25, but treated with Daclizumab) nearly overlay the circle plot (cells without CD25) in Figs A12 and A13).
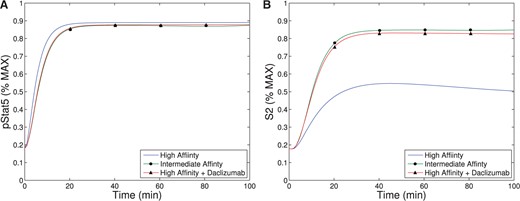
This figure plots the pSTAT5 signal (A) and |$S_2$| signal (B) for IL-2 concentration of 5 nM for cells with CD25 (without circle or triangle), cells without CD25 (circle) and cells with CD25 treated with Daclizumab (triangle).
