


Abstract
To review and meta-analyse the evidence about the prevalence of barriers to evidence-based practice (EBP) reported in physiotherapy.
Two independent investigators conducted an extensive electronic search in EMBASE, PubMed, Scopus, Web of Science and CINAHL databases from their inception to July 2020 and included the retrieved articles if they investigated barriers to EBP among physiotherapy professionals. Subsequently, they extracted data and assessed the methodological quality using a scale described in a similar previous study. The outcome for meta-analysis was frequency of each reported barrier. Sub-analyses were performed grouping studies based on countries where surveys were performed, classified as either developed or developing countries.
Twenty-nine articles were included in the systematic reviews and meta-analysis. Risk of bias assessment of included studies showed a median score: 4 points (interquartile range: 3–4). The findings of meta-analysis revealed that lack of time was the most frequently reported barrier (53.0% [95% confidence interval, 95%CI, 44.0–62.0]), followed by language (36.0% [95%CI 16.0–62.0]), lack of access (34.0% [95%CI 23.0.27]) and lack of statistical skills (31.0% [95%CI 20.0–44.0]). Lack of skills and lack of generalizability were declared as barriers by 27.0% [95%CI 18.0–38.0] and 23.0% [95%CI 15.0–33.0] of responders, respectively. Lack of support and lack of interest are less frequent, with 16.0% [95%CI 11.0–24.0] and 9.0% [95%CI 6.0–15.0] of responses, respectively. Barriers reported in investigations performed in developed countries were less frequent when compared to those performed in developing countries.
Organizational issues and methodological skills seem key issues to allow the implementation of EBP, suggesting the need to adopt or enhance organizational and training strategies to facilitate the implementation of the EBP. Quantitative synthesis showed high heterogeneity for all analyses, and therefore, pooled data should be interpreted with caution.
Introduction
Evidence-based practice (EBP) was defined as integrating the best research evidence with clinical expertise and patient values [1], considering the environmental (e.g. local health laws) and organizational (e.g. available resources) context [2]. Its implementation requires specific skills (e.g. literature search and critical appraisal for validity, clinical relevance and applicability) and assigned resources (e.g. accessibility to database and full text of articles) [2]. EBP is widely considered a standard of care throughout all of health care because it can be able to promote individualization of care and support the quality of health care [3]. At the same time, there are concerns about its application and use in clinical practice [4, 5].
Barriers to EBP can be considered as modifiable factors against the EBP implementation, and their knowledge could help to improve environmental and organizational context, as well as to enhance education. At the same time, improving education, environmental and organizational context, can be able to change attitudes and beliefs about EBP.
A number of surveys [6–9] and reviews [10, 11] were conducted in order to investigate barriers to EBP. The most common barriers to EBP are found to be lack of resources, lack of time, inadequate skills, inadequate access, lack of knowledge and financial barriers [10]. In a more recent review, patient overload and lack of personal time, knowledge and skills rather than a lack of facilities and resources are reported as main barriers [12].
In physiotherapy, two reviews summarized literature about the attitudes and use of EBP [9, 13], reporting inability to understand statistics, generalization of results and lack of time, support, resources and interest as main barriers to implement EBP. However, these reviews included articles published until 2012 [13] and 2014 [9] and provided results in a descriptive way, without a quantitative synthesis (e.g. meta-analysis); moreover, one of these [13] was limited to investigation performed in Western regions. Specific challenges for health research in developing countries have been stressed, in terms of lack of research culture, limited research education and limited access to research information [14], and, in the past years, few surveys were conducted in low- and middle-income countries [10].
In recent years, the dissemination of resources to access to literature may be increased (e.g. widespread use of the Internet and open access to literature) and several surveys addressed to physiotherapists were published, especially in developing countries. In addition, despite data obtained from primary research can be meta-analyzed in reviews of observational studies statistics of prevalence, no previous quantitative literature synthesis on barriers to EBP in physiotherapy has been performed.
Therefore, the aim was to perform a systematic review with meta-analysis on the prevalence of reported barriers to EBP in physiotherapy, exploring differences between developed and developing countries.
Methods
The reporting of this systematic review followed the Preferred Reporting Items for Systematic Reviews and Meta-Analyses checklist [15] (Supplementary Appendix 1).
Identification and selection of studies
An electronic search was conducted to retrieve complete original studies, reporting on barriers that restrain the EBP implementation in physiotherapy.
Studies were searched in PubMed, Scopus, Web of Science, EMBASE and CINAHL from their inception to July 2020. Full research strings for each database are reported in Supplementary Appendix 2.
To ensure retrieval of all potentially relevant publications, reference lists of related and included articles were checked by two independent reviewers (G.F. and M.P.).
Firstly, two independent reviewers (G.F. and M.P.) excluded irrelevant articles by reading the title and the abstract; then, the full texts of eligible articles were retrieved and assessed by the same reviewers for their inclusion. Disagreement was resolved by the involvement of a third reviewer (L.P.).
Studies were considered for inclusion if they met the following criteria: surveys on barriers in the use of EBP by physiotherapy professionals, published in English and Italian, involving different categories of health-care professionals only when it was possible to extract distinct data referred to physiotherapists. Studies on physiotherapy students and on the effectiveness of interventions to increase EBP skills, abstracts from conference proceedings and qualitative studies were excluded.
Methodological quality assessment
Risk of bias was assessed using the scale described by da Silva et al. [9], using criteria developed by Ferreira et al. [16] and Leboeuf-Yde and Lauritsen [17]. It consists of six criteria describing representativeness of the sample (three criteria) and quality of data (three criteria). The total score, summing up the number of criteria met, ranges from 0 (higher risk of bias) to 6 (lower risk of bias) (Supplementary Appendix 3). The risk of bias was rated by two independent reviewers (G.F. and L.P.), and disagreements were resolved by a third reviewer (M.P.).
Statistical analysis
Data from the eligible studies were combined to compute a pooled prevalence for the outcomes. Barriers were grouped in homogeneous areas to combine extracted frequencies: ‘generalizability,’ ‘interest,’ ‘general skills’ (e.g. searching for evidence or critically appraise an article), ‘statistical skills,’ ‘support’ (i.e. inadequate support from colleagues, managers and other health professionals), ‘access’ (i.e. access to electronic databases and articles’ full texts), ‘time’ and ‘language.’
The generalized linear mixed model (GLMM), a random intercept logistic regression model for the meta-analysis of proportions, was used for the meta-analysis [18]. GLMM uses the maximum likelihood estimation for the Tau-squared calculation and the logit transformation, without the reported weight of each study. We reported results through forest plots including both fixed and random effects.
Statistical heterogeneity was tested with statistical Q and its P-value, while it was quantified with Tau2 and I2 [19]. To reduce the heterogeneity, sub-group analyses were performed for each barrier, grouping studies based on countries where surveys were performed, classified as either developed or developing countries according to the International Statistical Institute (https://www.isi-web.org/capacity-building/developing-countries). Additional sub-analyses were conducted by grouping studies considering the continents where surveys were conducted, methodological quality (score <4 versus the others) and year of publication (before or after 2014, the year of the last published review in the physiotherapy field).
The publication bias was assessed using the funnel-plot graph method and the statistic test proposed by Thompson and Sharp [20], based on a weighted linear regression of the effect on its standard error using the method of moments estimator for the additive between-study variance component. A P-value <0.05 indicated significant publication bias.
Meta-analyses were performed using the software R and the ‘meta’ package [21].
If the frequencies of the demographic data of the included studies were not reported for all the samples, the missing data were reported in the table and the frequencies were recomputed. Finally, the scores of the risk of bias assessment of studies conducted in developed and developing countries were compared using the Mann–Whitney test. Descriptive and non-parametric statistics were calculated using SPSS software (Version 23 for Windows; SPSS Inc., Chicago, IL, USA).
Results
Study inclusion and characteristics
Of 3602 titles, 29 articles fulfilled the selection criteria [22–50] (participants = 9337, mean number of participants per article ± standard deviation = 338.0 ± 341.4) (Figure 1). The main characteristics of the study samples are reported in Table 1.
Main characteristics of the sample in the included studies
| Age | Gender | Place of employment | Education | Professional experience | Working hours per week | Patients per day | ||||||||
|---|---|---|---|---|---|---|---|---|---|---|---|---|---|---|
| Reference and country | Years | n (%) | n (%) | n (%) | n (%) | Years | n (%) | Hours | n (%) | n (%) | ||||
| Metcalfe et al., 2001 [22]a USA | NR | NR | NR | NR | NR | NR | NR | |||||||
| Kamwendo et al., 2002 [23] Sweden | Age for male: 36.9 ± 7.8; age for female: 41.3 ± 10.2 | Male Female Missing | 63 (18.4) 279 (81.3) 1 (0.3) | NR | NR | Experience for male: 10.3 ± 6.8 : experience for female: 14.1 ± 10.1 | NR | NR | ||||||
| Jette et al., 2003 [24] USA | 20–29 30–39 40–49 50+ Missing | 99 (20.3) 160 (32.9) 149 (30.5) 71 (14.5) 9 (1.8) | Male Female Missing | 141 (28.9) 338 (69.3) 9 (1.8) | Private outpatient clinic Facility-based outpatient clinic Acute care hospital Home care School system Skilled nursing facility Acute rehabilitation Subacute rehabilitation University Other Missing | 157 (32.2) 118 (24.2) 62 (12.7) 36 (7.4) 26 (5.3) 23 (4.7) 20 (4.1) 14 (2.9) 7 (1.4) 8 (1.6) 17 (3.5) | Baccalaureate Professional master's Advanced master's Professional doctorate Advanced doctorate Other Missing | 188 (38.6) 187 (38.4) 80 (16.4) 10 (2.0) 10 (2.0) 3 (0.6) 10 (2.0) | <5 5–10 11–15 >15 Missing | 130 (26.7) 108 (22.1) 57 (11.7) 185 (37.9) 8 (1.6) | <20 20–30 31–40 >40 Missing | 34 (7.0) 48 (9.8) 112 (23.0) 281 (57.5) 13 (2.7) | <5 5–10 11–15 >15 Missing | 53 (10.8) 164 (33.6) 162 (33.2) 92 (18.9) 17 (3.5) |
| Grimmer-Somers et al., 2007 [25] Australia | NR | NR | Private practice Public or private hospital Aged care or disability services Government department or university Missing | 96 (57.8) 44 (26.5) 14 (8.4) 11 (6.6) 1 (0.7) | Bachelor's or equivalent Master's Postgraduate diploma Honours degree Missing | 100 (60.2) 30 (18.1) 17 (10.2) 13 (7.8) 6 (3.7) | Mean time ± SD 16.8 ± 10.6 (range 0.5–47) | NR | NR | |||||
| Salbach et al., 2007 [26] Canada | 20–29 30–39 40–49 50+ Missing | 40 (14.8) 93 (34.4) 75 (27.8) 60 (22.2) 2 (0.8) | Male Female Missing | 30 (11.1) 239 (88.5) 1 (0.4) | Acute care hospital Rehabilitation hospital Private practice Home visiting agency Community care access center Long-term care facility Complex continuing care Community health center University Other Missing | 106 (39.3) 43 (15.9) 28 (10.4) 17 (6.3) 14 (5.2) 13 (4.8) 10 (3.7) 3 (1.1) 1 (0.4) 33 (12.2) 2 (0.7) | Bachelor's Certificate/diploma Applied or research master's Professional master's Missing | 203 (75.2) 30 (11.1) 23 (8.5) 8 (3.0) 6 (2.2) | <5 5–10 11–15 >15 Missing | 40 (14.9) 59 (21.9) 48 (17.8) 122 (45.2) 1 (0.4) | <20 20–30 31–40 >40 Missing | 28 (10.4) 51 (18.9) 154 (57.0) 35 (13.0) 2 (0.7) | 1–10 11–15 >15 Missing | 140 (51.9) 94 (34.8) 33 (12.2) 3 (1.1) |
| Fruth et al., 2010 [27]b USA | 20–29 30–39 40–49 50+ | 7 (29.2) 10 (41.7) 4 (16.7) 3 (12.5) | Male Female | 6 (25.0) 18 (75.0) | Hospital-based inpatient Hospital-based general outpatient Private practice outpatient orthopedic Long-term neurological rehabilitation | 11 (45.8) 7 (29.2) 3 (12.5) 3 (12.5) | Master's Bachelor's Doctor of physical therapy Transitional doctor of physical therapy | 11 (45.8) 7 (29.2) 3 (12.5) 3 (12.5) | <6 6–10 11–15 15+ | 7 (29.2) 6 (25.0) 5 (20.8) 6 (25.0) | NR | NR | ||
| Nilsagård and Lohse, 2010 [28] Sweden | NR | Male Female | 133 (16.0) 700 (84.0) | Primary care Habilitation/rehabilitation Hospital Company health service University Health maintenance and preventive care services Other | 255 (30.6) 235 (28.2) 183 (22.0) 46 (5.5) 26 (3.1) 11 (1.3) 77 (9.3) | <3-year ground education 3-year education Master's Specialist Master's 2 years Missing | 364 (43.7) 320 (38.4) 68 (8.2) 51 (6.1) 6 (0.7) 24 (2.8) | <14 14–29 >30 | 120 (14.4) 393 (47.2) 320 (38.4) | NR | NR | |||
| Gorgon et al., 2013 [29] Philippines | 20–29 30–39 | 120 (79.0) 32 (21.0) | Male | 51 (33.6%) 101 (66.4%) | Government tertiary hospital Private tertiary hospital | 53 (34.9) 99 (65.1) | Bachelor's Master's | 149 (98.0) 3 (2.0) | <5 5–10 11–15 Missing | 92 (60.6) 49 (32.2) 9 (5.9) 2 (1.3) | <20 21–30 31–40 >40 | 13 (8.6) 5 (3.3) 56 (36.8) 78 (51.3) | <5 5–10 11–15 >15 | 25 (16.4) 93 (61.2) 20 (13.2) 14 (9.2) |
| Weng et al., 2013a [30] Taiwan | NR | NR | NR | NR | NR | NR | NR | |||||||
| Diermayr et al., 2015 [31] Austria | 20–29 30–39 40–49 50+ Missing | 83 (14.1) 189 (32.1) 168 (28.6) 99 (16.8) 49 (8.4) | Male Female Missing | 97 (16.5) 438 (74.5) 53 (9.0) | Private practice Shared private practice Acute care hospital Rehabilitation center Home care Outpatient clinic University of applied sciences Home for the elderly Missing | 199 (33.8) 95 (16.2) 83 (14.1) 41 (7.0) 37 (6.3) 31 (5.3) 16 (2.7) 12 (2.0) 74 (12.6) | Diploma physical therapy Master/Master's student Bachelor's Dr/PhD/doctoral student Missing | 351 (59.7) 134 (22.8) 47 (8.0) 5 (0.9) 51 (8.6) | <5 5–10 11–15 >15 | 69 (11.7) 103 (17.5) 115 (19.6) 252 (42.9) 49 (8.3) | <20 20–30 31–40 >40 Missing | 64 (10.9) 175 (29.8) 158 (26.9) 141 (24.0) 50 (8.4) | <5 5–10 11–15 >15 Missing | 66 (11.2) 294 (50.0) 120 (20.4) 51 (8.7) 57 (9.7) |
| Panhale and Bellare [32] India | Mean age: 27 | Male Female | 13 (22.0) 47 (78.0) | NR | Graduates Post-graduates (2-year course) Post-graduates (3-year course) | 44 (73.0) 12 (20.0) 4 (7.0) | 1–5 Missing | 48 (80.0) 12 (20.0) | NR | NR | ||||
| Park et al., 2015 [33] Korea | <24 25–29 30–34 35+ | 19 (12.0) 61 (38.6) 52 (32.9) 26 (16.5) | Male Female | 103 (65.2) 55 (34.8) | General hospital University hospital Rehabilitation hospital Clinic | 81 (51.3) 51 (32.3) 21 (13.3) 5 (3.2) | University Graduate school or more College | 72 (45.6) 47 (29.7) 39 (24.7) | NR | NR | NR | |||
| Ramírez-Vèlez et al., 2015 [34] Ramírez-Vèlez et al., 2015 [35] Colombia | 20–29 30–39 40–49 50+ | 845 (79.4) 155 (14.6) 58 (5.5) 6 (0.6) | Male Female | 243 (22.8) 821 (77.2) | Private outpatient clinic Acute care hospital Facility-based outpatient clinic Skilled nursing facility University Acute rehabilitation Home care Sub-acute rehabilitation School system Other | 412 (38.7) 175 (16.4) 124 (11.7) 91 (8.6) 82 (7.7) 55 (5.2) 36 (3.4) 34 (3.2) 7 (0.7) 48 (4.5) | Undergraduate Specialized Master's Doctorate | 933 (87.7) 116 (10.9) 14 (1.3) 1 (0.1) | <5 5–10 11–15 >15 | 342 (32.1) 450 (42.3) 128 (12) 144 (13.5) | <20 20–30 31–40 >40 | 114 (10.7) 256 (24.1) 349 (32.8) 345 (32.4) | <5 5–10 11–15 >15 | 159 (14.9) 327 (30.7) 284 (26.7) 294 (27.6) |
| Silva et al., 2015 [36] Brazil | NR | Male Female | 49 (19.1) 207 (80.9) | Self-employed Private Public More than one | 129 (50.4) 84 (32.8) 32 (12.5) 11 (4.3) | Bachelor's Master's by coursework Master's by research Post-doctoral | 78 (30.5) 163 (63.6) 14 (5.5) 1 (0.4) | <5 5–9 10–14 15–19 20–24 >24 | 99 (38.6) 81 (31.6) 45 (17.6) 13 (5.1) 5 (2.0) 13 (5.1) | NR | NR | |||
| Wanjiru et al., 2016 [37] Kenya | Mean age: 30.5 (range 27–63) | Male Female | 17 (42.5) 23 (57.5) | NR | Diploma Higher diploma Degree Master's | 26 (65.0) 6 (15.0) 5 (12.5) 3 (7.5) | <5 5–10 11–20 21–30 31–40 >40 | 7 (17.5) 10 (25.0) 8 (20.0) 9 (22.5) 4 (10.0) 2 (5.0) | NR | NR | ||||
| Alshehri et al., 2017 [38] Saudi Arabia | 20–25 26–30 31–35 36–40 >40 | 118 (31.4) 119 (31.6) 73 (19,4) 34 (9.0) 32 (8.5) | Male Female | 227 (60.4) 149 (39.6) | Ministry of health Private health sectors University Other health sectors | 153 (40.7) 62 (16.5) 61 (16.2) 100 (26.6) | Bachelor's Master's Diploma Doctorate Doctor of physical therapy | 249 (66.2) 75 (19.9) 18 (4.8) 31 (8.2) 3 (0.8) | NR | NR | NR | |||
| Krutulytė et al., 2017 [39] Lithuania | 20–29 30–39 40–49 50+ | 106 (46.3) 58 (25.3) 29 (12.7) 36 (15.7) | NR | NR | NR | <3 3–5 6–10 11–15 16–20 >20 | 67 (29.3) 30 (13.1) 50 (21.8) 23 (10.0) 23 (10.0) 36 (15.7) | NR | NR | |||||
| Yahui and Swaminathan, 2017 [40] Malaysia | 25–34 35–44 45–54 55+ | 87 (85.3) 11 (10.8) 3 (2.9) 1 (1.0) | Male Female | 27 (26.5) 75 (73.5) | Private clinic Private hospital Government hospital Own practice University Home care Government health clinics | 33 (32.4) 30 (29.4) 22 (21.6) 9 (8.8) 4 (3.9) 3 (2.9) 1 (1.0) | Bachelor's Diploma certificate Master's Doctorate | 54 (52.9) 45 (44.1) 1 (1.0) 2 (2.0) | 2–5 >5 >10 >15 >20 | 59 (57.8) 24 (23.5) 7 (6.9) 7 (6.9) 5 (4.9) | <20 20–30 31–40 >40 | 10 (9.8) 10 (9.8) 34 (33.3) 48 (47.1) | NR | |
| Cardin and Hudson, 2018 [41]a USA | NR | NR | NR | NR | NR | NR | NR | |||||||
| Claudino et al., 2018 [42] Brazil | NR | Male Female | 12 (11.9) 89 (88.1) | Self-employed Private Public Both | 46 (45.5) 34 (33.7) 11 (10.9) 10 (9.9) | Master's of coursework Master's of research Bachelor's Doctorate Post-doctoral | 60 (59.4) 23 (22.8) 11 (10.8) 4 (4.0) 3 (3.0) | <5 5–9 10–14 15–19 20–24 >24 | 32 (31.7) 25 (24.8) 28 (27.7) 9 (8.8) 4 (4.0) 3 (3.0) | NR | NR | |||
| Dao and Pichaiyongwongdee, 2018 [43] Vietnam | 20–29 30–39 40–49 50+ | 138 (36.2) 159 (41.7) 61 (16.0) 23 (6.1) | Male Female | 146 (38.3) 235 (61.7) | NR | Vocational school and college Bachelor's Master's and doctorate | 209 (54.9) 169 (44.4) 3 (0.7) | <6 6–9 10–14 15+ | 116 (30.4) 88 (23.1) 79 (20.7) 98 (25.8) | NR | 1–3 4–6 7–10 11+ | 12 (3.1) 21 (5.5) 85 (22.3) 263 (69.1) | ||
| Quartey and Kwakye, 2018 [44] Ghana | 20–25 26–30 31–35 36–40 | 16 (13.2) 63 (52.1) 29 (24.0) 13 (10.7) | Male Female | 74 (61.2) 47 (38.8) | General hospital University Private practice Rehabilitation hospital Community care access center | 103 (85.1) 11 (9.2) 5 (4.1) 1 (0.8) 1 (0.8) | Bachelor's Applied or research master's Entry level master's | 111 (91.7) 6 (5.0) 4 (3.3) | <5 5–8 >8 | 45 (37.1) 68 (56.2) 8 (6.6) | NR | 5–10 11–15 >15 | 40 (33.1) 39 (32.2) 42 (34.7) | |
| Alrowayeh and Buabbas, 2019 [45] Kuwait | 20–29 30–39 40–49 >50 Missing | 42 (22.9) 79 (42.9) 50 (27.2) 12 (6.5) 1 (0.5) | Male Female Missing | 72 (40.2) 108 (58.7) 2 (1.1) | General hospital Rehabilitation hospital Specialized hospital Missing | 70 (38.0) 69 (37.5) 43 (23.4) 2 (1.1) | Bachelor's Master's Missing | 131 (71.2) 48 (26.1) 5 (2.7) | 0–5 6–10 11–15 16–20 >20 Missing | 33 (17.9) 32 (17.4) 38 (20.7) 38 (20.7) 33 (17.9) 10 (5.4) | <10 10–19 20–29 30–39 >40 Missing | 22 (12.0) 5 (2.6) 38 (20.7) 62 (33.7) 45 (24.5) 12 (6.5) | 1–7 8–12 >12 Missing | 92 (50.0) 69 (37.5) 11 (6.0) 12 (6.2) |
| Bajracharya et al., 2019 [46] Nepal | 20–30 31–40 41–50 >50 | 129 (78.7) 27 (16.5) 3 (1.8) 5 (3.0) | Male Female | 78 (47.6) 86 (52.4) | Acute care hospital Missing | 89 (54.3) 75 (45.7) | NR | <2 2–5 6–10 >10 | 65 (39.6) 55 (33.5) 30 (18.3) 14 (8.5) | <20 20–30 31–40 >40 | 6 (3.7) 11 (6.7) 36 (22) 111 (67) | <5 5–10 11–15 >15 | 14 (8.5) 67 (40.9) 44 (26.8) 39 (23.8) | |
| Cobo-Sevilla et al., 2019 [47] Ecuador | 20–29 30–39 40–49 >50 | 24 (35.8) 31 (46.2) 6 (9.0) 6 (9.0) | Male Female | 25 (37.3) 42 (62.7) | Acute care Outpatient Private office Private outpatient Others | 55 (82.0) 6 (9.0) 2 (3.0) 2 (3.0) 2 (3.0) | Bachelor's Graduate studies Technologist Missing | 54 (80.6) 8 (13.4) 1 (1.5) 4 (6.0) | 0–5 6–10 11–15 >15 | 24 (35.8) 18 (26.9) 16 (23.9) 9 (13.4) | <20 20–30 31–40 >40 | 7 (10.5) 2 (3.0) 24 (35.8) 34 (50.7) | <5 5–10 11–15 >15 | 1 (1.5) 4 (6.0) 5 (7.5) 57 (85.0) |
| Nascimento et al., 2019 [48] Brazil | 20–29 30–39 40–49 50+ | 63 (38.4) 79 (48.1) 16 (9.8) 6 (3.7) | Male Female Missing | 40 (24.4) 122 (74.4) 2 (1.2) | Private long-term facility Hospital University Public long-term facility Rehabilitation hospital Community care access center Missing | 74 (45.1) 24 (14.6) 23 (14.0) 19 (11.6) 12 (7.3) 6 (3.7) 6 (3.7) | Specialization Bachelor's Master's Doctorate | 86 (50.0) 43 (26.3) 21 (12.8) 14 (8.5) | <5 5–10 11–15 >15 Missing | 65 (39.6) 61 (37.2) 21 (12.8) 15 (9.1) 2 (1.2) | NR | <5 5–10 11–15 >15 Missing | 12 (7.3) 45 (27.4) 18 (11.0) 17 (10.4) 72 (43.9) | |
| Castellini et al., 2020 [49]c Italy | <29 29–38 39–49 >49 | 361 (28.0) 400 (31.0) 232 (18.0) 296 (23.0) | Male Female | 619 (48.0) 670 (52.0) | Private office Hospital Nursing home Teaching hospital Unemployed Other | 657 (59.0) 223 (20.0) 167 (15.0) 78 (7.0) 22 (2.0) 189 (17.0) | NR | NR | NR | NR | ||||
| Ibikunle et al., 2020 [50] Nigeria | 20–29 30–39 40–49 50+ | 98 (57.6) 58 (34.1) 11 (6.5) 3 (1.8) | Male Female | 106 (62.4) 64 (37.6) | University General hospital Private practice Rehabilitation hospital Consulting firm Specialist hospital Federal medical center Tertiary hospital | 65 (38.2) 61 (35.9) 20 (11.8) 8 (4.7) 7 (4.1) 5 (2.9) 3 (1.8) 1 (0.6) | Bachelor's Entry-level master's Applied or research master's Doctoral | 136 (80.0) 17 (10.0) 15 (8.8) 2 (1.2) | 0–4 5-9 10–14 15–19 20–24 25–29 30–34 | 97 (57.1) 39 (22.9) 26 (15.3) 5 (2.9) 1 (0.6) 1 (0.6) 1 (0.6) | <20 20–30 31–40 >40 | 34 (20.0) 32 (18.8) 52 (30.6) 52 (30.6) | <5 5–10 11–15 >15 | 23 (13.5) 110 (64.7) 24 (14.1) 13 (7.6) |
Abbreviatons: n, number; %, percentage; NR, not reported; SD, standard deviation.
Characteristics were not available for physical therapists but only for the total sample (including other health professionals).
Demographic data are reported for 24 subjects; barriers data are reported for 43 subjects including test and retest.
For place of employment, percentage exceed 100% because this question allowed more than one answer in the original study.
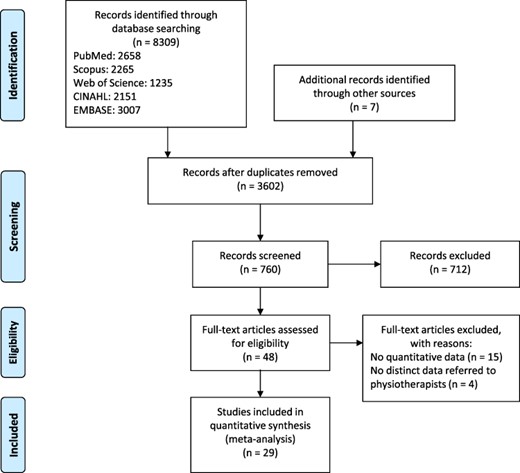
Flowchart of study selection.
Lack of time and lack of skills were the most reported barriers, reported in 27 [22–32, 34–50] and 24 [22–31, 33–38, 40–42, 44–46, 49, 50] of the included studies, followed by lack of access (n = 23) [22, 24–31, 33–35, 37, 38, 40, 41, 43–47, 49, 50], lack of support (n = 23) [22, 24–30, 33–35, 37–41, 44–50], lack of interest (n = 21) [23, 24, 26–29, 31, 34–36, 38–42, 44–46, 48–50], lack of generalizability (n = 19) [22, 24–27, 29, 31–36, 40, 42, 44, 45, 48–50] and lack of statistical skills (n = 17) [22, 24–26, 29, 31–36, 42, 44, 45, 48–50]. Language was reported as a barrier in few studies (n = 8) [30, 31, 34–36, 42, 43, 49]. Studies were performed in 15 countries from 6 different continents: 9 in Asia [29, 30, 32, 33, 38, 40, 43, 45, 46], 6 in South America [34–36, 42, 47, 48], 5 in North America [22, 24, 26, 27, 41] and Europe [23, 28, 31, 39, 49], 3 in Africa [37, 44, 50] and 1 in Oceania [25]. Response rate ranged from 17.5% [31] to 95.0% [37] (Table 2).
Total sample size and response rate of the included studies
| Study | Total sample (responded—response rate) |
|---|---|
| Metcalfe et al., 2001 [22] | 348 (287—82.5%) |
| Kamwendo et al., 2002 [23] | 556 (343—61.7%) |
| Jette et al., 2003 [24] | 1000 (488—48.8%) |
| Grimmer-Somers et al., 2007 [25] | 335 (166—49.5%) |
| Salbach et al., 2007 [26] | 334 (270—80.8%) |
| Fruth et al., 2010 [27] | NR (43—NR) |
| Nilsagård and Lohse, 2010 [28] | 2160 (833—38.6%) |
| Gorgon et al., 2013 [29] | 188 (150—79.8%) |
| Weng et al., 2013 [30] | NR (149—NR) |
| Diermayr et al., 2015 [31] | 3360 (588—17.5%) |
| Panhale and Bellare [32] | 100 (60—60.0%) |
| Park et al., 2015 [33] | 200 (158—79.0%) |
| Ramírez-Vélez et al., 2015 [34] | 1250 (1064—85.1%) |
| Ramírez-Vélez et al., 2015 [35] | 1250 (1064—85.1%) |
| Silva et al., 2015 [36] | 490 (256—52.2%) |
| Wanjiru et al., 2016 [37] | 42 (40—95%) |
| Alshehri et al., 2017 [38] | 604 (376—62.2%) |
| Krutulytė et al., 2017 [39] | 300 (229—76.3%) |
| Yahui and Swaminathan, 2017 [40] | 354 (102—28.8%) |
| Cardin and Hudson, 2018 [41] | NR (30—NR) |
| Claudino et al., 2018 [42] | 250 (101—40.4%) |
| Dao and Pichaiyongwongdee, 2018 [43] | 453 (381—84.1%) |
| Quartey and Kwakye, 2018 [44] | 130 (121—93.0%) |
| Alrowayeh and Buabbas, 2019 [45] | 200 (184—92.0%) |
| Bajracharya et al., 2019 [46] | NR (164—NR) |
| Cobo-Sevilla et al., 2019 [47] | NR (67—NR) |
| Nascimento et al., 2019 [48] | 260 (164—63.1%) |
| Castellini et al., 2020 [49] | 2000 (1289—64.5%) |
| Ibikunle et al., 2020 [50] | 220 (170—85%) |
Abbreviation: NR, not reported.
Fourteen studies were included in the sub-group developing countries [29, 32, 34–37, 40, 42–44, 46–48, 50]. Response rate ranged from 28.8% [40] to 95.0% [37]. Fifteen studies were conducted in developed countries [22–28, 30, 31, 33, 38, 39, 41, 45, 49], with a response rate ranging from 17.5% [31] to 92.0% [45] (Table 2).
Methodological quality
The score ranged from 2 to 6 points (median = 4; interquartile range = 3–4) for all included studies. For developed countries, the total score varied between 2 and 6 points (median = 4; interquartile range = 3–4.5), while for developing countries the total score ranged between 3 and 5 points (median = 3.5; interquartile range = 3–4); the result of Mann–Whitney test revealed no significant difference between the scores of studies conducted in developed and developing countries. ‘Data collection’ item was satisfied by all articles, while ‘non-responders’ and ‘power calculation’ were the less frequently satisfied items (only by 4 [13.8%] and 7 [24.1%] articles, respectively) (Table 3).
Quality assessment of the studies included in the systematic review
| Study | Description of the sample | Non-responders | Response rate | Data collection | Questionnaire validated | Power calculation | Total score* |
|---|---|---|---|---|---|---|---|
| Developed countries | |||||||
| Metcalfe et al., 2001 [22] | + | – | + | + | + | – | 4 |
| Kamwendo et al., 2002 [23] | + | – | + | + | + | – | 4 |
| Jette et al., 2003 [24] | + | – | + | + | + | – | 4 |
| Grimmer-Somers et al., 2007 [25] | + | – | + | + | + | + | 5 |
| Salbach et al., 2007 [26] | + | + | + | + | – | – | 4 |
| Fruth et al., 2010 [27] | + | – | – | + | – | – | 2 |
| Nilsagård and Lohse, 2010 [28] | + | – | + | + | – | – | 3 |
| Weng et al., 2013 [30] | + | – | – | + | + | – | 3 |
| Diermayr et al., 2015 [31] | + | + | + | + | + | – | 5 |
| Park et al., 2015 [33] | + | – | + | + | – | – | 3 |
| Alshehri et al., 2017 [38] | + | + | + | + | + | + | 6 |
| Krutulytė et al., 2017 [39] | + | – | + | + | + | – | 4 |
| Cardin and Hudson, 2018 [41] | + | – | – | + | + | – | 3 |
| Alrowayeh and Buabbas, 2019 [45] | + | – | + | + | + | – | 4 |
| Castellini et al., 2020 [49] | + | – | + | + | + | + | 5 |
| Developing countries | |||||||
| Gorgon et al., 2013 [29] | + | – | + | + | – | – | 3 |
| Ramírez-Vélez et al., 2015 [34] | + | – | – | + | + | – | 3 |
| Ramírez-Vélez et al., 2015 [35] | + | – | – | + | + | – | 3 |
| Silva et al., 2015 [36] | + | – | + | + | + | + | 5 |
| Panhale and Bellare, 2015 [32] | – | – | + | + | – | – | 2 |
| Wanjiru et al., 2016 [37] | + | – | + | + | – | – | 3 |
| Yahui and Swaminathan, 2017 [40] | + | – | + | + | + | – | 4 |
| Claudino et al., 2018 [42] | + | – | + | + | – | – | 3 |
| Dao and Pichaiyongwongdee, 2018 [43] | + | – | + | + | + | – | 4 |
| Quartey and Kwakye, 2018 [44] | + | – | + | + | – | – | 3 |
| Bajracharya et al., 2019 [46] | + | – | – | + | + | + | 4 |
| Cobo-Sevilla et al, 2019 [47] | + | – | + | + | + | + | 5 |
| Nascimento et al., 2019 [48] | + | + | + | + | + | – | 5 |
| Ibikunle et al., 2020 [50] | + | – | + | + | – | + | 4 |
Notes: Total score ranges from 0 (worst quality) from 6 (best quality).
Meta-analyses
Pooled prevalence, with 95% confidence interval (95% CI), of each barrier for both the whole sample and studies conducted in developed and developing countries is reported in Table 4. The forest plots for each barrier are reported in Supplementary Appendix 4.
Results of the meta-analyses for study conducted in developed and developing countries and for all included studies
| Study | Time | Skills | Access | Support | Interest | Generalizability | Statistical skills | Language |
|---|---|---|---|---|---|---|---|---|
| Developed countries | ||||||||
| Metcalfe et al., 2001 [22] | 0.62 [0.56; 0.67] | 0.67 [0.61; 0.72] | 0.45 [0.39; 0.51] | 0.37 [0.31; 0.43] | 0.50 [0.44; 0.56] | 0.80 [0.75; 0.85] | ||
| Kamwendo et al., 2002 [23] | 0.52 [0.47; 0.58] | 0.02 [0.01; 0.04] | 0.05 [0.03; 0.07] | |||||
| Jette et al., 2003 [24] | 0.46 [0.41; 0.51] | 0.03 [0.02; 0.05] | 0.02 [0.01; 0.04] | 0.03 [0.02; 0.05] | 0.01 [0.00; 0.02] | 0.09 [0.07; 0.12] | 0.04 [0.02; 0.06] | |
| Grimmer-Somers et al., 2007 [25] | 0.31 [0.24; 0.39] | 0.43 [0.35; 0.51] | 0.20 [0.15; 0.27] | 0.25 [0.18; 0.32] | 0.20 [0.14; 0.27] | 0.54 [0.46; 0.62] | ||
| Salbach et al., 2007 [26] | 0.74 [0.69; 0.80] | 0.31 [0.25; 0.37] | 0.16 [0.12; 0.21] | 0.04 [0.02; 0.07] | 0.03 [0.02; 0.06] | 0.34 [0.28; 0.40] | 0.30 [0.25; 0.36] | |
| Fruth et al., 2010 [27] | 0.84 [0.69; 0.93] | 0.26 [0.14; 0.41] | 0.40 [0.25; 0.56] | 0.19 [0.08; 0.33] | 0.09 [0.03; 0.22] | 0.23 [0.12; 0.39] | ||
| Nilsagård and Lohse, 2010 [28] | 0.86 [0.83; 0.88] | 0.55 [0.52; 0.58] | 0.80 [0.77; 0.83] | 0.46 [0.43; 0.49] | ||||
| Weng et al., 2013 [30] | 0.60 [0.52; 0.68] | 0.36 [0.29; 0.45] | 0.62 [0.54; 0.70] | 0.12 [0.07; 0.18] | 0.61 [0.53; 0.69] | |||
| Diermayr et al., 2015 [31] | 0.22 [0.18; 0.25] | 0.06 [0.04; 0.08] | 0.09 [0.07; 0.11] | 0.09 [0.07; 0.12] | 0.05 [0.03; 0.07] | 0.08 [0.06; 0.10] | 0.15 [0.12; 0.18] | 0.07 [0.05; 0.09] |
| Park et al., 2015 [33] | 0.30 [0.23; 0.38] | 0.39 [0.31; 0.47] | 0.58 [0.50; 0.66] | 0.39 [0.31; 0.47] | 0.64 [0.56; 0.71] | 0.45 [0.37; 0.53] | ||
| Alshehri et al., 2017 [38] | 0.23 [0.19; 0.27] | 0.36 [0.32; 0.42] | 0.36 [0.31; 0.41] | 0.31 [0.26; 0.36] | 0.23 [0.19; 0.28] | |||
| Krutulytė et al., 2017 [39] | 0.30 [0.24; 0.36] | 0.07 [0.04; 0.11] | 0.05 [0.02; 0.08] | |||||
| Cardin and Hudson, 2018 [41] | 0.37 [0.20; 0.56] | 0.10 [0.02; 0.27] | 0.20 [0.08; 0.39] | 0.17 [0.06; 0.35] | 0.10 [0.02; 0.27] | |||
| Alrowayeh and Buabbas, 2019 [45] | 0.59 [0.52; 0.66] | 0.07 [0.04; 0.12] | 0.49 [0.41; 0.56] | 0.02 [0.01; 0.05] | 0.01 [0.00; 0.04] | 0.41 [0.34; 0.48] | 0.03 [0.01; 0.07] | |
| Castellini et al., 2020 [49] | 0.23 [0.21; 0.25] | 0.09 [0.08; 0.11] | 0.08 [0.07; 0.10] | 0.12 [0.10; 0.14] | 0.11 [0.09; 0.13] | 0.11 [0.09; 0.13] | 0.10 [0.08; 0.11] | 0.05 [0.04; 0.06] |
| Total (fixed effects) | 0.45 [0.43; 0.46] | 0.24 [0.23; 0.25] | 0.30 [0.29; 0.32] | 0.14 [0.13; 0.15] | 0.15 [0.14; 0.16] | 0.20 [0.19; 0.21] | 0.21 [0.19; 0.22] | 0.10 [0.08; 0.11] |
| Total (random effects) | 0.48 [0.36; 0.60] | 0.19 [0.10; 0.33] | 0.28 [0.16; 0.46] | 0.12 [0.07; 0.20] | 0.07 [0.03; 0.13] | 0.25 [0.14; 0.39] | 0.22 [0.09; 0.46] | 0.15 [0.03; 0.51] |
| I2 (heterogeneity, %) | 98 | 99 | 99 | 97 | 98 | 98 | 99 | 99 |
| Developing countries | ||||||||
| Gorgon et al., 2013 [29] | 0.85 [0.78; 0.90] | 0.40 [0.32; 0.48] | 0.44 [0.36; 0.52] | 0.27 [0.20; 0.34] | 0.16 [0.11; 0.23] | 0.26 [0.19; 0.34] | 0.44 [0.36; 0.52] | |
| Panhale and Bellare, 2015 [32] | 0.32 [0.20; 0.45] | 0.18 [0.10; 0.30] | 0.18 [0.10; 0.30] | |||||
| Ramírez-Vélez et al., 2015 [34] | 0.35 [0.32; 0.38] | 0.41 [0.38; 0.44] | 0.09 [0.07; 0.11] | 0.03 [0.02; 0.04] | 0.01 [0.01; 0.02] | 0.02 [0.01; 0.03] | 0.39 [0.36; 0.42] | 0.22 [0.19; 0.25] |
| Ramírez-Vélez et al., 2015 [35] | 0.44 [0.41; 0.47] | 0.56 [0.53; 0.59] | 0.20 [0.18; 0.23] | 0.15 [0.13; 0.17] | 0.11 [0.09; 0.13] | 10.1 (8.3–12.0) | 0.53 [0.50; 0.56] | 0.33 [0.30; 0.36] |
| Silva et al., 2015 [36] | 0.61 [0.55; 0.67] | 0.41 [0.35; 0.47] | 0.28 [0.23; 0.34] | 0.55 [0.49; 0.62] | 0.54 [0.48; 0.61] | 0.70 [0.64; 0.76] | ||
| Wanjiru et al., 2016 [37] | 0.80 [0.64; 0.91] | 0.72 [0.56; 0.85] | 0.85 [0.70; 0.94] | 0.75 [0.59; 0.87] | ||||
| Yahui and Swaminathan, 2017 [40] | 0.28 [0.20; 0.38] | 0.17 [0.10; 0.25] | 0.17 [0.10; 0.25] | 0.16 [0.09; 0.24] | 0.14 [0.08; 0.22] | 0.21 [0.13; 0.30] | ||
| Claudino et al., 2018 [42] | 0.45 [0.35; 0.55] | 0.42 [0.32; 0.52] | 0.28 [0.19; 0.38] | 0.61 [0.51; 0.71] | 0.54 [0.44; 0.64] | 0.47 [0.37; 0.57] | ||
| Dao and Pichaiyongwongdee, 2018 [43] | 0.72 [0.67; 0.76] | 0.73 [0.68; 0.77] | 0.84 [0.80; 0.88] | |||||
| Quartey and Kwakye, 2018 [44] | 0.46 [0.37; 0.56] | 0.18 [0.12; 0.26] | 0.43 [0.34; 0.52] | 0.09 [0.05; 0.16] | 0.33 [0.25; 0.42] | 0.15 [0.09; 0.22] | 0.36 [0.27; 0.45] | |
| Bajracharya et al., 2019 [46] | 0.67 [0.59; 0.74] | 0.63 [0.55; 0.70] | 0.53 [0.45; 0.61] | 0.34 [0.27; 0.42] | 0.24 [0.17; 0.31] | |||
| Cobo-Sevilla et al., 2019 [47] | 0.96 [0.87; 0.99] | 0.54 [0.41; 0.66] | 0.51 [0.38; 0.63] | |||||
| Nascimento et al., 2019 [48] | 0.62 [0.54; 0.70] | 0.32 [0.25; 0.39] | 0.05 [0.02; 0.09] | 0.33 [0.26; 0.41] | 0.32 [0.25; 0.39] | |||
| Ibikunle et al., 2020 [50] | 0.48 [0.40; 0.55] | 0.31 [0.24; 0.38] | 0.43 [0.35; 0.51] | 0.14 [0.09; 0.20] | 0.13 [0.08; 0.19] | 0.26 [0.19; 0.33] | 0.28 [0.21; 0.35] | |
| Total (fixed effects) | 0.49 [0.48; 0.51] | 0.45 [0.43; 0.47] | 0.29 [0.27; 0.30] | 0.15 [0.13; 0.16] | 0.11 [0.10; 0.12] | 0.16 [0.15; 0.17] | 0.44 [0.42; 0.46] | 0.39 [0.38; 0.41] |
| Total (random effects) | 0.59 [0.46; 0.71] | 0.41 [0.30; 0.52] | 0.42 [0.26; 0.59] | 0.22 [0.12; 0.38] | 0.13 [0.07; 0.23] | 0.22 [0.12; 0.36] | 0.40 [0.32; 0.48] | 0.52 [0.30; 0.73] |
| I2 (heterogeneity, %) | 98 | 97 | 98 | 98 | 97 | 98 | 94 | 99 |
| Total (fixed effects) | 0.47 [0.46; 0.48] | 0.32 [0.31; 0.33] | 0.30 [0.29; 0.31] | 0.14 [0.14; 0.15] | 0.13 [0.13; 0.14] | 0.18 [0.17; 0.19] | 0.32 [0.31; 0.33] | 0.27 [0.26; 0.28] |
| Total (random effects) | 0.53 [0.44; 0.62] | 0.27 [0.18; 0.38] | 0.34 [0.23; 0.47] | 0.16 [0.11; 0.24] | 0.09 [0.06; 0.15] | 0.23 [0.15; 0.33] | 0.31 [0.20; 0.44] | 0.36 [0.16; 0.62] |
| I2 (inconsistency, %) | 98 | 99 | 99 | 98 | 98 | 98 | 99 | 99 |
Lack of time was the most frequently reported barrier (53.0% [95%CI = 44.0–62.0]), followed by language (36.0% [95%CI = 16.0–62.0]), lack of access (34.0% [95%CI = 23.0–47.0]) and lack of statistical skills (31.0% = [95%CI 20.0–44.0]). Lack of skills and lack of generalizability were declared as barriers by 27.0% [95%CI = 18.0–38.0] and 23.0% [95%CI = 15.0–33.0] of responders, respectively. Lack of support and lack of interest are less frequent, with 16.0% [95%CI = 11.0–24.0] and 9.0% [95%CI = 6.0–15.0] of responses, respectively.
With the exception of the group ‘generalizability,’ barriers reported in investigations performed in developed countries were less frequent when compared to those performed in developing countries, especially for ‘time,’ ‘general skills,’ ‘statistical skills,’ ‘access’ and ‘language’ (Table 4, Supplementary Appendix 4).
Heterogeneity was found to be high for all analyses, ranging from 98% to 99% (Table 4). All additional sub-group analyses, according to continents (i.e. Europe, Africa, Asia, Oceania, North and South America), methodological quality (i.e. best [≥4 points] or worst [<4 points] quality]) and year of publication (i.e. articles published before and after 2014) were not able to explain heterogeneity.
The P-value for publication bias was significant for meta-analyses regarding barriers on time (P = 0.007), skills (P = 0.004), interest (P = 0.003) and statistical skills (P = 0.027) but not for the other barriers (Supplementary Appendix 5).
Discussion
Statement of principal findings
Barriers to the EBP implementation in the clinical practice are related to the organizational context (lack of time, access and support), education (language, lack of research and statistical skills), personal behavior (lack of interest) and limits of EBP (lack of generalizability).
These results are similar to those reported in previous reviews [9, 13]. This systematic review reports quantitative pooled data on each barrier also grouped based on countries where surveys were performed (developed/developing countries).
Quantitative synthesis shows high heterogeneity for all analyses, and therefore, pooled data should be interpreted with caution.
Strengths and limitations
To our knowledge, this systematic review reports, for the first time, quantitative pooled data on barriers to EBP implementation in the field of physiotherapy and compares surveys conducted in developed and developing countries. Moreover, a large number of surveys were included (n = 29), balanced between developed (n = 15) and developing (n = 14) countries.
Twenty studies (70.4%) were published after 2014, and all surveys conducted in developing countries, with the exception of Gorgon et al.[29,], as well as some studies published before 2014 [22, 23, 27, 30,] were not included in previous systematic reviews [9, 13]. In addition, quantitative synthesis allows to highlight the high heterogeneity among studies.
However, this study also presented limitations that deserve to be discussed. A potential limitation is that grouping barriers in eight areas was an arbitrary choice. For example, ‘lack of support’ includes support from colleagues, managers and other health professionals. However, an external and standardized criterion for grouping the results is not available in the literature, and we tried to put together different items in a coherent way. Secondly, detection of frequencies of barriers is related to the structure of used questionnaires. Surveys include a finite set of pre-determined items that assess the individual importance of each barrier and might not include all potential factors [51]. Moreover, interaction among different barriers Was not investigated, despite it might have synergistic effects on EBP implementation [51]. In addition, the scale used to assess the risk of bias, proposed by da Silva et al. [9], could lack content validity (i.e. it does not include specific aspects related to the validity of the measurements and analyses); however, no consensus is available in literature on the best to use to evaluate the methodological quality of surveys; therefore, future researches in this topic should be implemented. Finally, the search was restricted to studies in English and Italian.
Interpretation within the context of the wider literature
Barriers referred to organizational context built a complex area with a potential interaction among single barriers, without relevant differences across countries. Lack of time is reported as a barrier by >50% of responders. It should be recognized that ‘lack of time’ may include different barriers, as lack of willingness to change clinical practice or low priority of learning EBP principles over practical skills [52]. Indeed, ideally, lack of time should be perceived as a barrier only when skills and access are satisfied, but it seems to be not true. Lack of access to research resources was reported as a barrier by more than one-third of responders, with a higher frequency in developing countries. Limited access to information has been found to be a relevant barrier also for nurses working in low- and middle-income countries [53]. However, since access restrictions can be also due to the high number of subscription only databases and journals and access to these resources are frequently provided by academic institutions, physiotherapists freelance or working in non-academic institutions can have problems to EBP access across all countries [54]. For example, apart from the Hinari database sponsored by the World Health Organization, many Nigerian public health establishments do not subscribe to other research databases [50]. The theme ‘lack of support’ includes different types of support (i.e. inadequate support from colleagues, managers and other health professionals) at different levels (i.e. individual, workplace and extra-organizational levels) [55]. This is not a frequently reported barrier, mainly in developed countries, although it could be ascribed, at least partially, to other reported barriers as lack of time or lack of access, because they also depend on organization restrictions.
Barriers referred to education are more frequently reported in surveys performed in developing countries. Language is frequently reported as a barrier, although it was investigated only in some studies conducted in non-native English countries, reaching to be perceived as a barrier for >50% of responders in developing countries. This issue was not analyzed in previous reviews, probably as seven of the eight studies are published after 2014. This issue is relevant since English is currently the predominant language in the field of biomedical publications [56], and language seems to be a relevant barrier in developing countries. Lack of research skills is reported by nearly one-third of responders. This group of skills includes finding the best evidence, formulating a relevant and clear question, evaluating evidences and applying them and combining them with clinical experience and patient values [57]. Furthermore, inability to understand statistical data was reported by more than one-third of responders. Both these types of barriers are more frequently reported in developing countries, suggesting specific needs in these areas [10, 14]. Since the level of academic education seems to be related to EBP acknowledgement [58], the lower ability in research in developing countries can be explained by a poor availability of advanced education (e.g. doctorate) or specific EBP-related training. For example, it has been reported that there were few or no postgraduate degree and no doctorate programs in Kuwait [59] and Saudi Arabia [38].
The lack of interest is confirmed as a rarely declared barrier, and this result links to the finding that physiotherapists generally have a positive opinion about EBP [9]. Anyway, the so-called ‘eminence-based therapy’ (i.e. when clinical experience entails established reputations of credibility despite the high risk of bias) [60] seems to be still highly valued in physiotherapy [61], and a possible mismatch between reported attitudes and daily practice should be considered. Education and interest in EBP are strictly related. Undergraduate education is a key occasion to implement and develop methodological skills, attitudes and interest [62].
Lack of generalizability of research results is reported as a frequent barrier in all countries. This issue can effectively be relevant [63] and can explain the underuse in the routine practice of research literature [64, 65]. However, it is the sole issue investigated on limits of EBP, despite other objections to EBP have been reported [66].
High heterogeneity was found for all analyses, despite sub-group analyses, according to the type of country, continent, methodological quality and publication year, not clarifying on the heterogeneity. This result is likely to be expected since studies included in this study differ in cultural, economic and social contexts, as in main characteristics of the included subjects, especially the place of employment, education and professional experience (Table 1). Furthermore, this result could also be due to different physiotherapy education programs and health-care systems across countries. Moreover, the diversity of questionnaires used in the surveys, or aspects of the quality of the studies not captured by the checklist used, could further justify the heterogeneity. Two reviews [67, 68] found 15 and 34 different survey instruments testing EBP knowledge, skills, attitudes and behaviors, and barriers. Additional sources of variability may be related to different operational definitions or diverse subjective perceptions of the respondents. For example, Castellini et al. [49]. reported that 52% of responders stated they understood the meaning of ‘meta-analysis’ term, but only 17% and 38% were able to explain ‘forest plot’ and ‘confidence intervals’ terms, respectively.
Moreover, we found a publication bias in pooled meta-analysis for four out of eight barriers (i.e. time, skills, interest and statistical skills) that could concur with the high heterogeneity. However, in our analyses, we considered the random effect model that accounts for unexplained heterogeneity [69].
The results of our meta-analysis revealed a high heterogeneity across studies that should be considered for future investigations; hence, guidelines and checklists about this type of study should be produced to minimize the heterogeneity for the studies; for example, a consensus on how the questionnaire should be developed should fill the agenda for future researches, as the checklist development for assessing the methodological quality of these types of studies. Finally, our results should be interpreted with caution, providing initial quantitative results on this topic.
Included investigations were assessed to have a low-to-moderate risk of bias. However, response rate is <50% in six investigations [24, 25, 28, 31, 40, 42], and it is not reported in five studies [27, 30, 41, 46, 47]. Literature on non-response bias through mailed surveys shows that non-response bias is a serious concern in survey studies [70] that could affect the interval validity of surveys.
Implications for policy, practice and research
Since barriers to the EBP implementation in the clinical practice are mainly related to organizational and educational factors, university trainings, continuing education providers, health policymakers and health-care companies should further support research educations and activities. Particularly, universities should implement programs to increase the lack of statistical and research skills and courses in scientific English; health-care organizations should contemplate time for EBP (i.e. reading articles and journal clubs) and provide access and support; finally, research should provide evidence with such generalizability that they can be used in clinical practice. Furthermore, research can stimulate a scientific method of approach to problems for the health care, management and organization of clinical services and practices. Indeed, it is well known that a research culture is associated with greater service efficiency and efficacy from clinical and organizational perspectives [71].
Finally, a consensus on structure and core set of areas of investigation should be developed to compare results coming from studies using different survey instruments.
Conclusion
Organizational strategies and methodological skills seem key issues to allow the EBP implementation, although results should be interpreted with caution, considering the low response rate of primary studies and the high heterogeneity. Therefore, our data suggest the need to adopt or enhance organizational and training strategies aimed at providing opportunities and tools to facilitate the EBP implementation. Barriers referred to education seem to be an important EBP obstacle in developing countries. It is necessary to explore effective methods to support the EBP adoption by students and physiotherapists [72], especially in developing countries.
Supplementary material
Supplementary material is available at International Journal for Quality in Health Care online.
Funding
This study was not funded.
Contributorship
M.P. and G.F. were primarily responsible for study conception and design and for data analysis and interpretation. All authors (M.P., G.F., A.U. and L.P.) participated in the phases of the systematic review. M.P. and A.U. analyzed the data. All authors (M.P., G.F., A.U. and L.P.) interpreted the results. M.P. led the writing of the first draft of the manuscript. All authors (M.P., G.F., A.U. and L.P.) contributed to drafting and revising the manuscript. M.P. is the guarantor. All authors (M.P., G.F., A.U. and L.P.) read and approved the final manuscript.
Ethics and other permissions
There were no permissions needed to undertake this work.
Data availability statement
No new data were generated or analyzed in support of this review.
