


Abstract
Exporters, trade lawyers, policy makers, and academics see the WTO's Dispute Settlement Understanding as an important, though costly, venue for facilitating the removal of harmful barriers to trade. If this conventional wisdom holds, then disputes should increase trade. We provide a careful analysis of trade flows in the wake of WTO disputes. We find that WTO disputes do not increase the respondent country's imports of the products at issue. Instead, our analysis shows very narrow effects from disputes. These depend on the dispute outcome and issue area. Although we find variation across countries in their responsiveness to disputes, no single explanation accounts for this variation. Our evidence casts doubt on arguments that dispute settlement promotes trade between members.
International courts occupy a prominent position in global governance. Many believe courts help push through politically difficult outcomes. They note, for example, the central role the European Court of Justice in European integration and the judicialization of investment through the proliferation of bilateral investment treaties. Those championing this position sometimes point to the World Trade Organization (WTO) dispute settlement understanding as a model international court. Various analysts describe it as the “backbone,” 1 the “cornerstone,” 2 and the “centerpiece” 3 of the multilateral trade regime. Moreover, many consider it unusually effective; sovereign nations generally comply with its rulings ( Goldstein et al. 2000 ; Alter 2003 ). Some observers even suggest that the success of the dispute settlement understanding may fill in where multilateral negotiations fall short ( Steinberg 2009 ; Goldstein and Steinberg 2008 ).
The dispute settlement understanding pursues a variety of goals. Among these, it aims to lift restrictive trade barriers found in violation of countries’ commitments to freer trade. In this paper, we ask whether WTO disputes actually increase trade. Specifically, do respondents import more of disputed products after a dispute than before? The belief that litigation promotes liberalization rests on an affirmative answer to this question.
The dispute settlement understanding is the principal tool that member countries use to open trade partners’ unfairly protected markets. As such, an effective dispute settlement understanding ought to lead to less protection of, and increased access to, respondent markets. Moreover, the Most Favored Nation (MFN) principle, which extends into every part of dispute settlement, ensures that concessions offered to one member extend to all others ( Bagwell and Staiger 2004 ). Therefore, policy adjustments made by a respondent country should increase market access for the complainant, as well as all other countries harmed by the offending barrier. Countries sometimes cite the dispute settlement understanding’s trade-liberalizing role as one of the main reasons why they join the WTO ( Cattaneo and Primo Braga 2009 ). Exporting firms also pressure their governments to initiate disputes as a means for liberalizing trade ( Davis 2011 ). Thus, countries and firms behave as if the dispute settlement understanding promotes trade.
There are a variety of ways to measure the dispute settlement understanding’s trade effects. In this article, we focus on net increases in access to respondents’ markets—the net effect of the liberalization that dispute settlement encourages. The most direct approach to this question is a monadic analysis of total imports of disputed products into respondents’ countries from WTO members. If the dispute settlement understanding works to promote liberalization—effectively dismantling entry barriers—then we should observe increases in total import volumes into respondent markets. Our models exploit within-country-product variation to identify whether dispute settlement results in increases in trade volumes.
We utilize imports data at the country-product-year level from 1995 to 2010. Since disputes most often concern highly specific products, we observe imports at the 6-digit Harmonized System (HS) level. In models accounting for unobserved country-product and country-year heterogeneity, we find that the value of the respondent’s imports of disputed products is modestly, but insignificantly, higher after a dispute as compared to the value before the dispute. Disputes increase imports by less than 10 percent; our analysis often fails to reject the null hypothesis that disputes have no effect on imports. These null results are consistent across a non-parametric analysis of import values before and after disputes, models that attempt to detect lagged or delayed effects of disputes, and a variety of other robustness checks.
We also examine several potential sources of heterogeneity in disputes’ effects. We consider whether dispute or respondent characteristics moderate the effects of disputes on trade. These tests evaluate the possibility that certain kinds of trade policies, certain kinds of goods, or particular features of litigant countries shape whether the dispute settlement understanding promotes trade. These models likewise fail to produce discernible patterns. We conclude that dispute settlement does not result in a positive, substantively significant increase in the membership’s access to respondent markets.
Disputes likely have complex effects on trade at the dyadic or firm level. However, we “zoom out” and provide an assessment of the net liberalizing effect of a dispute. Our findings suggest that the occurrence of a dispute does not increase the size of the total trade pie. This does not imply that the dispute settlement understanding has no effect on member welfare. Dispute settlement may help re-allocate each member’s slice of the pie. Or dispute settlement may deter future trade barriers and thus reduce the amount of protection that states enact longer term. However, our analysis demonstrates that, in spite of the central role of the dispute settlement understanding in the WTO’s design—and the large amount of scholarly attention it receives—dispute settlement does not have an aggregate liberalizing effect on trade.
Why Disputes Ought to Increase Trade
Why should we expect disputes to increase trade? The dispute settlement understanding provides a forum wherein one country can legally compel the removal of another country’s trade barriers. Complainant countries first request consultations over a trade partner’s allegedly WTO-noncompliant trade policy. The dispute participants try to negotiate a solution. If they cannot agree, then a panel is established to adjudicate the dispute and issue a binding ruling. If the complainant wins this challenge, the respondent has an obligation to remove the offending trade barrier.
Any concessions granted as a result of this process should affect all members, not just the dispute participants. Article 3.5 of the dispute settlement understanding reads, “all solutions (…) shall be consistent with [the WTO] agreements,” implying that even bilateral deals reached in private consultations must be MFN-compliant, extending any trade concessions to all members. 4 In a legal sense, every dispute is a “class action” in which each member harmed by the respondent’s illegal barriers to trade should benefit from the outcome of litigation. 5 Further, the growing importance of third party status, through which non-litigant member countries may join a dispute’s proceedings, ensures that interested parties can observe and contribute to proceedings at every stage. Therefore, dispute settlement is not a strictly bilateral exercise.
Existing literature highlights several reasons why WTO disputes facilitate compliance. Disputes may provide political cover for respondents to remove trade barriers. They may also raise the respondent’s costs of leaving the barrier in place ( Bagwell and Staiger 2005 ; Bello 1996 ; Bown 2009 ; Busch and Reinhardt 2000 ; Maggi 1999 ; Maggi and Staiger 2011 ). Moreover, countries may concede to legal challenges partly out of the expectation that they may wish to challenge others’ policies in the future. Normative condemnation may also compel compliance.
The WTO literature supports the idea that disputes compel the removal of harmful trade barriers. Davis (2011) argues that domestic firms pressure their government to initiate disputes in order to facilitate greater market access. Legal firms advertise their ability to increase market access by taking down illegal trade barriers. 6 And governments similarly boast that their litigation efforts open up markets and increase trade. 7 These efforts should benefit the membership as a whole, since dispute settlement at the WTO “has public good characteristics” ( Bown and Hoekman 2005 , 862), which might especially benefit countries underrepresented in litigation.
If disputes compel the removal of harmful trade barriers, then respondents ought to import a greater amount of the products at issue after the dispute. Of course, not every dispute succeeds or leads to significant increases in imports. Nor does every country or firm gain from every dispute. Disputes, and any subsequent effects on trade policy, have complex effects on trade flows. However, existing arguments predict that disputes facilitate the removal of harmful trade barriers on average. This implies that aggregate imports of the disputed product into the respondent country should increase.
Several existing studies ask questions related to ours. Bechtel and Sattler (2015) use dyadic data at the sectoral level (SITC 1-digit) and find that, in the three years following a dispute, respondents import approximately $7.7 billion more from complainants and third parties who side with the complainant. This estimate is higher than would be expected since the majority of trade disputes cover trade flows valued at much less than $1 billion.
Bown and Reynolds (2015a) estimate the effect of pre-dispute import volumes and import demand and export supply elasticities on the change in import volumes between the year after the WTO-violating policy and two years after the conclusion of a WTO dispute. In their sample, the mean of the change in logged volumes is 0.12, indicating that complainants imported approximately 12 percent more, by volume, after the conclusion of the dispute, compared to the year after the offending policy was put into place. Bown (2004) assesses GATT/WTO disputes from 1973 to 1998 and finds that the logged change in imports into the respondent from the complainant is only 0.0078. Peritz (2015) assesses the effect of a WTO dispute on the export share of the complainant to the respondent and finds that disputes increase less than half the time.
The crucial difference between these works and ours is that they focus on the dyadic effects of disputes, measuring the relationship between complainants and respondents. As a result, existing work’s main contribution is describing the factors that cause complainants to gain more or less from a dispute. Our approach differs because it looks beyond the complainant. We assess whether disputes increase the membership’s access to respondent markets. Given the multilateral nature of the WTO—a feature embedded in the design of its agreements—our approach reveals whether disputes increases trade on average, not just in the particularistic circumstances of a given dyadic partnership.
Legal Outcome
Disputes’ trade effects may vary as a function of their outcome. There are three ways in which a dispute can be concluded: complainants drop the case; parties reach a “mutually agreed solution;” or the dispute results in a formal ruling.
D ropped Cases . No less than 35 percent of all disputes end as “dropped” cases—disputes in which no formal settlement is notified to the dispute settlement understanding, and no panel is established. Examples include US—Import Prohibition of Certain Shrimp and Shrimp Products (DS61), brought by the Philippines against the United States, or Argentina—Wheat Gluten (DS145), filed in response to countervailing duties the EU placed on Argentine wheat. It is often impossible to ascertain why these cases are abandoned because the litigants provide no formal notification to the WTO. The respondent may dismantle the WTO-illegal policy, rendering formal dispute settlement unnecessary. Or, settlements may go unnotified to allow the parties to reach more cooperative arrangements, away from domestic pressures. Under either condition, dropped cases may lead to an increase in post-filing imports.
There could be other reasons that cases get dropped, which would imply different effects on trade. Complainants may simply lack the legal and/or bureaucratic resources required to take a dispute forward. Complainants may also receive new information during consultations about the relative merits of their case (or about the respondent’s resolve) that could make litigation unfavorable. Under either condition, cases get dropped because the complainant walks away, not because the respondent concedes. If these are the root causes of dropped cases, then we do not expect to observe an increase in trade flows. However, complainants infrequently abandon the process. The significant costs associated with litigation, together with a likely reduction in perceived resolve in subsequent filings, do not support the logic that complainants file disputes from which they walk away empty-handed.
M utually Agreed Solutions. Mutually agreed solutions are slightly less common, occurring in about 20 percent of all merchandise disputes, for example, Japan—Procurement of a Navigation Satellite (DS73), brought by the EC, and Slovakia—Safeguard Measure on Imports of Sugar (DS235), brought by Poland. Mutually agreed solutions refer to cases in which the dispute’s parties settle the issue during consultations, prior to a panel decision. 8
Mutually agreed solutions should increase trade because they signal compromise on the respondent’s part. Settlement should only occur when the complainant secures some gain. Saving the costs of litigation ought to encourage relatively more concessions ( Gilligan, Johns, and Rosendorff 2010 ). Under mutually agreed solutions, the respondent should grant more access to their domestic market and extend any concessions to other countries through MFN, thus leading to increased imports. 9
R ulings. Approximately half of all disputes result in a panel report. Historically, rulings favor complainants, who win at least one legal claim made in virtually every dispute (over 90 percent). This pro-complainant trend is hardly surprising given the cost of disputes, and the selection process it entails. If the dispute settlement understanding affects state behavior, respondents ought to dismantle trade barriers that the panel rules against, leading to greater market access and increased trade.
Admittedly, compliance with dispute rulings varies. Though not common, compliance proceedings were initiated in several situations involving doubt over respondents’ implementation of the panel’s recommendations. Poor compliance may result from non-random selection into the panel stage. Respondents seeing cases through to rulings may be particularly unwilling to compromise on their policies. Specifically, rulings may occur most often in situations in which the respondent is least likely to back down ( Reinhardt 2000 ). If so, rulings may not have a significant impact on trade flows between members.
However, two remarks are in order. First, though it is difficult to measure compliance, existing data show higher than expected implementation rates ( Wilson 2007 ). Second, even if the dispute settlement understanding “lacks teeth,” Kono (2006) argues that the system is effective, but that it operates primarily through reputation in the international system rather than through centralized enforcement. In either case, whether compliance hinges on self-enforcement through a concern over reputation or on the fear of trade retaliation, rulings in the highly legalized trade regime should affect country behavior and thus trade flows.
Issue Areas and Products
Disputes also vary in terms of the policies or products at issue. This variation is important because some policies might be especially politically contentious, and some products might enjoy higher levels of protection. In either case, traits of specific policies/products may affect post-dispute trade.
We isolate three particular areas based on their salience and the frequency with which they are disputed: agriculture, sanitary and phyto-sanitary, and escape clauses. Agriculture is traditionally the WTO’s most politically fraught issue. Developed members’ unwillingness to grant concessions in agriculture has proven a key sticking point in the stagnant Doha Round ( Anderson and Martin 2005 ). Disputes frequently cite agrarian products precisely because governments erect entry barriers that they refuse to dismantle. The high frequency of agriculture disputes reveals their contentious nature; over 100 cases out of the first 400 dealt with agriculture.
Sanitary and phyto-sanitary measures represent another salient portion of WTO trade law. Disputes over these issues are thorny because they touch on sensitive issues such as genetically modified crops and food safety. In these areas, we might expect that the trade effects of dispute settlement are attenuated by the high domestic costs of backing down.
Escape clauses—allowing states to temporarily shirk their obligations—are equally important. Escape clauses include antidumping, countervailing duties, and safeguards. Of the first 400 disputes, 79 related to antidumping and 34 related to safeguards. Since both policies require that domestic industries petition for protection, governments using flexibility provisions face significant domestic opposition to dismantling such barriers. Together, the frequency of flexibility use and its domestic political implications drive persistent debate over escape clauses’ overall welfare effects. 10 Looking at escape clauses also helps us account for the possibility that specific products—for example, the steel industry in the United States—enjoy more robust protection, historically. 11 In practice, all of the 29 steel disputes in our sample are also disputes about the use of escape clauses. 12
We include product fixed effects to account for unobserved product level variation (see below). One additional product-specific concern is that certain goods are more vulnerable to retaliation. Blonigen and Bown (2003) cite steel as illustrative in this context, noting the history of tit-for-tat antidumping imposed between the United States and Canada. Though we cannot test retaliatory effects directly in this paper, our fixed effects help address precisely that kind of product level vulnerability.
Respondent Characteristics
We also explore whether respondents vary in their “responsiveness.” Existing literature identifies respondent country features likely to shape whether dispute settlement affects policy behavior (and subsequent trade flows). For example, countries with greater legal capacity—commonly proxied by wealth ( Busch and Reinhardt (2003) ; Busch, Reinhardt, and Shaffer (2009) ; Guzman and Simmons (2005) )—might be less responsive to disputes. Richer states have more resources available when defending themselves. They may also be better able to extend the dispute process, discouraging potential litigants ( Davis and Shirato 2007 ). As a result, wealthier nations may not liberalize as much in the wake of a dispute.
Economic crises might make countries less responsive to disputes. Crises magnify the pressure to provide import relief to domestic interest groups, and countries in crisis may be less likely to respond to disputes by allowing increased imports. A country’s position in the global market may also matter ( Bown 2004 ). The WTO has no central enforcement mechanism, and it relies on the threat of retaliation to aid enforcement. Complainants may be granted the right to erect retaliatory trade barriers against noncompliant respondents. Therefore, a country’s trade position makes it more or less responsive to disputes, since stronger or weaker positioning could entail more or less sensitivity to retaliation.
Responsiveness may also vary by regime type ( Mansfield, Milner, and Rosendorff 2002 , 2000 ). Democratization is associated with greater attention to broader constituencies and lower tariffs ( Milner and Kubota 2005 ). If disputes mobilize domestic actors to oppose protectionism, this effect should be greater in democracies than it is in autocracies. Finally, a country’s past experience with dispute settlement might also make them less responsive. Gaining experience with the complex legal system helps countries better defend themselves against the charges levied by the complainant.
All of these characteristics may shape respondents’ willingness to dismantle WTO-illegal entry barriers. As a result, traits of the respondent country condition the dispute settlement understanding’s trade effects, a proposition we test directly below.
Data and Models
We collected data on trade in disputed products across all WTO members from the period 1992 to 2010. The data include each member’s imports in all the products that have been named in any WTO dispute. This means, for example, that we include imports in softwood lumber for all members, not just for the litigants in the softwood lumber disputes between Canada and the United States. This produces a complete record of trade in disputed goods. The resulting dataset is rectangular, covering trade in roughly 6,000 distinct products over the period from 1992 to 2010, named in merchandise disputes from DS1 to DS400. It includes one row per member, i , for each disputed product, s , in year, t such that the unit of observation for the data is the country-product-year.
To define the set of products, we started with the 293 merchandise disputes occurring between 1995 and 2010. 13 Our selection of disputes derives from existing data provided by the Horn and Mavroidis “WTO Dispute Settlement Database” 14 as well as Busch and Reinhardt (2003) . We updated these sources to include data through DS400. 15
We collected data on the products named in these disputes at the 6-digit level of the Harmonized System codes, the highest level of disaggregation that allows for concordance across time. The disputes named varied numbers of products, and some name products at a level of aggregation that is greater than HS-6. For disputes naming goods at higher levels of aggregation—for example, DS141 citing HS 52 (“Cotton, including yarns and woven fabrics”)—we use all 6-digit lines under the larger heading. 16 This is appropriate since the complainant names the level of product in the dispute and may name a higher level of aggregation to address a wider array of products.
Dependent Variable
Our dependent variable measures the value of imports into the respondent country of a particular product in that year. Let IM ist be the natural log of the value, in 1996 US dollars, of country i ’s imports of product s in year t from all exporting WTO members. 17 These data are from the World Integrated Trade Solution (WITS) hosted by the World Bank. 18
To examine the effectiveness of disputes, we focus on import values (volume * price) as opposed to a particular measure of policies. Data on disputed policies like tariffs, standards, and domestic regulations are incomplete for the full set of products, countries, and years covered here. Also, governments’ announcements of policy changes are often misleading, since governments may claim to reform their policies even when they have not or may substitute new measures amounting to a similar barrier. Unlike government statements, trade flows do not lie. We thus focus on the de facto effects on trade, rather than the de jure effects on policy.
Explanatory Variables
The primary explanatory variable, Dispute ist , is a dichotomous variable that indicates whether a dispute has been filed against country i over product s in or before year t . In other words, we code Dispute ist as 1 for all country-product-year observations after a dispute has been initiated against country i regarding product s . We code it 0 for years before a dispute is initiated against that country over that product. We also code it 0 if that country has never had a dispute brought against it regarding that product.
Dispute Status
We also construct a measure of dispute “status,” which represents the stage that a dispute has reached in a particular importer-product-year.
No Dispute: No WTO members have yet requested consultations with the importer regarding that product, as of year t.
Dispute Dropped: A WTO member has requested consultations with the importer regarding that product, but the dispute has been dropped.
Mutually Agreed Solution: Consultations have been requested, and both sides have reached a mutually agreed solution.
Panel Ruling: Consultations were requested, a panel was established, and the panel has issued a ruling.
Dispute Ongoing: Consultations were requested, but the dispute has not been dropped nor resulted in a mutually agreed solution nor resulted in a panel.
These categories entail the possible outcomes for an importer-product-year, (and do not overlap). 19 Let status jist be a binary variable indicating the status of the observation, where j ∈ (1,2,3,4,5) correspond to each of the five possible statuses. Of the country-products, 2,004 (11.1 percent) concluded with a dropped dispute. 5,584 (31.0 percent) reached a mutually agreed solution, and 10,437 (57.9 percent) resulted in a panel ruling.
Given our econometric approach, it is relevant to describe the subsample of observations pertaining to country-products that do experience a dispute (excluding all country-products that never experience a dispute). Approximately 121,000 observations pertain to country-products that do experience a dispute. Of these, approximately 35 percent of the observations occur before a dispute; 15 percent occur after a dispute has been dropped; 22 percent occur after a mutually agreed solution; and 17 percent occur after a panel ruling while 11 percent occur while a dispute is ongoing.
In the full country-product-year sample, the majority of observations, 2,121,784 (95 percent), occur before a dispute or for country-products that never experience a dispute. These pertain to products that were disputed at some point in the dataset within other dyads. In the sample, 21,471 (1 percent) observations occur after a dispute has been dropped; 33,526 (1.5 percent) occur after a mutually agreed solution; and 31,377 (1.4 percent) occur after a panel ruling while 18,128 (0.8 percent) observations were coded as belonging to an ongoing dispute.
Dispute Issue Area
The second set of controls describes the issue area of the dispute. We create dichotomous measures of whether the dispute was about one of the two most commonly contested escape clauses in the WTO—antidumping [ AD ] and safeguards [ Safeguards ]. 20 We also code whether the disputed product is an agricultural good [ Agriculture ] or whether the dispute involves sanitary and phyto-sanitary measures [ SPS ]. Litigants cite agriculture, perhaps the single most contentious area in WTO negotiations, the most frequently in disputes (107 cases in our sample).
Country-Year Control Variables
Next, we consider the effects of time-varying characteristics of the respondent. Polity it measures country i ’s regime type using the combined Polity IV scores in year t . We also include per capita income, since richer countries are more likely to conduct more trade and to have higher levels of legal capacity. lnpcgdp it measures the natural log of country i ’s per capita income in year t . To account for domestic political pressure, we include a measure of whether a country experiences an economic crisis in the year under observation, using data from Reinhart and Rogoff (2009) . Crisis it codes the number of crises, across six possible dimensions: banking, currency, domestic default, external default, inflation, and stock market. We also include the number of times a country has been a respondent in a dispute. Respondent it measures the (logged) number of times that country i has been a respondent in a dispute, up to year t − 1.
We refer to these control variables collectively as X it . These variables are not the only country-year characteristics that affect imports. However, we omit additional variables for two reasons. First, many components of typical gravity equations are dyadic (for example, common language), and our analysis is monadic. Second, our preferred specifications include country-year fixed effects to account for unobserved heterogeneity at the country-year level. The effects of other monadic variables that are often included in a gravity specification (for example. exchange rates) are captured by the country-year fixed effects.
We chose these four country-year variables to assess whether they moderate the effects of disputes on imports. We are less concerned with the direct effect of these variables on imports per se. We are interested in the indirect effects of these variables through their influence on responsiveness, for example, whether a dispute against a democracy has more or less of an effect on imports.
All variables are summarized in Table 1 . This table provides summary information for the full sample and then for the subsample for which we have full coverage of the country-year control variables. The table repeats this content for just country-product observations experiencing a dispute at some point during the sample.
Summary statistics
| All Country- Products | Country-Products with Dispute | |||||||||||
|---|---|---|---|---|---|---|---|---|---|---|---|---|
| Full Sample | With Controls | Full Sample | With Controls | |||||||||
| Variable | Mean | S.D. | N | Mean | S.D. | N | Mean | S.D. | N | Mean | S.D. | N |
| Log Imports | 13.45 | 3.13 | 2,228,653 | 13.52 | 3.05 | 1,606,257 | 14.66 | 3.16 | 109,918 | 14.56 | 3.13 | 83,035 |
| Dispute | 0.03 | 0.18 | 2,228,653 | 0.04 | 0.2 | 1,606,257 | 0.69 | 0.46 | 109,918 | 0.81 | 0.4 | 83,035 |
| Polity | 6.86 | 4.28 | 1,606,257 | 8.26 | 2.99 | 83,035 | ||||||
| ln(PC GDP) | 8.32 | 1.16 | 1,606,257 | 9.24 | 1.2 | 83,035 | ||||||
| Respondent | 1.58 | 1.02 | 1,606,257 | 2.52 | 1.09 | 83,035 | ||||||
| Crisis | 0.86 | 1.14 | 1,606,257 | 0.94 | 1.14 | 83,035 | ||||||
Notes : Summary statistics for dependent and explanatory variables. The first six columns summarize the sample for all country-product observations. The second six columns summarize the sample for all country-products that experience at least one dispute.
Analysis
Our analysis proceeds in three parts. First, we establish baseline results for whether disputes increase imports on average. Second, we examine whether the effect on trade varies by dispute characteristics (outcome and issue). Third, we analyze the effect of dispute settlement looking at respondent characteristics, examining which countries are most responsive to disputes.
Note that all of our models include country-product fixed effects to account for unobserved heterogeneity across products and countries. As a result, our tests estimate whether there is an increase in post-dispute trade in specific products, relative to mean levels. This is appropriate for assessing whether disputes lead to an increase in imports after the fact. We account for unobserved country-product heterogeneity because industry or product level features, such as the capital intensity of a good, how prone that good is to protection, or whether it is an intermediate good, could affect disputes and imports. Disputes also target larger product flows, which makes across-product comparisons difficult. Figure 1 shows the values of imports for products that do and do not experience a dispute at any point in our sample. The lines show a locally smoothed polynomial for country-products that do experience a dispute (red) and do not ever experience a dispute (blue), along with the accompanying 95 percent confidence intervals. Disputes tend to occur against larger value country-products. Including country-product fixed effects means that we estimate changes in the import values within a particular country-product series, not variation across country-products. Analyzing variation across products would strongly bias the estimated effect of a dispute upwards because bigger or faster-growing product lines are more likely to be targeted with disputes.
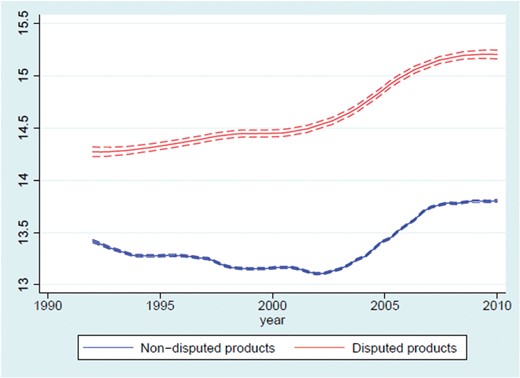
Import values over time, disputed and undisputed products
Notes . Value of log(imports) for country-products that were disputed verses undisputed, with 95percent confidence intervals.
Second, two related issues—the non-randomness of disputes and causality—merit consideration. Countries strategically initiate WTO disputes, so disputes are not initiated at random. Failure to account for this process could lead to biased estimates and incorrect inferences.
Unfortunately, modeling selection into disputes is notoriously difficult, and the literature has yet to identify valid instruments—variables which are strong predictors of dispute initiation but are unrelated to trade outcomes. The closest the current literature comes to addressing the sequence of events prior to disputes is offered by Bown and Reynolds (2015) . However, they do not directly instrument for dispute initiation, but rather for fluctuations in prices and volumes of trade prior to disputes.
Prior knowledge helps us assess the likely direction of bias resulting from this issue. Many of the theoretical stories explaining initiation would actually bias in favor of finding trade effects. For example, if disputes were driven primarily by ex ante dips in trade, then the gap between pre- and post-dispute imports ought to widen. These dips may occur because of an especially restrictive trade policy that leads to more severe dampening of trade. In such cases, we would expect not only a higher likelihood of dispute initiation but also a greater ex post effect on trade flows. The market has a larger recovery to make than it would have if a less restrictive policy had been in place. According to this logic, we would anticipate a larger difference between pre- and post-dispute trade. Therefore, a null finding is especially revealing in this regard.
The occurrence of disputes and their effects on trade are the result of complex strategic interactions, anticipatory and reactionary behavior by governments and firms, and bargaining among principals. We do not model these dynamics. Instead, we answer an inherently important empirical question by describing the effect of disputes on imports, acknowledging that our estimates are affected by these underlying interactions.
Do Disputes Matter? Baseline Results
Both specifications analyze whether disputes are associated with increased imports and include country-product fixed effects. They differ only in how they deal with variation at the country-year level. The first equation controls for potential sources of country-year level heterogeneity with the set of control variables described above (Polity, PC GDP, Respondent, and Crises), X it . The second equation accounts for country-year level heterogeneity with country-year fixed effects. We refer to the second specification, with country-year fixed effects, as our preferred specification since it would be hard to include an exhaustive set of all country-year control variables that affect imports and disputes.
Table 2 presents the results. The first column provides initial support for the argument that disputes increase trade; the coefficient on the binary dispute indicator is positive and significant. The coefficient value of 0.137 indicates that the value of trade flows in years after a dispute is approximately 14 percent higher in years after a dispute compared to years before. The coefficients on the country-year control variables are as expected. Richer countries import more while crises decrease imports. Countries previously targeted with more disputes import less. Regime type has a negligible impact.
Effect of WTO disputes on imports
| Controls | FE | No US-EU | No US-EU | OECD | OECD | nonOECD | nonOECD | NoSteel | NoSteel | |
|---|---|---|---|---|---|---|---|---|---|---|
| (1) | (2) | (3) | (4) | (5) | (6) | (7) | (8) | (9) | (10) | |
| Dispute | .137∗ | .095 | .132 | .132 | −.021 | .065 | .231∗ | .078 | .135∗ | .097 |
| (.076) | (.095) | (.089) | (.116) | (.057) | (.116) | (.119) | (.173) | (.080) | (.101) | |
| Polity | −.012 | −.012 | −.015 | −.012 | −.013 | |||||
| (.009) | (.009) | (.084) | (.008) | (.009) | ||||||
| ln(PC GDP) | 2.847∗∗∗(.421) | 2.859∗∗∗(.411) | 2.567∗∗∗(.494) | 2.957∗∗∗(.465) | 2.793∗∗∗(.406) | |||||
| Respondent | −.185∗∗∗ | −.200∗∗∗ | −.057∗∗∗ | −.236∗∗∗ | −.182∗∗∗ | |||||
| (.037) | (.037) | (.069) | (.031) | (.038) | ||||||
| Crisis | −.039∗∗ | −.042∗∗ | −.031∗ | −.039∗ | −.039∗∗ | |||||
| (.019) | (.019) | (.017) | (.023) | (.019) | ||||||
| Intercept | −9.762∗∗ | 0.000 | −9.741 | 0.000 | −9.267 | 0.000 | −9.770∗∗ | 0.000 | −9.350∗∗ | −0.033∗∗∗ |
| (3.482) | (0.000) | (3.368) | (0.000) | (4.961) | (0.000) | (3.615) | (0.000) | (3.357) | (0.000) | |
| N | 1,606,257 | 2,228,653 | 1,536,050 | 2,087,814 | 467,135 | 630,809 | 1,139,122 | 1,597,844 | 1,508,124 | 2,093,198 |
| No. Products | 129,545 | 149,216 | 124,623 | 139,397 | 34,183 | 39,077 | 99,666 | 143,866 | 121,869 | 140,395 |
| N (w/disp.) | 83,035 | 109,918 | 63,773 | 81,125 | 54,163 | 58,728 | 28,872 | 51,190 | 78,054 | 100,573 |
| No. Prod. (w/disp.) | 5,921 | 6,362 | 4,602 | 4,623 | 3,845 | 4,265 | 2,586 | 5,922 | 5,584 | 5,745 |
Notes: Results from OLS regression of logged import values on dispute status and various fixed effects combinations. Each regression uses robust standard errors clustered at the country level.
However, this initial result is not present in the specification that includes country-year fixed effects. The coefficient on disputes is positive, but it decreases to 0.095 and is not statistically significant, despite the very large sample size. Once controlling for unobserved heterogeneity at the country-year level, disputes are not associated with increased trade.
We also estimate these regressions on several subsamples. In columns 3 and 4, we excluded the United States and the European Union from the analysis. Since those two countries are the most involved in disputes, we wanted to be sure that neither of those litigants drives results. We still get a null result in both models. Columns 5 and 6 estimate the regressions on only OECD countries, and columns 7 and 8 use only non-OECD countries. We again see mainly null results. There is a positive and significant coefficient using country-year controls on the non-OECD sample, but this result is still not present when using country-year fixed effects. Finally, a large proportion of disputes deal with steel products, so columns 9 and 10 exclude observations pertaining to these products. Again, any positive and significant coefficient using country-year controls disappears when using country-year fixed effects.
Disputes may have delayed effects on imports. Disputes take time to reach their final resolution, and even after resolution, it may take time for market actors to readjust their behavior enough to see an increase in imports. To examine this possibility, we perform two additional analyses. First, we re-estimate the first two columns in Table 3 using lagged dispute variables. These regressions detect increases in imports that may be delayed from one to six years. While most of the coefficients on various lagged dispute variables and specifications are positive, they are all statistically insignificant. Even if it takes time for disputes to affect trade, this effect is not apparent six years after initiation.
Effect of lagged WTO disputes on imports
| (1) | (2) | (3) | (4) | (5) | (6) | (7) | (8) | (9) | (10) | (11) | (12) | |
|---|---|---|---|---|---|---|---|---|---|---|---|---|
| Disp. t−1 | .102 | .087 | ||||||||||
| (.080) | (.089) | |||||||||||
| Disp. t−2 | .070 | .088 | ||||||||||
| (.079) | (.077) | |||||||||||
| Disp. t−3 | .031 | .075 | ||||||||||
| (.080) | (.070) | |||||||||||
| Disp. t−4 | .029 | .050 | ||||||||||
| (.086) | (.064) | |||||||||||
| Disp. t−5 | .003 | .018 | ||||||||||
| (.100) | (.060) | |||||||||||
| Disp. t−6 | −.047 | −.015 | ||||||||||
| (.124) | (.057) | |||||||||||
| Polity | −.012 | −.012 | −.012 | −.011 | −.010 | −.008 | ||||||
| (.009) | (.009) | (.009) | (.008) | (.008) | (.008) | |||||||
| ln(PC GDP) | 2.845∗∗∗ | 2.845∗∗∗ | 2.845∗∗∗ | 2.929∗∗∗ | 3.138∗∗∗ | 3.301∗∗∗ | ||||||
| (.421) | (.421) | (.422) | (.414) | (.336) | (.282) | |||||||
| Respondent | −.184∗∗∗ | −.183∗∗∗ | −.182∗∗∗ | −.213∗∗∗ | −.264∗∗∗ | −.284∗∗∗ | ||||||
| (.037) | (.037) | (.037) | (.039) | (.056) | (.071) | |||||||
| Crisis | −.039∗∗ | −.039∗∗ | −.039∗∗ | −.033∗ | −.021 | −.023 | ||||||
| (.019) | (.019) | (.019) | (.020) | (.020) | (.017) | |||||||
| Intercept | −9.752∗∗ | 0.000 | −9.748∗∗ | 0.000 | −9.748∗∗ | 0.000 | −10.386∗∗∗ | 0.000 | −12.064∗∗∗ | 0.000 | −13.400∗∗∗ | 0.000 |
| (3.483) | (0.000) | (3.488) | (0.000) | (3.496) | (0.000) | (3.439) | (0.000) | (2.822) | (0.000) | (2.403) | (0.000) | |
| N | 1,606,257 | 2,155,821 | 1,606,257 | 2,074,688 | 1,606,257 | 1,978,385 | 1,555,644 | 1,877,994 | 1,474,646 | 1,770,796 | 1,368,881 | 1,660,351 |
| No. Products | 129,545 | 149,186 | 129,545 | 149,131 | 129,545 | 149,049 | 129,301 | 148,628 | 129,142 | 148,367 | 128,920 | 148,146 |
| N (w/disp.) | 83,035 | 105,567 | 83,035 | 100,441 | 83,035 | 95,137 | 79,165 | 89,797 | 73,651 | 84,206 | 68,036 | 78,578 |
| No. Prod. (w/disp.) | 5,921 | 6,362 | 5,921 | 6,362 | 5,921 | 6,362 | 5,920 | 6,359 | 5,919 | 6,358 | 5,914 | 6,353 |
Notes: Results from OLS regression of logged import values on dispute status and various fixed effects combinations. Each regression uses robust standard errors clustered at the country level.
Second, non-parametric analysis complements the regression results. Figure 2 shows the distribution of import values for disputed products for the years before and after a dispute. Year zero corresponds to the year that the dispute reached its outcome. The lines are the smoothed values from a local regression of imports on the year value. The top pane examines the ten years before and after a dispute, and the bottom pane zooms in on the five years preceding and following a dispute. If disputes had a positive effect on imports, we would expect to see an increase in import values near or immediately after year zero. Instead, values of disputed products tend to increase steadily in the years preceding and following a dispute, and the dispute itself appears to have no effect on this trend.
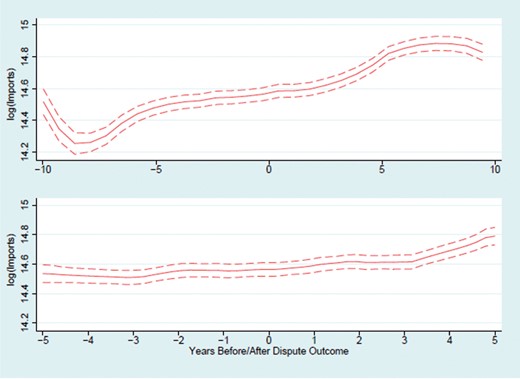
Import values by year before and after dispute conclusion
Notes . Smoothed value of log(imports) for country-products. Top pane is for 10 years prior to and after a dispute’s outcome. The bottom pane is for plus or minus five years. Dashed lines are 95percent confidence intervals.
Nor do the smoothed lines display strong evidence of a delayed effect. There are not strong upward kinks after year zero. The slope of the line increases slightly in the 4th and 5th years after a dispute, but not strongly enough to be detected in the lagged dispute variable regressions. Our appendix includes a related test, which takes into account trends in imports prior to disputes. We do not see sharp increases in imports prior to disputes, which would have implied that the market adjusted before litigation.
Does Dispute Outcome Matter?
Table 4 shows the results from a regression of import values on our status indicators. As in Table 1 , the first column includes country-year control variables, and the second column includes country-year fixed effects. Only dropped disputes are associated with increases in imports. In both specifications, years after a dropped dispute experience approximately 25 percent higher import values, and this result is statistically significant. The results are consistent with the argument that complainants drop their claims because respondents have dismantled their offending entry barrier and allowed greater access to the market.
Effect of WTO disputes on imports, by dispute status
| Ctrls | FE | No US-EU | No US-EU | OECD | OECD | nonOECD | nonOECD | NoSteel | NoSteel | |
|---|---|---|---|---|---|---|---|---|---|---|
| (1) | (2) | (3) | (4) | (5) | (6) | (7) | (8) | (9) | (10) | |
| Dropped | .251∗∗ | .271∗∗∗ | .230∗∗ | .244∗∗ | .220∗∗∗ | .268∗∗∗ | .287∗∗ | .197 | .226∗∗ | .244∗∗ |
| (.098) | (.098) | (.110) | (.123) | (.075) | (.089) | (.139) | (.184) | (.105) | (.120) | |
| MAS | .054 | −.022 | .029 | .045 | −.084 | −.073 | .116 | −.035 | .062 | −.010 |
| (.128) | (.132) | (.166) | (.205) | (.077) | (.064) | (.258) | (.320) | (.126) | (.133) | |
| Panel | .141 | .074 | .135 | .112 | −.053 | .075 | .385∗∗∗ | .143∗ | .155 | .107 |
| (.107) | (.133) | (.128) | (.163) | (.097) | (.182) | (.118) | (.084) | (.123) | (.146) | |
| Ongoing | .123∗ | .074 | .125∗ | .114 | −.027 | .125 | .186∗ | −.016 | .137∗ | .089 |
| (.067) | (.098) | (.071) | (.118) | (.048) | (.133) | (.100) | (.126) | (.070) | (.102) | |
| Polity | −.012 | −.012 | −.016 | −.012 | −.013 | |||||
| (.009) | (.009) | (.084) | (.008) | (.009) | ||||||
| ln(PC GDP) | 2.844∗∗∗ | 2.857∗∗∗ | 2.566∗∗∗ | 2.952∗∗∗ | 2.790∗∗∗ | |||||
| (.420) | (.411) | (.495) | (.464) | (.405) | ||||||
| Respondent | −.184∗∗∗ | −.199∗∗∗ | −.055 | −.234∗∗∗ | −.180∗∗∗ | |||||
| (.037) | (.037) | (.069) | (.031) | (.038) | ||||||
| Crisis | −.039∗∗ | −.042∗∗ | −.031∗ | −.039∗ | −.039∗∗ | |||||
| (.019) | (.019) | (.017) | (.023) | (.019) | ||||||
| Intercept | −9.742∗∗ | 0.000 | −9.724∗∗∗ | 0.000 | −9.257 | 0.000 | −9.739∗∗ | 0.000 | −9.329∗∗ | −0.032∗∗∗ |
| (3.480) | (0.000) | (3.368) | (0.000) | (4.964) | (0.000) | (3.610) | (0.000) | (3.357) | (0.000) | |
| N | 1,606,257 | 2,228,653 | 1,536,050 | 2,087,814 | 467,135 | 630,809 | 1,139,122 | 1,597,844 | 1,508,124 | 2,093,198 |
| No. Products | 129,545 | 149,216 | 124,643 | 139,397 | 34,183 | 39,077 | 99,666 | 143,866 | 121,869 | 140,395 |
| N (w/disp.) | 83,035 | 109,981 | 63,773 | 81,125 | 54,163 | 58,728 | 28,872 | 51,190 | 78,054 | 100,573 |
| No. Prod. (w/disp.) | 5,921 | 6,362 | 4,602 | 4,623 | 3,845 | 4,265 | 2,586 | 5,922 | 5,584 | 5,745 |
Notes: Results from OLS regression of logged import values on dispute status. The omitted category is status 0, meaning years before a dispute has been initiated. Each regression uses robust standard errors clustered at the country level.
Disputes reaching the panel stage and those ending in mutually agreed solution are not associated with significant import increases. Of course, harder litigant resolve and/or difficult legal issues shape whether a dispute goes to panel. Thus, disputes that reach the panel stage may be the least likely to increase trade. The null finding for mutually agreed solutions is more surprising, given that mutually agreed solutions signal compromise. However, there may also be good reason for this null result. If the two parties negotiate a narrowly tailored settlement, especially one that only benefits the complainants, possibly even at the expense of parties not in the room, 21 then we might not expect to see large increases in trade. The dispute settlement understanding’s rules proscribe settlements that disproportionately favor the parties in the room, but this rule is difficult to enforce. Either way, early settlement does not lead to significant increases in trade for the membership at large. 22
These same results obtain when using the subsamples examined above, excluding US/EU, OECD only, non-OECD only, and excluding steel. Withdrawn cases are associated with significant increases in trade in all but one subsample and specification (non-OECD only, with country-year fixed effects). Disputes ending in mutually agreed solution are not associated with increased trade in any of the models. Panel rulings have a positive, significant coefficient only when looking at non-OECD countries. The slightly positive results for ongoing disputes become weaker when looking across subsamples, with the coefficient even turning negative in two specifications.
Nonparametric analysis again comports with the regression results. Figure 3 shows the smoothed values of trade, before and after a dispute ends, broken down by whether the dispute ended in withdrawal, a mutually agreed solution, or a panel. 23 The blue lines, corresponding to withdrawn disputes, show how imports increase after these disputes, though these increases began prior to the conclusion of the dispute. The green lines, corresponding to disputes that reached the panel stage, show modest and more gradual increases in import values. The red lines, corresponding to mutually agreed solutions, show virtually no increases in trade in the years preceding or following the conclusion of these disputes.
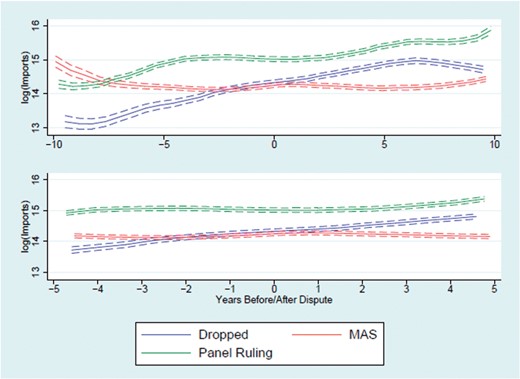
Import values by year before and after dispute conclusion, for dropped, mutually agreed solutions, and panel ruling disputes
Notes . Smoothed value of log(imports) for country-products. Top pane is for 10 years prior to and after a dispute’s outcome. The bottom pane is for plus or minus five years. Dashed lines are 95percent confidence intervals.
Does Issue Area Matter?
We now explore whether the efficacy of disputes is conditioned by the content of the case. We re- estimate the models in equation 1 with indicators for each of the issue areas described above (see Table 5 ). Once again, we include country-year controls and country-year fixed effects, in columns 1 and 2, respectively.
Effect of WTO disputes on imports, by dispute issue areas
| (1) | (2) | |
|---|---|---|
| Dispute | .130 | .078 |
| (.088) | (.130) | |
| AD | −.130 | −.251∗∗ |
| (.117) | (.112) | |
| Safeguards | .140∗∗ | .286∗∗∗ |
| (.056) | (.060) | |
| Agriculture | .092 | .018 |
| (.081) | (.111) | |
| SPS | −.275 | .020 |
| (.174) | (.185) | |
| Polity | −.012 | |
| (.009) | ||
| lnpcgdp | 2.848∗∗∗ | |
| (.421) | ||
| Respondent | −.185∗∗∗ | |
| (.038) | ||
| Crisis | −.039∗∗ | |
| (.019) | ||
| Intercept | −9.772∗∗∗ | 0.000 |
| (3.483) | (0.000) | |
| Country-prod. FE | Yes | Yes |
| Country-year FE | No | Yes |
| N | 1,606,257 | 2,228,653 |
| No. Products | 129,545 | 149,216 |
| N (w/disp.) | 83,035 | 109,981 |
| No. Prod. (w/disp.) | 5,921 | 6,362 |
Notes: Results from OLS regression of logged import values on dispute status. Each regression uses robust standard errors clustered at the country level.
Disputes increase imports more for some issue areas than for others. The issue area coefficients in this table can be interpreted as the effect a dispute in a particular area has relative to other kinds of disputes. To get the total effect of, for example, a safeguards dispute, the coefficients on safeguards and the dispute variable can be added. In both specifications, safeguards disputes are associated with a positive and significant increase in post-dispute imports. On the other hand, antidumping disputes have, at best, a negligible effect on imports. In the second model, antidumping disputes are associated with an approximate 18 percent decrease in imports. 24 This result in particular is surprising and discouraging, since antidumping disputes constitute a significant portion of the dispute settlement understanding’s caseload.
There is no significant result for agriculture disputes, which represent a plurality of cases in our sample (nearly one-quarter of the dispute settlement understanding caseload). Of course, the failure of disputes to result in increased liberalization may itself explain why agricultural products continue to be targeted. Either way, given the politically contentious nature of the agricultural sector, the null result here casts doubt on dispute settlement’s ability to encourage liberalization. The dispute settlement understanding does not appear to promote trade in cases involving some of the most salient and heavily relied on non-tariff barriers.
The empirical appendix demonstrates the robustness of these results. We estimated our models using the year that disputes concluded, rather than began, to ensure that the years a dispute was ongoing did not bias our results for the effect of a dispute on imports downward. We also restricted our sample in several ways. First, we looked separately at disputes ending before the years 2000, 2002, and 2005 in order to make sure our results were not driven by country-products with too few post-dispute observations. We also restricted the sample by the number of products covered by the dispute so that disputes targeting larger or smaller numbers of goods were not driving results. We then reestimated our models looking only at disputes that involved import measures, excluding (approximately 20) disputes over export-promoting policies.
Finally, we explored different windows of time prior to disputes. These tests help confirm that the estimates were not an artifact of the reference period. All of these robustness checks produced estimates consistent with those reported here. Under no conditions are disputes robustly associated with a significant increase in trade.
Does the Respondent Matter?
Next, we analyze whether responsiveness varies by country. If members vary systematically in their willingness to concede, this could obscure any net positive effects on trade. We show that who one sues matters at least as much as what one sues over and the outcome of the dispute.
This model allows us to estimate a country-specific component of the coefficient on our dispute indicator variable, u 1i . This model also affords a great deal of flexibility since we can estimate a country-product-specific intercept, u 2is , and a country-year-specific intercept, u 3it , similar to the fixed effects models estimated in the previous sections.
Figure 4 plots the country-specific dispute coefficient, u 1i estimated from the model. 25 The results are striking for two reasons. First, countries vary significantly in their responsiveness to disputes. On the one hand, countries like Guatemala are very responsive, with an estimated dispute coefficient of over 0.5. On the other hand, disputes against some countries have actually been associated with decreased trade flows. For example, the estimated dispute coefficients for Trinidad & Tobago and Argentina are approximately −0.55 and −0.40, respectively. The second striking feature of the result is that a large number of country coefficients are clustered around zero, meaning these countries have largely been unresponsive to disputes: 11 of the 31 countries have dispute coefficients that are between −0.15 and 0.15, further supporting our baseline finding that disputes fail to promote trade in a consistent manner.
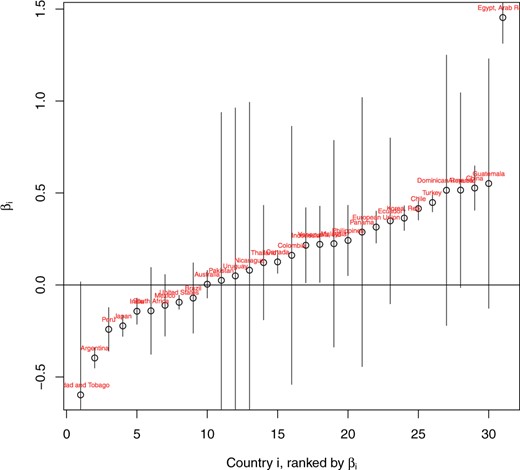
Country specific effects of WTO disputes
Notes . The vertical axis shows the estimated country-specific dispute coefficient and the 95percent confidence intervals around that estimate. Horizontal axis shows the country’s rank, in terms of their estimated responsiveness coefficient.
What Explains Responsiveness?
Given significant variation in countries’ responsiveness, we now ask: what factors drive the differences in responsiveness across members? We focus on country-year characteristics likely to increase or decrease a country’s responsiveness. For consistency, we use the set of country-year control variables described in previous sections. Each—regime type, income, previous experience, and economic crisis—can be reasonably expected to condition a state’s likelihood of granting market access as a result of a dispute.
The key feature of this model is that it allows for the coefficient on the dispute indicator, β it , to be influenced by country-year characteristics. Looking at the second line of the model, b 1 -b 4 describe whether each of the four moderating variables increases or decreases a country’s responsiveness to disputes. If b is positive, for a moderator, then an increase in that variable makes a country more responsive to a dispute, and vice versa. The third and fourth lines describe country-product and country-year random effects.
Table 6 presents the results. The top part of the table shows how each of the four country-year variables moderates the effect of a dispute. Contrary to theoretical expectations, democracy is associated with decreased responsiveness. If disputes are thought to mobilize broader, generally pro-free-trade constituencies, then we would have expected democratic countries, which are ostensibly more sensitive to those broader constituencies, to be more responsive to trade disputes. However, we have stressed that WTO-illegal entry barriers are a direct result of (at least some portion of) audiences demanding such violations. In this case, democratic audiences may punish their governments for backing down and exposing the domestic marketplace to costly foreign competition.
Multilevel model of effect of WTO disputes on imports
| Moderators ( b ’s) | ||
|---|---|---|
| Dispute ( b0 ) | 0.786*** | |
| (0.197) | ||
| Polity | −0.041*** | |
| (0.007) | ||
| ln (PC GDP) | −0.031 | |
| (0.026) | ||
| Respondent | −0.036 | |
| (0.036) | ||
| Crisis | −0.063** | |
| (0.021) | ||
| Intercept ( β0 ) | 6.916*** | |
| (0.429) | ||
| N | 1, 617, 716 | |
| Country-products | 129, 642 | |
| Country-years | 374 | |
Countries suffering from more economic and financial crises are less responsive to disputes. The negative coefficient is consistent with the theoretical expectation that countries protect their markets more vehemently during crises. The crisis may make them more resistant to remove protectionist barriers or more likely to simply replace those barriers with new protections, even when facing a WTO dispute. Governments may also be less willing to comply with international law—here, adverse dispute rulings—when their domestic economic performance suffers. These findings are worth additional research; they suggest that crises weaken the strength of international trade law.
Consistent with theoretical expectations, richer countries and those that have been more frequently targeted with past disputes are less responsive to disputes. For example, countries with larger markets can more easily absorb the costs of dispute settlement, and they are also less vulnerable to retaliation ( Blonigen and Bown 2003 ). In addition, countries that have been frequent past respondents are also likely to be serial protectionists, and they can potentially use their past experience to better defend themselves legally. However, neither has a statistically significant moderating effect. The estimates also show that countries in crisis are significantly less responsive.
Conclusion
The WTO is one of international law’s success stories. At its center stands the dispute settlement understanding, with a large caseload, rich jurisprudence, and a seemingly strong compliance record. As Richard Steinberg (2009) writes of the ill-fated Doha Round: “Negotiations may be dead but dispute settlement is very much alive and empowered.” In the face of such high expectations, we present a striking finding: WTO disputes exercise, at best, an inconsistent effect on the imports at issue. Disputes are not associated with a statistically significant increase in imports of the disputed products, on average. Evidence shows variation in trade effects across issue area and respondent country. However, we find no systematic explanation for this variation and the average effect is not significantly positive. This result runs contrary to an extensive literature that takes the dispute settlement understanding’s effect on trade for granted.
We see three possible conclusions, the first two of which are pessimistic. First, perhaps disputes do not, on average, have a net liberalizing effect for either the litigants involved or for other countries. This would be true if (a) disputes simply fail to remove harmful trade barriers or (b) respondents replace one barrier with another, giving credence to Bhagwati’s “law of constant protection.” Second, disputes may have positive effects at the dyadic level, with disputes mainly benefitting complainants and third parties rather than the entire membership. However, our analysis suggests that, if these gains exist, they are being offset by losses to non-litigants. Recent evidence from Kucik and Pelc (2015) hints at such discriminatory outcomes in the case of early private settlements—perhaps their occurrence constitutes a broader phenomenon.
Third, and more optimistically, disputes may produce positive effects distinctive from increased trade. For example, disputes may lead to efficiency gains through the reallocation of production and exports. Perhaps countries shift their production and trade more in line with comparative advantage once a dispute strikes down policies that insulated less competitive firms from market forces. Disputes may also deter countries from implementing similar trade barriers in the future, either by clarifying the meaning of the rules or by making subsequent threats of litigation more credible. The costs of dispute settlement may be sufficiently high for countries to avoid subsequent challenges. If so, this kind of deterrence could lead to progressively freer trade among members. Another possibility is that disputes open markets up to a wider diversity of partner countries or firms, without necessarily affecting total flows: WTO disputes may not increase the intensive margins in a disputed product, but they may increase the extensive margin.
All of these possibilities deserve future research, yet they require a different research design from the one pursued in this article. Testing these related questions requires dyadic data on all products traded among WTO members. This would allow researchers to look for instances in which trade flows shifted across members (suggesting efficiency gains), or for changes in the number or identity of countries accessing a respondent market (suggesting increases at the extensive margin). A careful look at the partner-specific effects of dispute settlement would help assess the potential explanations for the overall null results found here.
Although such alternative mechanisms might indeed be at work, most scholars have long assumed that countries file disputes to obtain market access for domestic industries, and that under MFN rules, the respondent extends concessions to the remainder of the membership. In this way, other countries may free-ride on the litigation efforts of (typically wealthier) states. Our findings do not offer strong support for this view. More work remains to be done to uncover the conditions under which disputes result in net increases of trade.
Authors’ note: We would like to acknowledge the valuable advice we received from Chad Bown, Christina Davis, Jude Hays, Raymond Hicks, Tobias Hoffman, Soo Yeon Kim, and Peter Rosendorff, as well as audiences at 2013 Annual Meeting of the American Political Science Association. We would also like to thank the manuscript's anonymous reviewers and the editorial staff for their guidance.
1 The former Director General of the WTO, Mike Moore, called the dispute settlement understanding the “backbone of the multilateral trading system” ( Busch and Reinhardt 2000) .
2 See Trachtman (1999) .
3 See Lichtenbaum (1997) .
4 For an examination of how WTO rules seek to prevent “bilateral opportunism” in multilateral negotiations and dispute settlement, see Bagwell and Staiger (2004) .
5 It is for this reason that scholars argue poorer countries are able to free-ride on liberalizing dispute settlement activity by more developed countries ( Bown 2009 , 2005).
6 From an illustrative statement by the trade law firm Cassidy Levy Kent: “[We] advise companies, groups of companies, and governments on means to secure market access through the dispute settlement process under the WTO.” From company homepage, Last accessed on July 4th, 2014: http://www.cassidylevy.com/practice-areas/wto
7 As a representative statement, see the USTR press release about its challenge of China’s Treatment of US Suppliers of Electronic Payment Services: “Removal of the monopoly that China has provided to China UnionPay would create significantly expanded business opportunities in China’s huge and growing market.” “US Requests WTO Panels to Rule on Two Disputes with China.” Feb 18, 2011. International Center for Trade and Sustainable Development - Bridges 15(5). http://www.ictsd.org/bridges-news/bridges/news/us-requests-wto-panels-to-rule-on-two-disputes-with-china (last accessed on March 10, 2016).
8 We count disputes as ending in a mutually agreed solution if they were settled prior to the formation of a panel. Some official notifications of mutually agreed solutions to the dispute settlement understanding refer to cases about which there were protracted compliance proceedings in the wake of a failed appeals process. Cases of that type, such as DS103, are coded as cases where a ruling occurred.
9 In some cases, a settlement may result in compensation in some form other than lowered trade barriers. The US— Cotton case, filed by Brazil, may be the most salient such example. However, in this case, as in others, compensation is seen as an interim measure. The dispute remains on the agenda of the dispute settlement understanding. Compensation is formally seen as a temporary measure, awaiting the conclusion of the US Farm Bill. The expectation on the part of Brazil is that eventually the dispute will yield abatement of US cotton subsidies and thus more access into the US market.
10 See criticisms from Prusa (2001) and Bown and Crowley (2007) .
11Jensen (2007) and Liebman and Tomlin (2007) show that steel producers’ welfare is affected directly by disputes.
12 In additional tests, we omit steel from the sample. It is the second most frequently cited industry in disputes DS1-DS400, being targeted more than other high profile industries such as textiles (23) or automobiles (18).
13 Only 293 of the first 400 WTO disputes relate to specific merchandise. The remaining disputes are related to domestic trade regulation and practices, such as the United States’ use of ‘zeroing’ in the calculation of dumping margins.
14 Hosted by the World Bank and available at http://go.worldbank.org/X5EZPHXJY0 last accessed June 6, 2015.
15 Our dataset is comparable in coverage to new data used by Bown and Reynolds (2015a ; 2015b ), who have 299 disputes over the same period.
16 This coding decision does not affect results. Results obtain when limiting the sample only to disputes which named products at the 6-digit level, as in the appendix.
17 There are no zero-valued amounts of trade. The analysis concerns products involved in a dispute, so there is at least some amount of trade in that product for every product in the analysis.
18 http://wits.worldbank.org/ last accessed June 6, 2015.
19 There are interesting subsets to each status, for example, whether a panel and an appeals panel have been established. Here we focus on the most prominent outcomes, reflecting the various stages through which disputes may generally progress.
20 In practice, antidumping is used ten times more frequently than safeguards but leads to just over twice as many contestations. In other words, safeguards are contested relatively more frequently.
21 While most such settlements are by construction most likely to be unobservable, we have enough anecdotal evidence to warrant concern. Consider a dispute brought by Korea against Japanese restrictions on seaweed imports, Japan—Quotas on Laver, where Japan effectively allocated its entire quota of dried and seasoned laver imports exclusively to South Korea. As the settlement read: “An annual import quota will be allocated exclusively for Korean Laver Products.” WT/DS323/5. Observers denounced this agreement as discriminating against other members to the benefit of the parties in the room ( Nakagawa 2007) .
22 Note that the coefficients for the control variables are identical to the previous table. This is because the status variables simply break down the dispute variable into particular components. These regressions do not introduce any new variation that is correlated with the control variables.
23 This figure uses the same techniques from Figure 2.
24 Adding the dispute and AD coefficients, −0.251 + 0.078.
25 The multilevel models were estimated with the lme4 package in R ( Bates et al. 2014 ).
References
