


Abstract
Cobicistat and ritonavir have different inhibitory profiles for drug transporters that could impact the distribution of co-administered drugs. We compared darunavir concentrations in CSF when boosted by cobicistat versus ritonavir relative to plasma concentrations and with WT HIV-1 IC50 and IC90.
An open, single-arm, sequential clinical trial (NCT02503462) where paired CSF and blood samples were taken from seven HIV-infected patients presenting with HIV-associated neurocognitive disorders (HAND) and treated with a darunavir/ritonavir (800/100 mg) once-daily regimen. Ritonavir was subsequently replaced by cobicistat and paired CSF and blood samples were obtained from the same patients after treatment with the darunavir/cobicistat (800/150 mg) once-daily regimen. Darunavir concentrations at the end of the dosing interval were quantified by LC-MS/MS.
The median (IQR) darunavir concentrations in CSF with ritonavir and cobicistat boosting were 16.4 ng/mL (8.6–20.3) and 15.9 ng/mL (6.7–31.6), respectively (P = 0.58). The median (IQR) darunavir CSF:plasma ratios with ritonavir and cobicistat boosting were 0.007 (0.006–0.012) and 0.011 (0.007–0.015), respectively (P = 0.16). Darunavir concentrations in CSF exceeded the darunavir IC50 and IC90 by a median of 9.2- and 6.7-fold with ritonavir boosting, and by 8.9- and 6.5-fold with cobicistat boosting, respectively. All patients had darunavir CSF concentrations above the target inhibitory concentrations and remained virologically suppressed in the CSF and plasma.
This small study shows that cobicistat and ritonavir give comparable effective darunavir concentrations in CSF, thus suggesting that these boosters can be used interchangeably in once-daily darunavir regimens.
Introduction
Over the past decade, boosting of darunavir has been performed exclusively with low doses of ritonavir. Cobicistat, a structural analogue of ritonavir with an equally potent inhibitory effect on cytochrome P450 (CYP) 3A, albeit devoid of antiviral activity, has recently emerged as an alternative pharmacokinetic enhancer.1 Boosting with cobicistat 150 mg once daily has indeed been shown to produce bioequivalent systemic exposure to darunavir (800 mg once daily) compared with boosting with ritonavir 100 mg once daily.2 Although cobicistat and ritonavir inhibit CYP3A with a similar potency, cobicistat is a more specific inhibitor of CYPs and, unlike ritonavir, has no inducing properties, leading to different drug–drug interaction profiles.3 Another striking difference lies in their inhibitory effects on drug transporters with, for instance, cobicistat being a weaker inhibitor of the efflux drug transporters P-glycoprotein (P-gp) and breast cancer resistance protein (BCRP).3,4 As these transporters are expressed at the blood–brain barrier (BBB), where they limit the entry of PIs into the brain,5 differences in the degree of inhibition may have an impact on the amount of darunavir that can cross the BBB. Interestingly, we demonstrated experimentally that darunavir efflux by P-gp was reduced in the presence of increasing concentrations of ritonavir, suggesting a dose-dependent inhibition of transporter efflux activity.6 Consistent with our finding is the observation that patients treated with darunavir/ritonavir (800/100 mg) once daily have lower darunavir concentrations in CSF and lower CSF:plasma concentration ratios compared with treatment with darunavir/ritonavir (600/100 mg) twice daily.7
Based on these considerations, we hypothesized that a weaker inhibition of P-gp and BCRP by cobicistat at the BBB could result in less darunavir entering the brain when boosted by cobicistat compared with ritonavir. Such a difference could be critical in patients with HIV-associated neurocognitive disorders (HAND) or for the prevention of HAND as sufficient drug levels are required to efficiently inhibit HIV replication inside the brain.
The objective of this study was to compare, in the same patients, darunavir concentrations in CSF when boosted with cobicistat versus ritonavir and determine whether the levels remain above the established darunavir target concentration inhibiting WT HIV-1 virus replication by 50% (IC50) and 90% (IC90).
Patients and methods
HIV-infected adults were eligible if they presented with HAND requiring a lumbar puncture for clinical reasons and if they were treated or qualified for a regimen based on darunavir/ritonavir (800/100 mg once daily). Exclusion criteria were: any medical condition that might disrupt the BBB; co-medications inducing/inhibiting P-gp, BCRP and/or CYP3A4; and non-adherence to treatment. We conducted an open, single-arm, sequential study where eligible participants were treated with a regimen based on darunavir/ritonavir once daily for at least 1 month prior to collecting paired CSF and blood samples (study period 1). Afterwards, ritonavir (100 mg) was replaced by cobicistat (150 mg) and the regimen based on darunavir/cobicistat once daily was given for 1 month prior to the second lumbar puncture and corresponding blood sampling (study period 2). In order to compare darunavir levels in the CSF as well as the CSF:plasma ratios between study periods, paired samples were systematically collected towards the end of the dosing interval and sampling time intervals between study periods were maintained as close as possible for the same patient.
Physical examination, routine haematology and clinical chemistry laboratory parameters, and quantification of HIV RNA in the plasma and CSF were performed during each study period. Furthermore, the CSF:serum albumin concentration ratio was assessed as a measure of the integrity of BBB; the limits of normal were defined based on published data.8 In addition, glucose, lactate and cells were measured in the CSF samples to exclude the presence of a clinical condition which may disrupt the BBB. Finally, data on each patient’s self-reported adherence and treatment-related side effects were collected during each study period.
Plasma levels were quantified by LC-MS/MS using an adaptation of a previously published method by the same analytical laboratory [lower limits of quantification (LLQs): darunavir 25 ng/mL; ritonavir 5 ng/mL; cobicistat 4 ng/mL].9 The LC-MS/MS method for the measurement of CSF samples was calibrated using matrix-matched samples prepared in artificial CSF as previously reported (LLQs: darunavir 0.5 ng/mL; ritonavir 0.5 ng/mL; cobicistat 0.5 ng/mL).10
Darunavir concentrations in CSF were compared with the protein-free IC50 (1.78 ng/mL) and IC90 (2.43 ng/mL) for WT HIV-1.11
The Wilcoxon signed rank test was used to compare darunavir CSF concentrations and CSF:plasma ratios between study periods. Data are presented as median and IQR.
Ethics
All participants gave their written informed consent before enrolment and the clinical trial was approved by the Ethics Committee of northwest/central Switzerland (EKNZ -2015-181). This trial has been registered at ClinicalTrials.gov under the registration number: NCT02503462.
Results
All seven patients included in the study completed the trial. The enrolled patients presented either an asymptomatic neurocognitive impairment (ANI) (e.g. the presence of neuropsychological impairment in at least two ability domains with no decreased daily functioning) or a mild neurocognitive disorder (MND) (e.g. the presence of neuropsychological impairment in at least two ability domains together with mild-to-moderate interference with daily functioning). The patients received darunavir/ritonavir together with an NRTI backbone with the exception of one patient who had darunavir/ritonavir as monotherapy due to a reduced renal function and the presence of the HLA-B*5701 allele limiting the use of NRTIs. The median (IQR) time on darunavir/ritonavir was 40 (24–49) months. None of the patients had interfering co-medications. The CSF:serum albumin concentration ratios were within the limits of normal for all patients and the examination of the CSF samples was unremarkable, thus excluding any factor impacting darunavir penetration in the brain (Table 1).
Patient demographics, treatment characteristics and darunavir concentrations in CSF and plasma by study period
| DRV concentration (ng/mL) with different boosters | ||||||||||||
|---|---|---|---|---|---|---|---|---|---|---|---|---|
| CSF | plasma | VL (copies/mL) | ||||||||||
| Patient | Sex | Age (years) | Ethnicity | BMI (kg/m2) | ARV treatment | RTV | COB | RTV | COB | CD4 (cells/mm3) | plasma | CSF |
| 1 | F | 48 | Caucasian | 20.9 | DRV/r+3TC+ABC | 23.4 | 20.5 | 1971 | 1111 | 802 | <20 | <20 |
| 2 | M | 64 | Caucasian | 22.9 | DRV/r | 8.6 | 9.2 | 1313 | 1275 | 640 | <20 | <20 |
| 3 | M | 60 | Caucasian | 30.0 | DRV/r+TDF+FTC | 16.4 | 15.9 | 2491 | 5403 | 690 | <20 | <20 |
| 4 | M | 54 | Caucasian | 24.2 | DRV/r+TDF+FTC | 11.2 | 6.7 | 1761 | 431 | 775 | <20 | <20 |
| 5 | F | 31 | African | 19.5 | DRV/r+TDF+FTC | 4.3 | 5.2 | 1614 | 657 | 870 | <20 | <20 |
| 6 | M | 66 | Caucasian | 26.0 | DRV/r+TDF+FTC | 17.9 | 31.6 | 2473 | 2322 | 344 | <20 | <20 |
| 7 | M | 55 | Asian | 20.2 | DRV/r+3TC+ABC | 20.3 | 37 | 1618 | 3240 | 1098 | <20 | <20 |
ABC, abacavir; COB, cobicistat; DRV, darunavir; FTC, emtricitabine; TDF, tenofovir disoproxil fumarate; 3TC, lamivudine; RTV, ritonavir.
The post-dose sampling intervals were comparable between study periods with a mean (SD) sampling time interval of 22 ± 3.5 h and 21 ± 4 h for the study periods 1 and 2, respectively. In addition, the post-dose sampling time intervals between study periods were for the same patient mostly 30–90 min apart.
Darunavir was detected in all CSF samples with median (IQR) concentrations of 16.4 (8.6–20.3) ng/mL with ritonavir boosting and 15.9 (6.7–31.6) ng/mL with cobicistat boosting (P = 0.58). The corresponding median (IQR) darunavir concentrations in the plasma were 1761 (1614–2473) ng/mL and 1275 (657–3240) ng/mL with ritonavir and cobicistat boosting, respectively (P = 0.94) (Figure 1). The inter-individual variability in darunavir concentrations (percentage coefficient of variation) was lower for ritonavir versus cobicistat boosting for both CSF (82% versus 114%) and plasma (27% versus 144%). Notably, the corresponding median (IQR) concentrations of the boosters in the CSF and plasma were 0.5 (0.3–0.9) and 74 (48–154) ng/mL for ritonavir and 2.6 (0.45–8.8) and 136 (6.1–383) ng/mL for cobicistat, respectively. The median (IQR) darunavir CSF:plasma ratios were 0.007 (0.006–0.012) and 0.011 (0.007–0.015) with ritonavir and cobicistat boosting, respectively (P = 0.16). All darunavir CSF concentrations exceeded the darunavir IC50 and IC90 by a median of 9.2- and 6.7-fold with ritonavir boosting and by 8.9- and 6.5-fold with cobicistat boosting, respectively (Figure 1a).
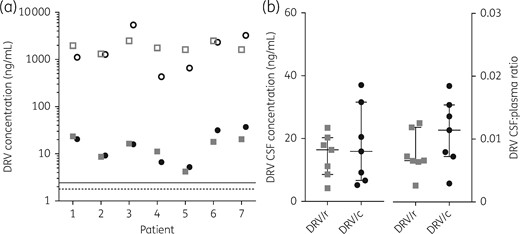
(a) Darunavir (DRV) plasma (open symbols) and CSF (filled symbols) concentrations obtained with ritonavir (DRV/r) boosting (grey squares) versus cobicistat (DRV/c) boosting (black circles). The threshold lines represent darunavir protein-free concentrations IC50 (1.78 ng/mL; dashed line) and IC90 (2.43 ng/mL; continuous line) of HIV-1 WT. (b) Darunavir CSF concentrations at the end of the dosing interval and darunavir CSF:plasma ratios when boosted with ritonavir (grey squares) versus cobicistat (black circles). The horizontal lines indicate the median and the whiskers the IQR.
All patients remained virologically suppressed both in the CSF and plasma throughout the study. Furthermore, no significant changes in the haematology and clinical chemistry laboratory parameters were noticed between study periods.
Discussion
The ability of a drug to enter the CSF, and thereby inhibit viral replication in this compartment, depends on a number of factors such as its molecular weight, lipophilicity, degree of protein binding but also its affinity for efflux transporters. Darunavir is a large molecule, highly bound to plasma proteins11,12 and a substrate of P-gp.6 Hence, darunavir concentrations in CSF have been reported to be low, on average 8.5–15.7 ng/mL for once-daily administration.7,12–14 Importantly, the degree of inhibition of efflux transporters was shown to influence darunavir concentrations in CSF;6,7 therefore, switching booster might have clinical implications because with cobicistat being a weaker inhibitor of the efflux transporters P-gp and BCRP than ritonavir,3,4 less darunavir may cross BBB.
Our data show that once-daily boosting by cobicistat and ritonavir results in essentially identical darunavir concentrations in CSF, which were well above the drug’s IC50 and IC90 for WT HIV11 and in the range of concentrations previously reported with ritonavir once-daily boosting.7,12–14 Similarly, CSF:plasma ratios were comparable between cobicistat and ritonavir boosting. Cobicistat boosting led to a higher inter-individual variability in both darunavir CSF and plasma concentrations; however, adequate darunavir concentrations in CSF were still achieved in all patients. It should be noted that this study was performed with darunavir once-daily dosing and therefore differences in darunavir concentrations in CSF could be apparent at higher doses of the boosters as ritonavir was shown to reduce P-gp-mediated efflux of darunavir in a dose-dependent manner.6 However, in individuals with darunavir-associated resistance mutations, only ritonavir can be used to boost twice-daily darunavir regimens because cobicistat is only licensed for use at 150 mg once daily.
In our study, all patients remained virologically suppressed both in the plasma and CSF, indicating that other non-treatment-related factors might have contributed to HAND. Of interest, predictors of neurocognitive improvements or declines were shown to include factors such as IQ, non-HIV comorbidities or depression.15 Ongoing neuroinflammation or CNS infections acquired during the primary infection could possibly be additional factors contributing to HAND.
A limitation of this study is the small sample size; however, the study was designed to compare darunavir concentrations in CSF within the same patient and showed reassuringly that concentrations were mostly similar or higher with cobicistat boosting (Figure 1a). This could be explained by the observed higher plasma concentrations of cobicistat compared with ritonavir, which might compensate for differences in their inhibitory effects on transporters.
In conclusion, this small study shows that cobicistat and ritonavir give comparable effective darunavir concentrations in CSF, thus suggesting that these boosters can be used interchangeably in once-daily darunavir regimens.
Acknowledgements
The authors thank Ms Susana Alves Saldanha for excellent analytical support.
Funding
The Division of Infectious Diseases & Hospital Epidemiology of University Hospital of Basel served as the study sponsor/investigator. The study was funded by Janssen-Cilag AG Switzerland. The study funder was involved in the review and approval of the study but did not play a role in the concept and design of the study, data collection and analysis, interpretation of the data, preparation of the manuscript or the decision to submit the paper for publication.
Transparency declarations
None of the authors has any financial relationship with organizations that could influence this work, although some authors have received in the past funding for research, consultancy fees or speaking engagements as detailed hereafter. Grants/grants pending: C. M. (Janssen), M. B. (Abbvie, BMS, Boehringer-Ingelheim, Gilead, Janssen, MSD, Pfizer, ViiV), L. D. (grant numbers 324730-165956 and 32473-141234 from the Swiss National Science Foundation). Board membership: M. B. (Gilead, MSD, Pfizer, ViiV). Payment for development of educational presentations: C. M. (Janssen, Gilead). All other authors: none to declare.
References
FDA Antiviral Drug Advisory Meeting—May 2012. http://www.fda.gov/AdvisoryCommittees/CommitteesMeetingMaterials/Drugs/AntiviralDrugsAdvisoryCommittee/ucm303394.htm.
