


Abstract
Soy formula feeding is common in infancy and is a source of high exposure to phytoestrogens, documented to influence vaginal cytology in female infants. Its influence on minipuberty in males has not been established.
To assess the association between infant feeding practice and longitudinally measured reproductive hormones and hormone-responsive tissues in infant boys.
The Infant Feeding and Early Development study was a prospective cohort of maternal–infant dyads requiring exclusive soy formula, cow milk formula, or breast milk feeding during study follow-up. In the 147 infant boy participants, serum testosterone, luteinizing hormone, stretched penile length, anogenital distance, and testis volume were longitudinally assessed from birth to 28 weeks. We examined feeding-group differences in age trajectories for these outcomes using mixed-effects regression splines.
Median serum testosterone was at pubertal levels at 2 weeks (176 ng/dL [quartiles: 124, 232]) and remained in this range until 12 weeks in all feeding groups. We did not observe differences in trajectories of hormone concentrations or anatomical measures between boys fed soy formula (n = 55) and boys fed cow milk formula (n = 54). Compared with breastfed boys (n = 38), soy formula–fed boys had a more rapid increase in penile length (P = .004) and slower initial lengthening of anogenital distance (P = .03), but no differences in hormone trajectories.
Reproductive hormone concentrations and anatomical responses followed similar trajectories in soy and cow milk formula–fed infant boys. Our findings suggest that these measures of early male reproductive development do not respond to phytoestrogen exposure during infancy.
Minipuberty is a transient postnatal activation of the hypothalamic pituitary gonadal (HPG) axis (1). In boys, minipuberty involves a rise in serum luteinizing hormone (LH) (2) and testosterone (3-5), although the timing of the peak of this postnatal rise has not been established; it also stimulates the development of reproductive organs (3, 6-8). The occurrence of minipuberty can, thus, be leveraged to test a boy’s ability to produce LH and testosterone in the diagnostic evaluations of microphallus, ambiguous genitalia, and central or peripheral hypogonadism (9). Although the biologic function of male minipuberty is not fully understood, it is plausibly responsible for male brain development and behavior (10), infant phallic growth (6), and has the potential to affect later reproductive function (11).
Minipubertal development may be susceptible to endocrine-disrupting chemicals (EDCs) in the infant diet or environment. EDCs may affect the male reproductive axis by acting as agonists at the estrogen receptor, as antagonists at the androgen receptor, or acting at unknown targets in the brain or testis (12). Soy infant formula exposure during the period of minipuberty is of interest because it is a relatively common feeding practice (13) and infants fed soy formula are exposed to potent phytoestrogens, predominantly genistein and daidzein, which have similar chemical structures to estrogen (14). Urinary genistein concentrations measured in soy-fed infants is 500 times greater than in cow milk formula–fed or breastfed infants (15). Postnatal testosterone production may be a plausible target for EDCs and an informative marker of such exposures. Indeed, male marmoset infants fed with soy formula had mean testosterone concentrations 55% lower than their twins fed cow milk formula (16). Thus, soy exposure in infant boys might affect testosterone levels and anatomic indices of testosterone action, such as phallus size (6), testicular development (11, 17), and anogenital distance (AGD), a sensitive endpoint for EDCs that block androgen (17, 18).
This study’s primary aim was to assess postnatal differences in serum testosterone and LH concentrations, penile length, AGD, and testis volume by infant feeding type. Among girls in this same longitudinal cohort, we previously found that exposure to soy formula was associated with estrogen-like changes in uterine volume and urogenital epithelial cells. In boys, soy formula was associated with a weak, transient response in urogenital epithelial cells. Neither sex showed a response to soy formula in their breast tissue (19). For the current study, we hypothesized that postnatal exposure to the estrogenic compounds found in soy formula would reduce the male minipuberty response that is mediated by androgens. Specifically, we hypothesized that exclusive soy formula feeding, compared with cow milk formula feeding, would result in lower serum testosterone leading to shorter stretched penile length, shorter AGD, smaller testes, and higher LH due to lack of negative feedback at the pituitary and hypothalamus (20).
Materials and Methods
The National Institute of Environmental Health Sciences Infant Feeding and Early Development (IFED) Study was an observational study conducted to assess longitudinal changes in infant reproductive hormone concentrations and reproductive organ characteristics in relation to soy formula feeding (compared with cow milk formula and breast milk). Details pertaining to IFED eligibility, enrollment, and study procedures have been described previously (19, 21). In brief, mothers and neonates were enrolled within 72 hours of the birth of their baby, starting in August 2010 at the Hospital of the University of Pennsylvania and continuing through November 2013, expanding to 7 other Philadelphia regional hospitals to increase enrollment. Eligible mothers were planning to feed their infants exclusive diets of soy formula, cow milk formula, or breast milk, spoke English, were ≥18 years of age, had no self-reported endocrine disorders, were not taking certain medications including steroids and immunosuppressants, and had not used hormones during pregnancy. Eligible infants were singletons born between 37 and 42 weeks’ gestation, with birth weight between 2500 and 4500 g. Gestational age was obtained from the mother’s medical record, and birthweight requirements were verified from the infant chart. Infants with serious illness (major congenital malformation, chromosomal anomaly, significant illness that affects growth and development, or respiratory distress requiring oxygen >4 hours) were excluded, as were infants with a sibling who was a blood relative enrolled in the study, and male infants with hypospadias or cryptorchidism. Our goal was to recruit roughly equal numbers of families from each feeding group.
Of the 618 mothers who consented to be screened, 410 (66%) agreed to participate and 399 (65% of those screened) completed the baseline visit (205 had baby boys). At the baseline visit, mothers who planned to use soy formula were asked why they chose this feeding type. The most common reasons mothers gave for choosing a soy diet for their infant were (1) previous use with an older sibling, (2) perceived healthfulness, and (3) suspected lactose intolerance of the infant ((19); Table 1 (22)). Infant feeding history was assessed at each study visit. Continued study participation required that mothers adhere to the feeding regimen chosen at enrollment (breast milk, cow milk formula, soy formula), but as infants aged, supplemental food of up to 15% (at 13 weeks) and 20% of calories (at 25 weeks) was allowed. We conducted a validation substudy of urinary isoflavones that demonstrated high adherence to feeding regimens among those who completed the study. Using a 200 ng/mL cut point as evidence of a soy diet, the feeding assessment questionnaire had a specificity of 0.95 and a sensitivity of 1.0 (15).
Infant boys had scheduled study visits within 72 hours of birth (neonatal visit), and then at 2 and 4 weeks (±4 days); 8 and 12 weeks (±10 days); 16, 20, and 24 weeks (±14 days); and 28 weeks (±30 days) of age. A subset of boys had a study visit at approximately 6 weeks due to a change in study protocol. Technicians performed anthropometric assessments and physical examinations (to measure AGD, penile length, and testicular volume) at each visit. Infants were examined by the technician on the schedule at the time of their study appointment. We estimated inter- and intra-rater reliabilities for the physical measures based on the variance components of a mixed model, a method that has been used to estimate reliabilities in another study of male infant anatomic outcomes (23) and has been described previously (24). Sonographers conducted ultrasounds of the testes at the neonatal, 4-, 8-, 16-, and 28-week visit. We collected blood samples at each study visit, beginning at week 2. Infant boys were required to have a minimum of 3 successful blood collections at weeks 2 or 4; weeks 8, 12, or 16; and weeks 24 or 28. A total of 147 male infants completed the study (adhered to chosen feeding regimen and required blood sample collection) and are included in the current analysis. Mother–infant dyads who did not complete the study did not differ demographically (by maternal characteristics or infant neonatal weight, gestational age) or by feeding group from those who completed the study (19).
Serum Hormones
Serum testosterone was analyzed using an isotope dilution liquid chromatography–tandem mass spectrometry method (US Centers for Disease Control and Prevention, Atlanta, GA) (25). Testosterone was dissociated from binding proteins, extracted from serum using liquid–liquid extractions, and analyzed by liquid chromatography–tandem mass spectrometry using negative electrospray ionization. The interassay coefficient of variation was <3.0% over 20 analytical runs and the limit of detection was 0.03 nM (0.75 ng/dL). To monitor accuracy, each run included the standard reference material (SRM), SRM 971F at 27.7 ng/dL, from the National Institute of Standards and Technology; the mean bias was 1.25% (95% CI 0.36-2.14%). Serum samples were shipped for analysis in 2 batches 3 months apart. Testosterone was measured once per subject per study visit. Values below the limit of detection (LOD) were replaced with LOD/√2. Concentrations that were considerably below the LOD and inconsistent with the values of neighboring visits were considered anomalous (n = 2) and were excluded from analysis.
LabCorps/Esoterix measured serum luteinizing hormone (LH) using their commercially available method (26). The Esoterix electrochemiluminescent assay utilizes paired monoclonal antibodies against distinct epitopes of the alpha and beta subunit to provide a highly sensitive and specific procedure for the determination of LH. The validated lower limit of quantitation is 0.005 mIU/mL. The upper limit of quantitation is 100 mIU/mL. Serum samples were shipped for analysis in 3 batches 3 months apart. LH was measured in duplicate for each subject at each study visit and the geometric mean of the 2 values was used in the analysis. Anomalous values (n = 3) were excluded using the same criteria as for testosterone measures.
Penile Length
Penile length was measured using techniques described by Romano-Riquer et al. (23). Briefly, study staff placed a ruler on the pubic symphysis above and immediately adjacent to the penis. They then gently stretched the penis while lowering the foreskin until the urethral meatus was visible and measured to the tip of the penis. The length was measured twice to the nearest 0.1 cm and the average of the 2 values was used in the analysis. The estimated inter-rater reliability was 0.80 and estimated intra-rater reliability was 0.98 (Table 2 (22)).
Anogenital Distance
AGD was measured with the infant in the dorsal decubitus position from the posterior of the scrotum to anus. Study staff used calipers to measure the distance by aligning the fixed end of the caliper at the center of the anus and adjusting the moveable edge of the caliper to align with the posterior scrotum. AGD lengths were measured twice and the geometric mean of the 2 values was used in the analysis. We also measured the anterior penis to anus and posterior penis to anus distance using the same method. Because the posterior scrotum to anus measurement allows comparison of our results with others, we considered it the primary AGD measurement in this study. The estimated inter-rater reliability for the 3 AGD measures ranged from 0.80 to 0.92 and estimated intra-rater reliability ranged from 0.97 to 0.98 (Table 2 (22)).
Testis Volume
Testis volume was obtained by ultrasound. Ultrasound examinations were performed by certified sonographers trained on the study protocol, using methods previously described (19, 21). In brief, sonographers recorded measurements of the testis in the longest diameter for sagittal (SAG), transverse (TRV), and anteroposterior (AP) dimensions 3 or 4 times from separate images. The geometric mean of the multiple measurements from each testis was used as the dimension-specific diameter. The AP dimension measurement was determined from the transverse image. We approximated testis volume as the volume of an ellipsoid, using the formula 0.523 × SAG × TRV × AP. We used the geometric mean of the right and left testis volumes as the subject-specific testis volume at each study visit. Most scans were completed using Philips iU22 US scanners (Philips Healthcare, Bothell, WA) or a GE LogiQ E9 (GE Ultrasound; Wauwatosa, WI). Some neonatal visits were completed using a portable Philips CX50 CompactXtreme or a GE LOGIQ e BT11.
We also measured testicular volume (includes testis, epididymis, and vas deferens) using a Prader orchidometer (“Prader beads”) (27) that was modified for use in infancy and included bead sizes of 0.5, 1.0, 1.5, 2.0, 2.5, and 3 cc. The technician palpated the testicle while simultaneously holding the beads adjacent for comparison. Two independent measurements of each testicle were taken. The average of both testicles was used in the analysis. Testicular volume measurements had an estimated inter-rater reliability of 0.69 for both testicles; estimated intra-rater reliability differed slightly for the right (0.89) and left (0.88) testicle (Table 2 (22)).
Statistical Analysis
We examined feeding group differences in age trajectories using mixed-effects regression splines under normality assumptions. Our strategy was similar for all outcomes, though details differed (Methods and Table 3 (22)). Feeding group–specific trajectories were represented as natural cubic splines with 3 or 4 knots, common to all feeding groups and equally spaced in the square root of age (days) to accommodate closer visit spacing in early weeks. The single exception was testicular volume by Prader orchidometer, where the trajectory was modeled as linear in the square root of age. The mixed-effects model included subject-specific random effects for each regression coefficient, allowing each study subject to have a trajectory that deviated from the average one. Outcomes were log2 transformed for analyses, except stretched penile length and testicular volume by Prader orchidometer, which were analyzed using untransformed values. We report comparisons among all feeding groups but emphasize cow milk formula as the most appropriate comparison diet for soy formula. This choice is an effort to reduce the influence of unmeasured confounding, because women who choose and have support to breastfeed tend to differ from women who formula feed on socioeconomic and demographic factors, as well as other characteristics that are unknown or unmeasured in this study.
Because our nonhormonal outcome measures are plausibly related to age and, within age, body size, we followed The Infant Development and Environment Study group’s recommendation and used the z-score of weight for length as an adjustment for possible confounding (8). To adjust trajectories for a subject’s z-score of weight to length at each visit, we used similar mixed-effects regression models that included an additional fixed-effect term linear in the z-score. We calculated the z-scores using the SAS code provided by the Centers for Disease Control and Prevention together with World Health Organization reference values (https://www.cdc.gov/nccdphp/dnpao/growthcharts/resources/sas-who.htm). Weight and recumbent length for subjects at each visit were each the averages of 2 measurements taken during the visit. Analyses adjusted for z-scores involve 3 fewer observations than the corresponding unadjusted analyses because recumbent length was either missing (2 subjects, 1 visit each) or its value was below the minimum of the World Health Organization reference values (1 subject, 1 visit).
For the hormonal outcomes, which were measured for the first time at age 2 weeks (after feeding regimen was established), we compared trajectories between the feeding groups using contrasts among spline coefficients, including the intercept. For the anatomical outcomes, under the assumption that any differences measured at the neonatal visit (<72 hours of birth) are unrelated to postnatal feeding regimen, we compared postnatal trajectories between the feeding groups for those outcomes, using contrasts among spline coefficients, excluding the intercept.
We report comparison-wise P values, in other words without adjustment for multiple testing.
To graphically display the postnatal trajectories, we subtracted the predicted response at age 0 (neonatal examination) for each feeding group separately. Untransformed responses (penile length) have intercept 0 and can be interpreted as the difference in response at each subsequent age from the response at age 0 (change in penile length). For log2-transformed outcomes (AGD and testis volume), trajectories have intercept 1, the antilogarithm of 0; and, because a difference in logarithms is the logarithm of a ratio, they can be interpreted as the ratio of the response at each subsequent age to the response at age 0 (relative change in AGD and relative change in testis volume). In either setting, these shifted trajectories allow visual comparison among feeding groups of expected trajectories under the assumption that feeding group membership would not influence response at birth. SAS, versions 9.3 or 9.4, (SAS Institute, Cary, NC) was used for statistical analysis.
Results
Of the 147 mother–infant boy pairs who completed the study, 55 infants were fed cow milk formula, 54 infants were fed soy formula, and 38 infants were breastfed (Table 1). Mothers had a median age of 26 years (quartiles: 21, 30), the majority were Black (69%), and 54% had a high school education or less. Mothers who chose to formula feed their infant, either cow milk or soy formula, were similar with regard to age, race, and education. Mothers of breastfed boys were slightly older, more likely to have a college or postgraduate degree, and were more likely to be White than mothers of formula-fed infants. The infants’ median weight at the neonatal exam was 3.3 kg (quartiles: 3.0, 3.5) and most infants had a gestational age at birth of 39 or 40 weeks (63%). Breastfed boys had a slightly heavier neonatal weight and older gestational age than the boys in the 2 formula-fed groups, who were similar with respect to gestational age and neonatal weight.
Demographic characteristics of mother-infant pairs in the IFED study (n = 147)
| Soy | Cow | Breast | Total | |
|---|---|---|---|---|
| No. of mother–infant pairs | 54 | 55 | 38 | 147 |
| Maternal race, n (%) | ||||
| Black | 42 (78) | 45 (82) | 14 (37) | 101 (69) |
| White | 11 (20) | 7 (13) | 16 (42) | 34 (23) |
| All other races | 1 (2) | 3 (5) | 8 (21) | 12 (8) |
| Maternal education, n (%) | ||||
| Less than high school | 11 (20) | 19 (35) | 0 (0) | 30 (20) |
| High school or GED | 26 (48) | 16 (29) | 8 (21) | 50 (34) |
| Some college or associates | 14 (26) | 15 (27) | 10 (26) | 39 (27) |
| College or postgraduate | 3 (6) | 5 (9) | 20 (53) | 28 (19) |
| Maternal age (years) | ||||
| Median (quartiles) | 25 (22, 29) | 25 (20, 30) | 28 (24, 32) | 26 (21, 30) |
| Neonatal weight (kg) | ||||
| Median (quartiles) | 3.3 (2.9, 3.4) | 3.2 (3.0, 3.5) | 3.4 (3.2, 3.7) | 3.3 (3.0, 3.5) |
| Gestational age (weeks), n (%) | ||||
| 37 | 5 (9) | 5 (9) | 1 (3) | 11 (7) |
| 38 | 9 (17) | 9 (16) | 4 (10) | 22 (15) |
| 39 | 27 (50) | 17 (31) | 11 (29) | 55 (37) |
| 40 | 10 (18) | 19 (35) | 9 (24) | 38 (26) |
| 41 | 3 (6) | 5 (9) | 13 (34) | 21 (14) |
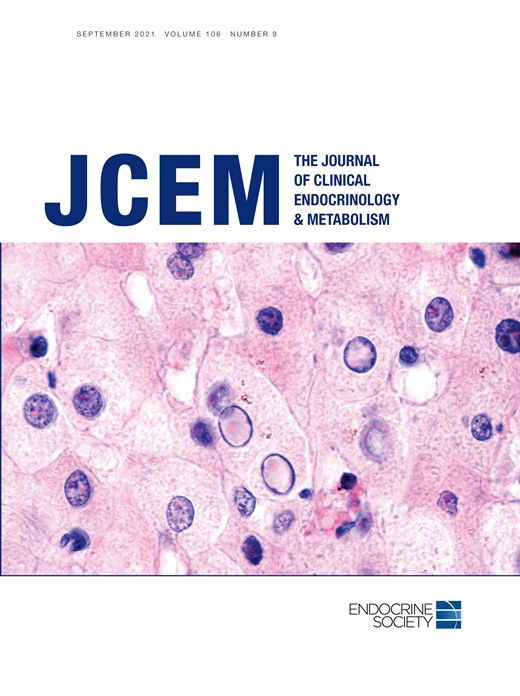
Testosterone was already in the midpubertal range (Tanner stage III: range 26-800 ng/dL) (28) at the first study measurement, taken at age 2 weeks, with a median value of 176 ng/dL (quartiles: 124, 232) and remained in this range through the 12-week visit (median testosterone >150 ng/dL for all visits through 12 weeks). Estimated feeding group trajectories also showed this same pattern of pubertal-level testosterone early, through the 12-week time point, and then decreasing concentrations for the remaining study visits (through week 28; Fig. 1). We saw no feeding group differences in the trajectory of testosterone concentrations between the 2 formula groups (cow milk vs soy, P = .3). There was a broad range of testosterone concentrations among individuals at every visit from the first at 2 weeks (range: 41-590 ng/dL) to the last at 28 weeks (range: 0.5-129 ng/dL). This broad range was present for all 3 feeding groups. In 5 serum samples (samples at week 20 and 24 in 1 infant and samples at week 28 in 3 infants) testosterone was below the limit of detection, and replaced with the LOD/√2.
Feeding group–specific fitted testosterone trajectories across infant age. Trajectories for soy formula–fed infants are represented by the red solid line, cow-milk formula fed infants are represented by the blue long-dashed line, and breastfed infants are represented by the green dot-dashed line. Open symbols represent individual testosterone concentrations for infants in the study; red circles for soy formula–fed infants, blue squares for cow milk formula–fed infants, and green triangles for breastfed infants. Shaded bands represent 95% CI for each feeding group–specific trajectory: soy formula fed, diagonal upward to the right; cow milk formula fed, solid gray; breastfed, diagonal downward to the right.
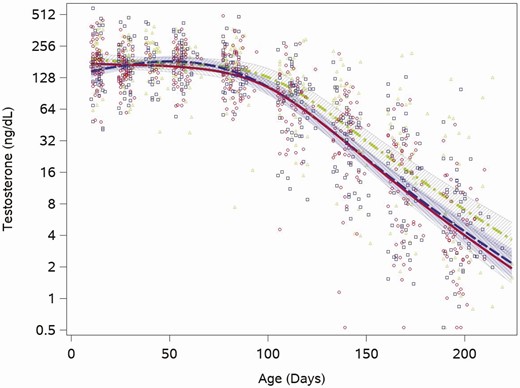
The median LH concentration was 3.4 mIU/mL (quartiles: 2.1, 5.2) at the 2-week visit and fell to 0.3 mIU/mL (quartiles: 0.1, 0.5) at the 28-week visit. Unlike testosterone, each of the feeding group–specific LH concentration trajectories showed an immediate monotonic decline (Fig. 2). We found no formula feeding group differences in the trajectory of LH (cow milk vs soy, P = .8). While the group-based trajectories were similar across the study period, when LH was highest (2 weeks) the range of individual values was between 0.2 and 14 mIU/mL and when LH was lowest (28 weeks) individual concentrations were between 0.1 and 2.6 mIU/mL. LH was detectable in all samples not flagged as having anomalous values.
Feeding group–specific fitted LH trajectories across infant age. Trajectories for soy formula fed infants are represented by the red solid line, cow milk formula–fed infants are represented by the blue long-dashed line, and breastfed infants are represented by the green dot-dashed line. Open symbols represent individual LH concentrations for infants in the study; red circles for soy formula fed infants, blue squares for cow milk formula–fed infants, and green triangles for breastfed infants. Shaded bands represent 95% confidence intervals for each feeding group–specific trajectory: soy formula fed, diagonal upward to the right; cow milk formula fed, solid gray; breastfed, diagonal downward to the right.
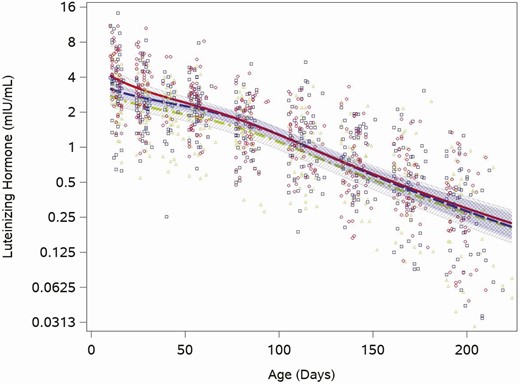
Stretched penile length increased from the birth visit (median 3.6 cm, quartiles: 3.3, 4.0) to the 12-week visit (median 4.5 cm, quartiles: 4.0, 4.7), the period when testosterone was in the pubertal range, and then grew more slowly through the rest of the study period. This pattern was reflected in the weight for length-adjusted fitted feeding group–specific penile length trajectories (Fig. 3A). Figure 3A also shows that individual boys’ penile length measurements at each study visit, when boys were approximately the same age, spanned a wide range in all feeding groups. The intercept adjusted penile length trajectories indicated that soy formula–fed boys had the fastest penis growth in the early weeks, but their trajectory was not statistically different from that of the boys fed cow milk formula (P = .3; Fig. 3B).
Feeding group–specific fitted stretched penile length trajectories across infant age adjusted for weight for length z-score. Trajectories for soy formula–fed infants are represented by the red solid line, cow milk formula–fed infants are represented by the blue long-dashed line, and breastfed infants are represented by the green dot-dashed line. Shaded bands represent 95% CI for each feeding group–specific trajectory: soy formula fed, diagonal upward to the right; cow milk formula fed, solid gray; breastfed, diagonal downward to the right. (A) Open symbols represent individual penile lengths for infants in the study; red circles for soy formula fed infants, blue squares for cow milk formula–fed infants, and green triangles for breastfed infants. (B) Feeding group–specific trajectories fitted to the data were shifted vertically to a common intercept at 0 to better display postnatal changes (ie, fitted penile length at a given age minus fitted penile length at birth). Thus, the vertical axis represents change in stretched penile length since birth.
As expected, AGD lengthened as infants aged and grew. The median posterior scrotum to anus length at the neonatal visit was 21.5 mm (quartiles: 18.9, 23.8), which increased to 32.8 mm (quartiles: 27.5, 37.8) at the 28-week visit. The weight for length-adjusted fitted feeding group–specific AGD trajectories showed an increase across the study period. The range of individual values was wide for all feeding groups, and overall ranged between 7 mm and 35 mm for the neonatal visit and 15 mm to 56 mm at the last measurement at 28 weeks (Fig. 4A). The weight for length-adjusted relative posterior scrotum to anus distance trajectory (with a common intercept between feeding groups) did not differ significantly between boys fed cow milk formula and those fed soy formula fed (P = .1; Fig. 4B). The other 2 AGD measures showed generally similar patterns (Results and Figures 1 and 2 (22)).
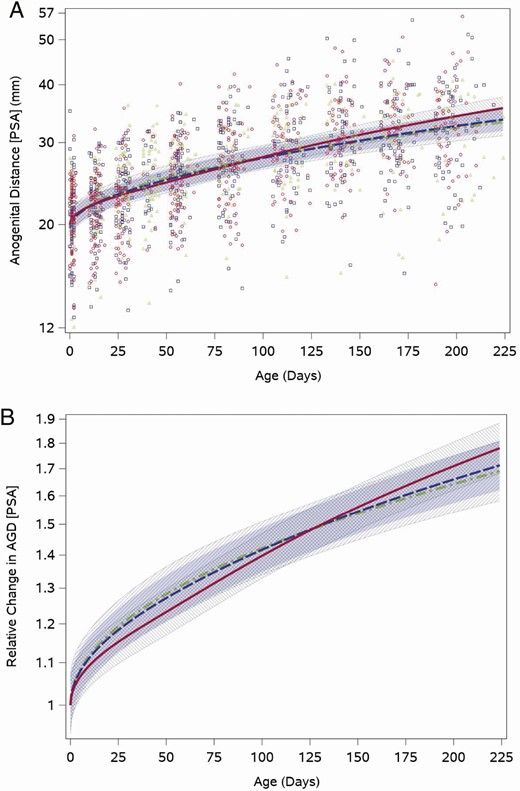
Feeding group–specific fitted posterior scrotum to anus (PSA) distance trajectories across infant age adjusted for weight for length z-score. Trajectories for soy formula fed infants are represented by the red solid line, cow milk formula–fed infants are represented by the blue long-dashed line, and breastfed infants are represented by the green dot-dashed line. Shaded bands represent 95% CI for each feeding group–specific trajectory: soy formula fed, diagonal upward to the right; cow milk formula fed, solid gray; breastfed, diagonal downward to the right. (A) Open symbols represent individual posterior scrotum to anus distances for infants in the study; red circles for soy formula fed infants, blue squares for cow milk formula–fed infants, and green triangles for breastfed infants. (B) Feeding group–specific trajectories fitted to the data were shifted vertically to a common intercept at 1 to better display postnatal changes (ie, fitted log-transformed posterior scrotum to anus length at a given age minus fitted log-transformed posterior scrotum to anus length at birth). Thus, the vertical axis represents relative change in posterior scrotum to anus length since birth.
Testis volume by ultrasound demonstrated a sharp increase during the first half of study follow-up when testosterone was in the pubertal range and then a slower increase when infants were older (Fig. 5A). The overall testis volume doubled from the neonatal visit (median: 0.25 cm3 [quartiles: 0.21, 0.30]) to the 16-week visit (median: 0.52 cm3 [quartiles: 0.43, 0.59]). Like the other outcomes examined, testis volumes varied among boys in all feeding groups throughout the study period (Fig. 5A). We saw no statistically significant differences among the relative feeding group trajectories after adjustment for weight for length z-score (cow vs soy, P = .7), although soy formula–fed infants tended toward a slightly slower increase in volume (Fig. 5B). Testicular volume trajectories by Prader orchidometry were similar for boys fed cow milk and soy formula (Results and Figure 3 (22)).

Feeding group–specific fitted ultrasound measured testis volume trajectories across infant age adjusted for weight for length z-score. Trajectories for soy formula–fed infants are represented by the red solid line, cow milk formula–fed infants are represented by the blue long-dashed line, and breastfed infants are represented by the green dot-dashed line. Shaded bands represent 95% CI for each feeding group–specific trajectory: soy formula fed, diagonal upward to the right; cowmilk formula fed, solid gray; breastfed, diagonal downward to the right. (A) Open symbols represent individual ultrasound measured testis volume for infants in the study; red circles for soy formula fed infants, blue squares for cow milk formula–fed infants, and green triangles for breastfed infants. (B) Feeding group–specific trajectories fitted to the data were shifted vertically to a common intercept at 1 to better display postnatal changes (ie, fitted log-transformed testis volume at a given age minus fitted log-transformed testis volume at birth). Thus, the vertical axis represents relative change in testis volume since birth.
Breastfed Comparisons
Although not our primary interest, we found differences in trajectories between breastfed boys and formula-fed boys for some outcome measures. The testosterone trajectory of breastfed boys was higher than that of cow milk formula–fed boys (P = .03), soy formula–fed infants had faster penis growth than breastfed infants (P = .004), and posterior scrotum to anus distance differed between breastfed boys and soy formula–fed boys (P = .03). Details regarding these comparisons are presented elsewhere (Results (22)).
Discussion
In this cohort of healthy infant boys, we did not find evidence that exposure to soy formula diminished male infants’ hormonal minipuberty or associated anatomical response indices of reproductive hormone action. Compared with infants fed cow milk formula, infants fed soy formula had similar trajectories of testosterone, LH, penile length, AGD, and testis volume across the study period. When we compared breastfed boys to those fed soy formula, soy-fed boys had faster penile length growth and slower initial lengthening of AGD, although these were not our primary comparisons due to differences in maternal demographic characteristics between infants who were breastfed and those who were formula fed. The wide range among individuals across all outcomes examined make the clinical significance of differences between feeding groups difficult to determine.
In all feeding groups, serum testosterone concentrations were consistent with pubertal levels (29, 30) at age 2 weeks and stayed elevated through age 12 weeks, while LH showed a monotonic decline between ages 2 weeks and 28 weeks. A similar testosterone concentration was reported in the 6-month longitudinal study by Garagorri et al., with mean plasma testosterone concentrations of 175 ng/dL at 15 days (5), while other studies report a peak testosterone later in infancy, between 1 and 3 months (31, 32). A cross-sectional study in Danish and Finnish boys reported a median testosterone concentration of approximately 90 ng/dL at age 2.5-3.5 months (33), slightly lower than what was observed at that age in our study. We did not observe lower testosterone among boys fed soy formula, in contrast to a study done in twin marmosets, animals that also have a postnatal testosterone rise. In this study, testosterone was measured twice (age 18-20 days, age 35-45 days) and marmosets fed soy formula had a lower mean testosterone at both time points than their twin siblings fed formula made from cow milk (16). We are unaware of other studies in boys that examined the association between postnatal dietary or environmental EDC exposures and minipubertal reproductive hormone concentrations.
Both penis size and testicular volume are possible targets of EDCs because of their dependence on testosterone for healthy development. Early testicular growth is the result of a rapid rise in the number of Sertoli cells, which has been reported in both human infants and nonhuman primates (34, 35). Infant marmosets fed soy formula have a greater number of Leydig cells (possibly a compensatory response to a compromise in testosterone synthesis) than their twin siblings fed formula made from cow milk, but no differences in the number of Sertoli cells, number of germ cells, or testis weight (16). A study similar to ours of infant feeding practice and reproductive organ size also reported no differences in testicular volume between boys fed soy formula compared with cow milk formula (36). Similar to these studies, we did not observe differences in testis growth with exposure to soy formula in our study. We also did not observe an association between soy formula and penile length. Swan et al., assessed environmental phthalate exposure (a group of EDCs) and infant reproductive outcomes, and found no association between phthalates and infant penile width, although the exposure was assessed prenatally and the measure of penis size differed from ours, limiting a direct comparison to our results (37).
AGD is a sexually dimorphic (longer in males), androgen responsive anatomic measurement. AGD is used in toxicology studies to measure prenatal androgen exposure (38). Some data from mouse models show that postnatal exposure to antiandrogenic compounds such as the medication flutamide and phthalate metabolite di-(2-ethylhexyl) phthalate can shorten AGD, as well as, paradoxically, postnatal testosterone exposure (39). Another study showed that male rats exposed to genistein, the main phytoestrogen in soy, both prenatally and through lactation via the maternal diet had shorter AGD (40). Exposure to EDCs in infant boys has mostly focused on the prenatal period with reports of an association between higher prenatal di-(2-ethylhexyl) phthalate exposure and shorter AGD (18, 37). A study of prenatal exposure to per- and poly-fluoroalkyl substances, another class of EDC, also reported an association with shorter AGD in male infants (41). We saw no differences in AGD trajectories of boys by feeding group, specifically no differences after exposure to soy formula compared with cow milk formula. The critical window for endocrine disrupting effects on AGD may be limited to the prenatal period in boys, so that postnatal exposure to soy formula has no effect.
A strength of this study was that we had a relatively large sample size to evaluate differences in the trajectories of these reproductive outcomes by infant feeding group. Exclusive soy formula, cow milk formula, or breastfeeding was required for study participation, monitored at each study visit, and validated in a substudy by measuring urinary genistein concentrations (15). We also had longitudinal measures of testosterone and LH starting at 2 weeks old and anatomical outcomes starting within 72 hours of birth, earlier than many prior studies. We utilized sensitive and specific assays for testosterone and LH resulting in very few samples with results below the limit of detection. While the standard method for measuring testicular volume is by Prader orchidometer, our study also used ultrasound with high-resolution imaging and a standardized protocol to measure testis volume, allowing for a more accurate assessment of testis growth.
Each outcome exhibited a considerable range of responses among individuals. While this range likely reflects normal biological variation, for the physical measures (orchidometry, AGD, and penile length), differences in measurement between raters may be contributing, despite modest to high inter-rater reliability in this study. Our study used a nonrandom assignment to feeding group. Families who were committed to a specific feeding regimen of their choosing were invited to participate. This may have resulted in confounding, although the cow milk formula and soy formula groups were similar in terms of maternal demographic characteristics, and neonatal weight and gestational age (19). The majority of mothers in our study identified as Black, had a mean age of 26 years at the time of their study infant’s birth, and over half had a high school education or less, which may limit the generalizability of our results to the broader population. However, representation in this cohort of often understudied sociodemographic groups adds to the literature on minipuberty.
Conclusions
Our findings suggest that these hormonal and anatomical measures of early male reproductive development do not respond to infant phytoestrogen exposure, in contrast to the response observed in infant girls. While not our primary comparison, we did observe differences in the trajectories for some outcomes between breastfed infants and formula-fed infants. The range of responses in individual boys’ outcome measures should be followed up in future studies to determine clinically relevant changes in these measures of minipuberty.
Abbreviations
- AGD
anogenital distance
- AP
anterior posterior
- EDC
endocrine-disrupting chemical
- HPG
hypothalamic pituitary gonadal
- IFED
Infant Feeding and Early Development
- LH
luteinizing hormone
- LOD
limit of detection
- SAG
sagittal
- SRF
standard reference material
- SRM
standard reference material
- TRV
transverse
Acknowledgments
We thank Jon Nakamoto for important contributions to the conception and design of the hormone analyses. We also thank Manmohan Dhawan for her assistance with the literature review for this manuscript.
Financial Support: This research was supported by the Intramural Research Program of the NIH, National Institute of Environmental Health Sciences (ES044006). Data collection at the Children’s Hospital of Philadelphia (CHOP) was supported through Subcontract PHR-SUPS2-S-09-00196 under Contract HHSN291200555546C between the National Institute of Environmental Health Sciences and Social & Scientific Systems Inc. This project was supported by the Nutrition Center at the CHOP and by the National Center for Research Resources, Grant UL1TR000003 (National Center for Advancing Translational Sciences).
Additional Information
Disclosures: The authors report nothing to disclose.
Data Availability
Restrictions apply to the availability of data generated or analyzed during this study to preserve patient confidentiality. The corresponding author will on request detail the restrictions and any conditions under which access to some data may be provided.
