


Abstract
The mechanisms of pituitary adenoma (PA) pathogenesis and proliferation remain largely unknown.
To clarify the role of mismatch repair (MMR) genes in the molecular mechanism of PA proliferation.
We performed quantitative analyses by real-time polymerase chain reaction and immunohistochemistry to detect MMR gene and protein expression in human PAs (n = 47). We also performed correlation analyses of expression levels and tumor volume doubling time (TVDT; n = 31). Specifically, correlation analyses were performed between genes with significant correlation and ataxiatelangiectasia and Rad3-related (ATR) expression in cell-cycle regulatory mechanism ATR–checkpoint kinase 1 (Chk1) pathway (n = 93). We investigated the effect of reduced gene expression on cell proliferation and ATR gene expression in AtT-20ins cells and primary cultures of human PAs.
Expression of mutS homologs 6 and 2 (MSH6 and MSH2) was positively associated with TVDT (R = 0.52, P = 0.003, and R = 0.44, P = 0.01), as were the corresponding protein levels. Gene expression was positively associated with ATR expression (R = 0.47, P < 0.00001, and R = 0.49, P < 0.00001). In AtT-20ins, the reduction of MSH6 and/or MSH2 expression by small interfering RNA significantly promoted cell proliferation by decreasing ATR expression. This effect was also observed in primary culture.
Reduction of MSH6 and MSH2 expression at the messenger RNA and protein levels could be involved in direct PA proliferation by promoting cell-cycle progression or decreasing the rate of apoptosis through interference with the function of the ATR–Chk1 pathway.
Pituitary adenomas (PAs) are common intracranial tumors, accounting for 15% to 20% of all brain neoplasms (1). Although PAs are predominantly benign lesions arising from adenohypophysis, they include highly proliferative and invasive, aggressive PAs and pituitary carcinoma (2, 3). When considering clinically aggressive adenomas, oncologists are strongly recommended to take into account the 2017 World Health Organization classification of tumors of the pituitary gland, accurate histological tumor subtyping, assessment tumor proliferative potential by mitotic count and Ki-67 index, and other clinical parameters, such as tumor invasion (3). In addition, the expression levels of mutS homolog 6 (MSH6) and O-6-methylguanine-DNA methyltransferase have been used to predict the therapeutic effect of temozolomide on aggressive PAs and pituitary carcinomas (4). Some pituitary tumors with high proliferative potential, however, do not meet the criteria for aggressive PA. Therefore, it is clinically important to elucidate the mechanism of development and proliferation of pituitary tumors.
The mismatch repair (MMR) mechanism corrects errors resulting from nucleotide misincorporation by DNA polymerase (5–8). Genes involved in the MMR pathway include mutL homolog 1 (MLH1), PMS1 homolog 2 (PMS2), mutS homolog 2 (MSH2), MSH6, mutL homolog 3 (MLH3), mutS homolog 3 (MSH3), PMS1 homolog 1 (PMS1), and epithelial cell adhesion molecule (EPCAM). Germline mutations of the MMR genes cause an inherited disease, called Lynch syndrome, in which tumors, such as colorectal, endometrial, and ovarian cancer, occur at high frequency (9, 10). In colorectal cancer, MLH1 expression is reduced as a result of methylation of the promoter region, even if germline gene mutations are absent (11). In addition to the prevention of genetic mutations related to tumor development (5), MMR proteins can sense against DNA damage and directly suppress cell proliferation via a cell-cycle regulatory mechanism known as the ataxiatelangiectasia and Rad3-related–checkpoint kinase 1 (ATR–Chk1) pathway (12, 13).
Regarding the relationship between MMR genes and pituitary tumors, one study found that MSH6 immunoexpression was reduced in four out of 13 cases of highly proliferative pituitary tumors (4). We previously reported an aggressive PA that exhibited both loss of heterozygosity of an MLH1 germline mutation (Lynch syndrome) and somatic mutation of MSH6 (14). In addition, Bengtsson et al. (15) reported that a corticotroph pituitary carcinoma developed in a patient with Lynch syndrome, and they also showed the high prevalence of PAs in patients with Lynch syndrome from a nation-wide survey in Sweden.
Based on these findings, we hypothesize that MMR genes might affect pituitary tumor growth, development, and proliferation. In this study, we sought to analyze the correlation between MMR gene-expression levels and clinical factors related to tumor proliferation, using tissue from human PAs. We also sought to clarify the relationship between MMR genes and the molecular mechanisms underlying pituitary tumor proliferation.
Materials and Methods
Ethics statement
Informed consent was obtained from all patients for the collection, analysis, and publication of personal and clinical data and for the use of pituitary tumor specimens in gene-expression and immunohistochemical studies. This study was performed with approval of the Wakayama Medical University Ethics Committee.
Patient samples
Between September 2013 and September 2016, 47 patients with PA consented to participate in our study at Wakayama Medical University Hospital. Clinical, imageological, and histopathological characteristics of these patients are shown in Table 1 and Supplemental Table 1A. In addition, between February and September 2016, 46 patients with nonfunctioning PA consented to participate in this study at Toranomon Hospital. Clinical, imageological, and histopathological characteristics of these patients are shown in Table 2 and Supplemental Table 1B. The 46 nonfunctioning PA samples were used only for detection of messenger RNA (mRNA) levels [MSH2, MSH6, ATR, and glyceraldehyde 3-phosphate dehydrogenase (GAPDH)].
Clinical, Imageological, and Histopathological Characteristics of Patients With PA at Wakayama Medical University Hospital
| Clinical Phenotype | Number | Pathological Phenotype | Number | Summarized Data | |
|---|---|---|---|---|---|
| Nonfunctioning PA | 34 | Gonadotroph adenoma | 24 | Male/female | 20/27 |
| Silent somatotroph adenoma | 5 | Age | 55.9 ± 13.8 yearsa | ||
| Silent thyrotroph adenoma | 3 | Micro/macro | 2/45 | ||
| Silent lactotroph adenoma | 2 | TV, cm3 | 9.5 cm3b (0.4–49.2) | ||
| Somatotroph adenoma | 6 | Somatotroph adenoma | 6 | TVDT, mo (n = 31) | 29.4 mob (1.9–91.3) |
| Lactotroph adenoma | 3 | Lactotroph adenoma | 3 | Follow-up period, mo (n = 31) | 15.7 mob (3.5–53.6) |
| Corticotroph adenoma | 2 | Corticotroph adenoma | 2 | Time interval of MRI, mo (n = 31) | 12.9 mob (1.8–50.2) |
| Thyrotroph adenoma | 1 | Thyrotroph adenoma | 1 | MIB-1 LI, % | 2.4%b (0.2–20.0) |
| Plurihormonal (ACTH, PRL, GH) adenoma | 1 | Plurihormonal (ACTH, PRL, GH) adenoma | 1 | <3%: 34 | |
| Total | 47 | ≥3%: 13 | |||
| (Recurrence) | 14 | ||||
Abbreviations: ACTH, adrenocorticotropic hormone; GH, growth hormone; LI, labeling index; PRL, prolactin.
Means ± standard deviation.
Median.
Clinical, Imageological, and Histopathological Characteristics of Patients With PA at Toranomon Hospital
| Clinical Phenotype | Number | Pathological Phenotype | Number | Summarized Data | |
|---|---|---|---|---|---|
| Nonfunctioning PA | 46 | Gonadotroph adenoma | 27 | Male/female | 20/26 |
| Silent corticotroph adenoma | 13 | Age | 51.6 ± 15.5 ya | ||
| Silent somatotroph adenoma | 1 | Micro/macro | 0/46 | ||
| Silent thyrotroph adenoma | 1 | MIB-1 LI, % | 1.8%b (0.3–4.1) | ||
| Silent lactotroph adenoma | 1 | <3%: 39 | |||
| Silent plurihormonal (PRL, GH) adenoma | 1 | ≥3%: 7 | |||
| Null cell adenoma | 2 | ||||
| Total | 46 | ||||
| (Recurrence) | 5 | ||||
Means ± standard deviation.
Median.
Measurement of tumor volume and tumor volume doubling time
Serial magnetic resonance images (MRI) were used to establish tumor volume (TV) and growth rate. The Centricity® PACS Universal Viewer web client, version 6.0 (GE Healthcare, New York, NY) was used for the MRI analysis. The tumor region of interest on enhanced T1-weighted images was manually defined and used to measure the TV. The pituitary tumor was manually outlined on each section using the free-hand region of interest measuring option, and the outlined area was automatically calculated. The product of the pituitary tumor area and the section thickness represented the volume of the pituitary tumor in each single section. Total volume was computed by summing the entire section volume. To estimate the tumor growth rate, we used a previously established formula for measuring TV doubling time (TVDT): TVDT = t log22/log2 (Vf/V0), where t is the time interval between the first and second MRI examinations, V0 is the initial TV, and Vf is the final TV (16, 17). We calculated preoperative TV for all 47 pituitary tumor cases. Of the 47, there were 31 cases in which the first and second MRI examinations were performed postoperatively, and TVDT could be calculated. The median follow-up period was 15.7 months (3.5 to 53.6 months), and the median MRI interval time was 12.9 months (1.8 to 50.2 months; Table 1). Preoperative TV, TVDT, and MRI interval time of each case are shown in Supplemental Table 1A.
Measurement of MMR gene and ATR gene mRNA expression
Total RNA was extracted using the TRIzol reagent. cDNA was synthesized using the TaqMan™ Reverse Transcription Reagents (Applied Biosystems, Foster City, CA). Quantitative reverse transcriptase-polymerase chain reaction (qRT-PCR) analyses were carried out to detect mRNA levels (MLH1, PMS2, MSH2, MSH6, MLH3, MSH3, PMS1, EPCAM, and ATR) using SYBR Green Real-Time PCR Master Mixes (Applied Biosystems). GAPDH was used as an internal control. Primers for qRT-PCR are shown in Supplemental Table 2A.
Immunohistochemistry and quantitative analysis
Formalin-fixed paraffin-embedded tissues sections of pituitary tumors were examined histopathologically and immunohistochemically using the following antibodies: MSH6 (M3646; Dako, Tokyo, Japan), MSH2 (#2017; Cell Signaling Technology, Danvers, MA), and Ki-67 (MIB-1; 790-4286; Ventana, Tucson, AZ). Immunohistochemistry was performed using the BenchMark Ultra automated system (Ventana, Tucson, AZ), as previously described (14). Next, we quantitatively analyzed the immunohistochemical results for MSH6 and MSH2 using the BZ-H3C application (Keyence, Osaka, Japan). In this analysis, protein expression was quantified by calculating intensity from the degree of staining. Intensity had a value between zero (black) and 255 (white). When the degree of staining was high, indicating high protein expression, the intensity was low, so we converted the intensity by black/white reversal (Supplemental Fig. 1). The calculated value was then corrected by subtracting the value of unstained normal pituitary, and the corrected value was defined as protein expression in each tissue (Supplemental Fig. 1).
Cell culture and treatment schedule
The mouse pituitary tumor cell line AtT-20ins, obtained from the American Type Culture Collection (Manassas, VA), was cultured in Dulbecco’s modified Eagle medium (DMEM; Life Technologies, Carlsbad, CA), supplemented with 10% fetal calf serum (FCS). AtT-20ins cells were transfected with 5, 10, or 20 nM small interfering RNA (siRNA) targeting MSH6, MSH2, or ATR (QIAGEN, Hilden, Germany), using the HiPerFect transfection reagent (QIAGEN, Hilden, Germany), and cultured them for 48 hours. As a negative control, the cells were transfected with 5 nM siRNA of AF488 (QIAGEN) as control. After 48 hours of incubation in 24- or 96-well plates under standard conditions (37°C, 5% CO2), total RNA was isolated from AtT-20ins cells in a 24-well plate using the RNeasy Mini Kit (QIAGEN), and cDNA was synthesized with the TaqMan™ Reverse Transcription Reagents (Applied Biosystems). qRT-PCR analyses, to detect mRNA levels (MSH6, MSH2, and ATR), were carried out using SYBR Green Real-Time PCR Master Mixes (Applied Biosystems), and GAPDH was used as an internal control. Primers for qRT-PCR are shown in Supplemental Table 2B. Cell proliferation assays on AtT-20ins were performed in a 96-well plate using the Cell Counting Kit-8 (Dojindo, Rockville, MD).
To establish PA cells in culture, two fresh, nonfunctioning PAs were obtained from the Operating Room in Wakayama Medical University Hospital. The tumors were mechanically dissociated in DMEM, supplemented with 10% FCS. Enzymatic digestion buffer consisted of HAM-F2 Medium (Life Technologies, Carlsbad, CA) and 1 mg/mL collagenase type IA (Sigma Chemical, St. Louis, MO). Tissue suspensions were transferred to a vial containing 5 mL digestion buffer and incubated at 37°C for 45 minutes with rotation. Tumor suspensions were then washed with 5% FCS in DMEM and passed through a 70-µm cell strainer (Falcon; Becton Dickinson Labware, Franklin Lakes, NJ). Cell suspensions were then pelleted and plated on Matrigel-coated 24- or 96-well plates at 3.5 × 10⁵ viable cells/mL in complete DMEM. To establish Matrigel-coated plates, 24-well plates were coated with 95 µL Matrigel (BD Biosciences, San Jose, CA) per well, and 96-well plates were coated with 16 µL Matrigel per well. The primary culture method was described previously (18). Once established, these human PA cells were transfected with 5, 10, or 20 nM siRNA targeting MSH6 (QIAGEN), using the HiPerFect transfection reagent and cultured for 48 hours. Next, qRT-PCR analyses were carried out to measure mRNA levels (MSH6 and ATR); GAPDH was used as an internal control. Cell proliferation assays were also performed with these human PA cells.
Statistical analysis
Data were statistically analyzed using simple linear regression analysis, unpaired t test, and one-way analysis of variance (ANOVA), followed by Dunnett’s test for multiple comparisons. Values of P < 0.05 were considered statistically significant. Analyses were performed using a commercially available statistical package (JMP Pro version 13.0; SAS Institute, Cary, NC).
Results
Expression of MSH6 and MSH2 is positively associated with Log2 TVDT
To investigate how MMR genes are involved in pituitary tumor growth, we calculated TVDT, an index of tumor growth, and performed simple linear regression analysis on the relationship between MMR gene expression and TVDT (n = 31). Expression of MSH6 and MSH2 was positively associated with Log2 TVDT (respectively, R = 0.52, P = 0.003, and R = 0.44, P = 0.01; Fig. 1), suggesting that reduction of MSH6 and MSH2 expression promotes pituitary tumor growth by shortening TVDT. However, expression of other MMR genes (MLH1, PMS2, MLH3, MSH3, PMS1, and EPCAM) was not associated with Log2 TVDT (Supplemental Fig. 2).
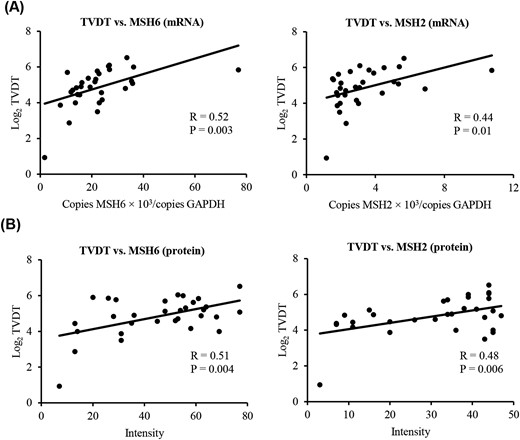
Correlation between MSH6 and MSH2 (A) mRNA/(B) protein expression and Log2 TVDT. The relationship between MMR gene expression in PAs and Log2 TVDT was examined using simple linear regression analysis. MSH6 and MSH2 expression was positively associated with Log2 TVDT (respectively, R = 0.52, P = 0.003, and R = 0.44, P = 0.01). Likewise, MSH6 and MSH2 protein levels were positively associated with Log2 TVDT (respectively, R = 0.51, P = 0.004, and R = 0.48, P = 0.006).
To investigate the association between MMR gene expression and preoperative TV and MIB-1 labeling index (LI), used as an indicator of pituitary tumor growth, we performed another simple linear regression analysis. However, we observed no significant correlation between MMR gene expression and preoperative TV or MIB-1 LI (n = 47; Supplemental Table 3). In addition, we performed simple linear regression analysis of the relationship between MMR gene expression and preoperative TV in pituitary tumor cases, taking into account the influence of recurrence vs nonrecurrence and functional vs nonfunctional pituitary tumors. Specifically, we excluded recurrent cases (n = 33), nonfunctional pituitary tumors (including recurrent cases; n = 34), and nonfunctional (but not recurrent) pituitary tumors (n = 20). We observed no significant correlation between MMR gene expression and preoperative TV (Supplemental Table 3).
MSH6 and MSH2 protein levels are positively associated with Log2 TVDT
Based on the positive association between Log2 TVDT and gene expression, we next quantified the levels of MSH6 and MSH2 to determine whether protein expression was associated with tumor growth. For this purpose, we performed simple linear regression analysis of the relationship between MSH6 and MSH2 protein levels and TVDT (n = 31). We found that MSH6 and MSH2 protein levels were positively associated with Log2 TVDT, similar to the correlation between gene expression and TVDT (Fig. 1). Taken together, our findings suggest that the reduction of MSH6 and MSH2 mRNA and protein expression could promote pituitary tumor growth by shortening TVDT.
Expression of MSH6 and MSH2 is positively associated with ATR gene expression
In HeLa cells, MSH6 and MSH2 form a complex, called MutSα, which senses DNA damage and induces cell-cycle regulation via the ATR–Chk1 pathway (12). The association between MSH6 and MSH2 and the ATR–Chk1 pathway in pituitary tumors, however, remains unknown. To address this question, we performed a simple linear regression analysis on the relationship between MSH6 and MSH2 expression and ATR expression in pituitary tumors (n = 96). MSH6 and MSH2 expression was positively associated with ATR expression (respectively, R = 0.47, P < 0.00001, and R = 0.49, P < 0.00001; Fig. 2). These results suggest that reduction of MSH6 and MSH2 expressions may result in reduction of ATR expression and may promote cell proliferation by diminishing the function of the ATR–Chk1 pathway.
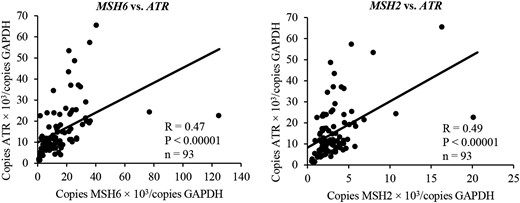
Correlation between MSH6 and MSH2 expression and ATR expression. The relationship between MSH6 and MSH2 expressions and ATR expression in PAs was examined using simple linear regression analysis. MSH6 and MSH2 expression was positively associated with ATR expression (respectively, R = 0.47, P < 0.00001, and R = 0.49, P < 0.00001).
Reduction of MSH6 and/or MSH2 expression by siRNA promotes cell proliferation by decreasing ATR expression in AtT-20ins
Next, to determine whether MSH6 and MSH2 and the ATR–Chk1 pathway affect pituitary tumor growth, we investigated the effect of MSH6 or MSH2 knockdown on ATR expression and cell proliferation in AtT-20ins.
First, we examined the effect of reduction of MSH6 or MSH2 expression on cell proliferation. When MSH6 expression was gradually decreased by siRNA, the rate of cell proliferation increased significantly [Fig. 3(A)]. Similar results were obtained with MSH2 knockdown [Fig. 3(B)]. Moreover, in double knockdowns, cell proliferation was increased further compared with either single knockdown [Fig. 3(C)]. Furthermore, although ATR expression was only slightly decreased in the single knockdowns, a substantial reduction of ATR expression was observed in the double knockdown [Fig. 3(C)]. Likewise, knockdown of ATR substantially promoted cell proliferation, although it did not substantially affect expression of MSH6 or MSH2 [Fig. 3(D)].
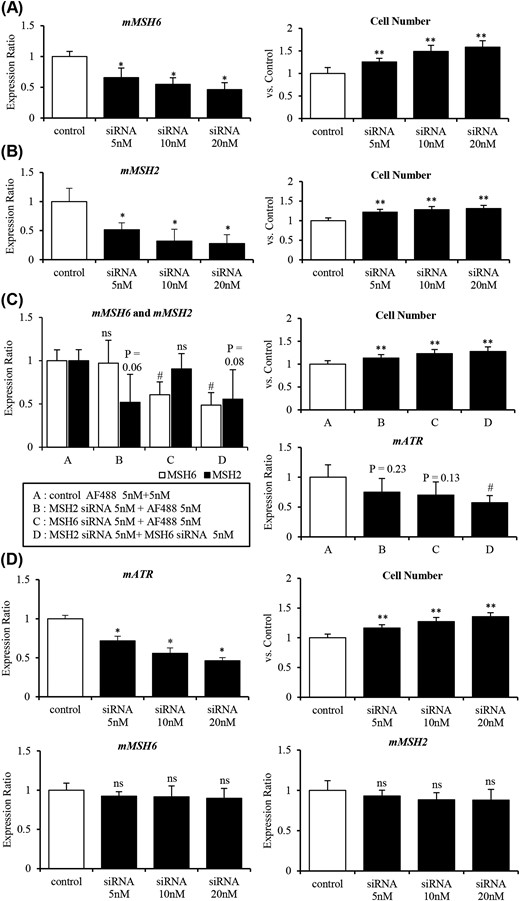
Reduction of MSH6 and/or MSH2 expression by siRNA promotes cell proliferation by decreasing ATR expression in AtT-20ins cells. (A) Knockdown of MSH6 promoted cell proliferation in AtT-20ins treated with various concentrations of siRNA targeting MSH6 (0 to 20 nM). (B) Knockdown of MSH2 promoted cell proliferation in AtT-20ins treated with various concentrations of siRNA targeting MSH2 (0 to 20 nM). (C) Knockdown of both MSH6 and MSH2 significantly decreased ATR expression and promoted cell proliferation to a greater extent than either single knockdown. (D) Knockdown of ATR expression promoted cell proliferation without significantly changing in MSH6 and MSH2 expressions in AtT-20ins treated with various concentrations of siRNA targeting ATR (0 to 20 nM). *P < 0.01 vs control (ANOVA Dunnett’s test); **P < 0.001 vs control (ANOVA Dunnett’s test); #P < 0.05 vs control (ANOVA Dunnett’s test); ns, not significant vs control (ANOVA Dunnett’s test). m, mouse.
These results showed that the reduction of MSH6 and MSH2 gene expressions in vitro led to reduction of ATR gene expression and promoted cell proliferation. This suggests that the reduction of MSH6 and MSH2 gene expressions may reduce the function of the cell regulatory mechanism ATR–Chk1 pathway through the reduction of ATR gene expression and promote cell proliferation by promoting cell-cycle progression and decreasing the rate of apoptosis in pituitary tumors.
Knockdown of MSH6 promotes cell proliferation by decreasing ATR expression in primary cultures of human nonfunctioning PAs
In primary cultures of human nonfunctional PAs, siRNA-mediated knockdown of MSH6 significantly promoted cell proliferation by decreasing ATR expression (Fig. 4). This suggests that in human pituitary tumors, reduced MSH6 expression decreases ATR expression, thereby attenuating the function of the ATR–Chk1 pathway and permitting unregulated proliferation.
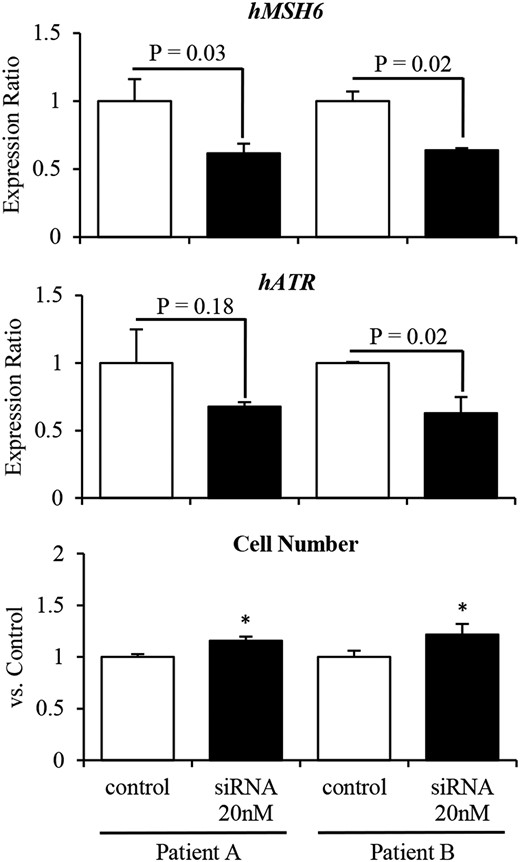
Knockdown of MSH6 expression promotes cell proliferation by decreasing ATR expression in primary cultures of two human (h) nonfunctioning PAs. siRNA-mediated knockdown of MSH6 decreased ATR expression and significantly promoted cell proliferation in primary cultures of two human nonfunctioning PAs.
Discussion
The MMR mechanism, which is governed by the MMR genes (MLH1, PMS2, MSH2, MSH6, MLH3, MSH3, PMS1, and EPCAM), corrects DNA polymerase misincorporation errors that arise during DNA replication or recombination. It also repairs some forms of DNA damage (5–8). In addition, these genes contribute to the effectiveness of immune checkpoint inhibitors against colon cancer (19). Although the roles of MMR genes have been studied extensively, the detailed mechanisms underlying their functions remain unknown. In this study, we showed that MMR genes MSH6 and MSH2 are directly involved in proliferation of pituitary tumors. Specifically, we found that reduction of MSH6 and MSH2 expression at the mRNA and protein levels promoted cell proliferation via the ATR–Chk1 pathway, a cell-cycle regulatory mechanism, in both human pituitary tumors and the pituitary tumor cell line AtT-20ins.
First, to determine whether differences in MMR gene expression (MLH1, PMS2, MSH2, MSH6, MLH3, MSH3, PMS1, and EPCAM) are involved in pituitary tumor proliferation, we investigated the correlation between MMR gene expression in human PAs and preoperative TV, MIB-1 LI, and TVDT, used as indicators of tumor proliferation. Among the MMR genes, only MSH6 and MSH2 exhibited a substantial positive correlation with TVDT. MSH6 and MSH2 protein levels also showed a similar correlation. However, preoperative TV and MIB-1 LI did not significantly correlate with MSH6 or MSH2 expression. We speculate that this is because preoperative TV is a value calculated in the pituitary tumor having different timing of tumor occurrence, whereas MIB-1 LI is a value calculated in a hot spot of a pituitary tumor; consequently, preoperative TV and MIB-1 LI may not accurately represent pituitary tumor proliferation. In the context of MMR, MSH6 and MSH2 assemble to form a complex called MutSα (5). Accordingly, we presumed that MSH6 and MSH2 also work cooperatively in pituitary tumors and are involved in tumor proliferation. We observed no correlation between the expression of other MMR genes and tumor proliferation, suggesting that MSH6 and MSH2 are directly involved in tumor proliferation.
MutSα, a complex of MSH6 and MSH2, acts as a sensor of DNA damage and induces the ATR–Chk1 pathway in HeLa cells (12). In response to a DNA damage signal, ATR is activated via phosphorylation by binding to the activator, ATR-interacting protein, and the signal is transmitted to downstream proteins Cdc25A, Cdc25C, and p53 via phosphorylation of Chk1 to induce cell-cycle arrest in S or G2 phase and cell apoptosis (13). We found that expression of MSH6 and MSH2 was significantly, positively correlated with ATR expression. Even in human pituitary tumor cells, reduction of MSH6 and MSH2 expression at the mRNA and protein level might result in dysfunction of the ATR–Chk1 pathway and promote tumor proliferation, because cell-cycle arrest and apoptosis cannot be induced efficiently.
We investigated whether the reduction in MSH6 and MSH2 expressions directly promotes cell proliferation using AtT-20ins cells. After a short incubation (48 hours), the reduction in MSH6 or MSH2 expression promoted cell proliferation. Interestingly, knockdown of both MSH6 and MSH2 promoted cell proliferation more than either single knockdown alone, suggesting that reduction of MSH6 and MSH2 expression in AtT-20ins promotes cell proliferation cooperatively.
We next investigated whether reduction of MSH6 and MSH2 gene expression affects cell-cycle regulation by the ATR–Chk1 pathway, as well as whether it is involved in cell proliferation in AtT-20ins. The reduction in MSH6 and MSH2 expression resulted in reduction of ATR expression via the ATR–Chk1 pathway and promoted cell proliferation. Furthermore, when ATR expression was decreased directly, cell proliferation was promoted in the same manner as when MSH6 and MSH2 were knocked down, although the expression of neither gene was decreased. This is in agreement with a previous report that MSH6 and MSH2 function as MutSα to induce the ATR–Chk1 pathway (12). Reduction of MSH6 and MSH2 expressions could thus promote cell proliferation by disrupting the function of the ATR–Chk1 pathway.
Finally, to determine whether similar mechanisms are preserved in humans, we examined the mechanism involved in cell proliferations observed in AtT-20ins in primary cultures of human nonfunctional PAs. As a result of limited primary cell culture, this was examined only when MSH6 expression was reduced, but as in the case of AtT-20ins, promotion of cell proliferation was accompanied by a decrease in ATR expression. This suggests that reduction of MSH6 and MSH2 expression could promote the proliferation of human pituitary tumors. As mentioned above, the ATR–Chk1 pathway induces cell-cycle arrest via various mechanisms and induces p53-mediated apoptosis (13). Our findings suggest that cell-cycle arrest and apoptosis via the ATR–Chk1 pathway might also influence the mechanism of pituitary tumor growth and specifically, that reduction of MSH6 and MSH2 expression could promote pituitary tumor cell proliferation.
In summary, we demonstrated that reduction of MSH6 and MSH2 expression at the mRNA or protein level in human pituitary tumor tissue promotes tumor proliferation by shortening TVDT. An in vitro investigation revealed that the reduction of MSH6 and MSH2 expression in pituitary tumor cells results in ATR–Chk1 pathway dysfunction, cell-cycle arrest, and inhibition of apoptosis, thereby promoting pituitary tumor proliferation (Fig. 5).
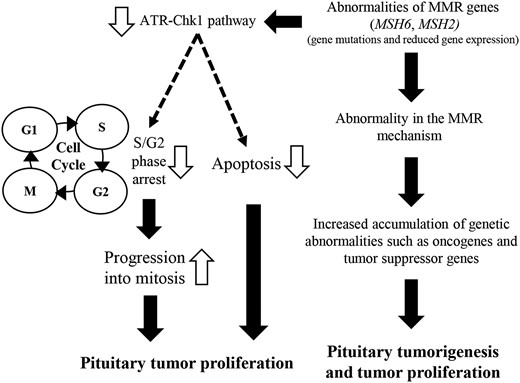
Schematic model of pituitary tumor proliferation associated with abnormal MSH6 and MSH2 expression.
On the other hand, mutation in an exon or promoter region or epigenetic alteration as a result of promoter methylation or microRNA, could decrease MSH6 and MSH2 expression (5, 20). We looked for mutations in the exon or promoter region, as well as methylation in the promoter region, but found no association between these features and gene expression (data not shown). We were unable to examine the relationship between gene expression and microRNAs. Nonetheless, it seems clear that some mechanism involved in regulating MSH6 and MSH2 expression functions in pituitary tumors, and this issue should be addressed in future studies.
It is very important to clarify whether MSH6 and MSH2 affect the proliferation of functional and nonfunctional pituitary tumors in different ways. However, a limitation of this study is that the number of samples of functional pituitary tumors was small, making it impossible to examine the relationship between MSH6 and MSH2 and each clinical or histopathological type of pituitary tumor. Another limitation was the short (48-hour) in vitro incubation time; the reduction of MSH6 and MSH2 gene expressions simultaneously decrease the function of MMR mechanism, resulting in mutations of other genes involved in tumor proliferation. We cannot exclude the possibility that these indirect mechanisms might be involved in tumor growth.
In conclusion, the reduction of MSH6 and MSH2 expression, as well as reduced expression of the encoded proteins, could be involved in both tumor development and proliferation. These effects could be mediated indirectly by the accumulation of genetic abnormalities caused by dysfunction of MMR, as well as directly via cell-cycle promotion or apoptosis reduction caused by dysfunction of the ATR–Chk1 pathway in pituitary tumors. This study partially reveals the mechanisms underlying the development and proliferation of pituitary tumors. Our findings suggest that in pituitary tumors, especially those that are aggressive, expression of MSH6 and MSH2 could be used as a predictor of proliferation; currently, few such predictive biomarkers are available. Further studies of this mechanism are necessary, especially in pituitary tumors with high proliferative ability.
Abbreviations:
- ANOVA
analysis of variance
- ATR–Chk1
ataxiatelangiectasia and Rad3-related–checkpoint kinase 1
- DMEM
Dulbecco’s modified Eagle medium
- EPCAM
epithelial cell adhesion molecule
- FCS
fetal calf serum
- GAPDH
glyceraldehyde 3-phosphate dehydrogenase
- LI
labeling index
- MLH1/3
mutL homolog 1/3
- MMR
mismatch repair
- MRI
magnetic resonance images
- mRNA
messenger RNA
- MSH2/3/6
mutS homolog 2/3/6
- PA
pituitary adenoma
- PCR
polymerase chain reaction
- PMS1/2
PMS1 homolog 1/2
- qRT-PCR
quantitative reverse transcriptase-polymerase chain reaction
- siRNA
small interfering RNA
- TV
tumor volume
- TVDT
tumor volume doubling time
Acknowledgments
Financial Support: This work was supported by a Grant-in-Aid from the Takeda Science Foundation.
Disclosure Summary:
The authors have nothing to disclose.
