


Abstract
Randomized controlled trials evaluating real-time continuous glucose monitoring (RT-CGM) patients with type 1 diabetes (T1D) show improved glycemic control, but limited data are available on real-world use.
To assess impact of RT-CGM in real-world settings on glycemic control, hospital admissions, work absenteeism, and quality of life (QOL).
Prospective, observational, multicenter, cohort study.
A total of 515 adults with T1D on continuous subcutaneous insulin infusion (CSII) therapy starting in the Belgian RT-CGM reimbursement program.
Initiation of RT-CGM reimbursement.
Hemoglobin A1c (HbA1c) evolution from baseline to 12 months.
Between September 1, 2014, and December 31, 2016, 515 adults entered the reimbursement system. Over this period, 417 (81%) patients used RT-CGM for at least 12 months. Baseline HbA1c was 7.7 ± 0.9% (61 ± 9.8 mmol/mol) and decreased to 7.4 ± 0.8% (57 ± 8.7 mmol/mol) at 12 months (P < 0.0001). Subjects who started RT-CGM because of insufficient glycemic control showed stronger decrease in HbA1c at 4, 8, and 12 months compared with patients who started because of hypoglycemia or pregnancy. In the year preceding reimbursement, 16% of patients were hospitalized for severe hypoglycemia or ketoacidosis in contrast to 4% (P < 0.0005) the following year, with decrease in admission days from 54 to 18 per 100 patient years (P < 0.0005). In the same period, work absenteeism decreased and QOL improved significantly, with strong decline in fear of hypoglycemia.
Sensor-augmented pump therapy in patients with T1D followed in specialized centers improves HbA1c, fear of hypoglycemia, and QOL, whereas work absenteeism and admissions for acute diabetes complications decreased.
Real-time continuous glucose monitoring (RT-CGM), as standalone device or in combination with an external insulin pump [continuous subcutaneous insulin infusion (CSII)], leads to improvements in HbA1c with reduced risk of hypoglycemic events, as shown in randomized controlled trials (RCTs) (1–3). New generations of so-called sensor-augmented pump (SAP) systems are able to reduce time spent in hypoglycemia by suspending insulin infusion when glucose is (predicted to be) low (4, 5).
Despite evidence from RCTs, reimbursement of RT-CGM in most countries is lacking (6, 7). Up to now, few real-world studies with RT-CGM have been conducted (8, 9) even though many health care authorities are interested in such analyses to decide on reimbursement and to select the patient population who could benefit most from such interventions (10).
Since September 2014, the Belgian health care authority has authorized the reimbursement of RT-CGM for patients with type 1 diabetes (T1D) using CSII and treated in selected specialized diabetes centers. Selection of patients was left to the discretion of the diabetes teams. Reimbursement was granted for an initial period of 3 years as a pilot program, with selected centers being legally obliged to prospectively analyze the impact of reimbursement on clinical outcome parameters, including quality of life (QOL). This uncontrolled, observational study fulfills this requirement and measured the effect of RT-CGM reimbursement on hemoglobin A1c (HbA1c), admissions for acute diabetes complications, QOL, and hypoglycemia under real-world conditions.
Materials and Methods
Study design
In this multicenter prospective observational cohort study [Reimbursement Study of Continuous Glucose Monitoring in Belgium (RESCUE) trial], data from all patients who started in the reimbursement program between September 2014 and December 2016 were analyzed. Data were collected during standardized clinical follow-up, as agreed by the centers offering RT-CGM reimbursement.
Center and patient selection
The Belgian health care authority selected 17 specialized diabetes centers based on sufficient experience with CSII, defined as having at least 50 patients on CSII. In these centers, reimbursement of RT-CGM could be offered to 25% of CSII users. Selected centers were free to decide which patients with T1D using CSII they would offer RT-CGM reimbursement. Clinicians were free to decide, but minimum criteria for selection were suggested in a nonrestrictive way by the Belgian health care authority and included diagnosed with T1D >1 year ago, using CSII therapy >6 months, difficult glycemic control (undefined), and motivated to use RT-CGM. Patients were expected to use RT-CGM >70% of the time and upload monthly their RT-CGM data. Every patient who entered the reimbursement program was included, without exception, in the RESCUE trial after informed consent. Collaborating centers and number of patients contributed by each center can be found in Supplemental Table 1.
Outcomes
Primary endpoint was evolution over time of HbA1c between baseline and 12 months after start of RT-CGM reimbursement. Secondary endpoints were effect of RT-CGM on admissions for acute diabetes complications (hypoglycemia and/or ketoacidosis), work absenteeism, QOL, glucose variability (coefficient of variation = standard deviation of the mean sensor glucose values divided by the mean sensor glucose value, reported as a percentage), percentage of time in hypoglycemia (<70 mg/dL; <3.9 mmol/L), range (70 to 180 mg/dL; 3.9 to 10 mmol/L), and hyperglycemia (>250 mg/dL; >13.9 mmol/L) (11). Other investigational outcomes were indications for RT-CGM use, social and demographic characteristics of RT-CGM users, and reasons for RT-CGM discontinuation.
Devices
A total of 337 (65%) patients used Medtronic MiniMed® Paradigm insulin pumps (Medtronic, Northridge, CA), 117 (23%) patients used Roche Accu-Chek® (Spirit or Aviva) Combo insulin pumps (Roche Diabetes Care GmbH, Mannheim, Germany), and 58 (11%) patients used Medtronic MiniMed® 640G insulin pump (Medtronic). Sensors used by patients were Medtronic MiniMed® Enlite® Sensor (Medtronic) (n = 382; 75%), Dexcom G4® PLATINUM (Dexcom, Inc, San Diego, CA) (n = 121; 24%), and FreeStyle Navigator® II (Abbott Diabetes Care, Alameda, CA) (n = 8; 2%).
Data collection
Prespecified clinical data were collected from a period of 12 months before until 14 months after start of the reimbursement program. Information about clinical parameters was collected from clinical files at baseline, 4 months, and 12 months after start of RT-CGM. HbA1c levels were averaged for prespecified time points: prereimbursement/baseline (pre = −12 months until −1 day), 4 months (±2 months), 8 months (±2 months), and 12 months (±2 months) after start of reimbursement.
Different questionnaires on patient-related outcomes were presented to patients at baseline and after 12 months, and scored manually. All questionnaires [SF-36 (12), Problem Areas in Diabetes-short form (13–15), and Hypoglycemia Fear Survey (HFS)-Worry (16, 17)] were validated in both Belgian languages (Dutch and French) and presented to patients in their mother tongue (Supplemental Table 2).
Patients were asked to keep standardized diaries. At baseline, patients were asked to report on their diabetes management and how many disease-related events they experienced in the year prior to RT-CGM reimbursement. During the study, patients were asked to report on their diabetes management and any disease-related events monthly (Supplemental Table 3). Patient-reported emergency room admissions and hospitalizations for acute diabetes complications (hypoglycemia/ketoacidosis) were validated using hospital records in the individual centers.
Self-monitoring of blood glucose (SMBG), CSII, and RT-CGM data were collected using diabetes management software from the different manufacturers (Medtronic: CareLink Pro; Roche: Accu-Chek Smartpix and Accu-Chek 360°; and Dexcom: Dexcom Studio). Data for the following time points were extracted and averaged: data from up to 12 months prior to reimbursement (only CSII and SMBG data = prereimbursement), from entry in the reimbursement program (week 0 until week 2 for RT-CGM data), 4 months (±2 months) for RT-CGM data, 8 months (±2 months) for RT-CGM data, and up to 12 months (±2 months) after start for RT-CGM data.
Indications for RT-CGM reimbursement
Indications for entering patients into the RT-CGM reimbursement system were collected using a drop-down selection list to be filled out by the clinician who included the patient in the reimbursement system (Supplemental Table 4). For the analysis, indications were grouped into major headings, being hypoglycemia (grouping patients having frequent serious hypoglycemic events, epilepsy with hypoglycemia, hypoglycemia unawareness, very unstable blood glucose, and avoiding hypoglycemia for sport and/or professional reasons), insufficient and variable glycemic control (poor glycemic control without explanation and frequent ketoacidosis), pregnancy (being pregnant or planning pregnancy), and other.
Ethics
The study protocol was approved by the coordinating institutional review board (Ethics Committee UZ Leuven) after obtaining advice from the 16 local ethical committees. The study was executed in line with the Good Clinical Practice guidelines of the Declaration of Helsinki in its latest form.
Statistical analysis
With a linear mixed model, we evaluated HbA1c, percentage of time in hypoglycemia, range, hyperglycemia, and glucose variability as a function of time, with a random effect of center to handle the correlation between patients of the same center and an unstructured covariance matrix for the four repeated measurements within the same patient. For evolution of HbA1c, values at 4, 8, and 12 months were compared with the average value from −12 months until −1 day (pre = baseline). For the evolution of percentage of time in hypoglycemia, range, hyperglycemia, and glucose variability, values at 4, 8, and 12 months were compared with the average value between start and 2 weeks. From the multivariable normal distribution implied by the linear mixed model, we derived the relation (r) between baseline HbA1c and changes in HbA1c vs baseline. Taking regression to the mean into account, the obtained correlation is not tested vs zero but vs the correlation that is already expected purely based on regression to the mean (18). By adding the main effect and the interaction with time in the linear mixed model, we verified whether the following variables moderated the changes in HbA1c: gender, age, body mass index, education level, duration of CSII therapy, previous RT-CGM use, and indication for starting RT-CGM. Age, body mass index, and duration of CSII therapy were entered as continuous predictors. A multivariable model was obtained using a backward selection approach based on the Akaike information criterion.
We evaluated whether the evolution of percentage of time in hypoglycemia, target range, and hyperglycemia depended on the indication to start RT-CGM, and on baseline HbA1c (univariable analyses).
To evaluate the evolution of the proportion of patients who reached target HbA1c (<7%; <53 mmol/mol), we used a logistic regression model with generalized estimating equations. Tukey corrections for multiple testing were applied for pairwise comparisons between time points, in the linear mixed models as well as in the logistic regression model.
Paired t tests were used to analyze changes in QOL between baseline and 12 months on subjects with information at both time points. Applying a Bonferroni correction, the α level was set at 0.005. To facilitate interpretation, Cohen d effect sizes are reported (19). Differences in change of QOL measures were analyzed using independent-samples t test or one-way analysis of variance.
With the McNemar test, proportions of patients with work absenteeism and with admissions due to hypoglycemia/ketoacidosis were compared between 1 year prior to reimbursement and the 12-month follow-up period. Differences in admission days and work absenteeism per 100 patient years were assessed with the Wilcoxon signed-rank test. For these analyses, using Bonferroni correction, the two-sided α-significance level was set at 0.006. Patients who were incapable of working because of disability were excluded in the latter analysis.
Statistical analyses were performed with SPSS software for Windows (IBM SPSS Statistics version 23, Armonk, NY) or with SAS software for Windows (version 9.4, SAS Institute, Cary, NC).
Results
Patient characteristics
Between September 2014 and December 2016, 515 patients with T1D on CSII benefited from the reimbursement of RT-CGM in 17 specialized diabetes centers in Belgium. Over this period, 417 (81%) patients had ≥12-month follow-up, 46 (9%) had <12-month follow-up, and 52 (10%) patients stopped using RT-CGM. An overview of patients in the reimbursement program can be found in Supplemental Fig. 1. Characteristics of patients are shown in Table 1. Most patients were female (n = 299, 59%), highly educated (n = 296, 64%), and Caucasian (n = 493, 97%), with a long history of T1D, and 5.7 ± 4.6 years of CSII use at baseline. Forty-two percent of patients had limited experience with RT-CGM before reimbursement (n = 215; median of 5 months, 95% confidence interval 3 to 24). Thirty-five percent of patients (n = 180) had one or more microvascular complication, and 5% (n = 25) had macrovascular complications. Impaired awareness of hypoglycemia was common (n = 238, 47%). Mean baseline HbA1c was 7.6 ± 0.9% (60.0 ± 9.8 mmol/mol).
Baseline Characteristics of Adult Patients in RT-CGM Reimbursement Program
| Adult Patients in the RT-CGM Reimbursement Program (n = 515) | |
|---|---|
| General characteristics | |
| Female | 299 (59%) |
| Caucasian | 493 (97%) |
| Age (y) | 42.2 (12.5) |
| BMI (kg/m2) | 25.3 (3.8) |
| Education | |
| Highera | 296 (64%) |
| No higher | 166 (36%) |
| Living alone | 59 (12%) |
| Diabetes-related characteristics | |
| Diabetes duration (y) | 22.3 (11.6) |
| Age at diagnosis (y) | 19.3 (11.4) |
| Insulin pump therapy | 515 (100%) |
| Duration (y) | 5.7 (4.6) |
| Microvascular complications | 180 (35%) |
| Retinopathy | 149 (29%) |
| Neuropathyb | 79 (15%) |
| Nephropathy | 53 (10%) |
| Macrovascular complications | 25 (5%) |
| Acute myocardial infarction | 11 (2%) |
| Peripheral arterial disease | 7 (1%) |
| Cerebrovascular accident | 5 (1%) |
| Heart failure | 2 (0.4%) |
| Impaired awareness of hypoglycemiac | 238 (47%) |
| Symptoms <50 mg/dL (2.8 mmol/L) | 172 (34%) |
| No symptoms <50 mg/dL (2.8 mmol/L) | 66 (13%) |
| HbA1c (%) | 7.6 (0.9) |
| HbA1c (mmol/mol) | 60 (9.8) |
| Average glycemia (mg/dL)d | 163 (27) |
| Self-reported daily home glucose-meter readings (number per day)c | 5.2 (1.9) |
| Average percentage of blood glucose readings per dayd | |
| <50 mg/dL (2.8 mmol/L) (%) | 2.6 (2.5) |
| <70 mg/dL (3.9 mmol/L) (%) | 11.1 (5.7) |
| 70–180 mg/dL (3.9–10 mmol/L) (%) | 52.1 (12.5) |
| >180 mg/dL (10 mmol/L) (%) | 36.1 (13.3) |
| >250 mg/dL (13.9 mmol/L) (%) | 15.4 (9.7) |
| RT-CGM–related characteristics | |
| Indication for RT-CGM therapy | |
| Hypoglycemia | 289 (56%) |
| Insufficient and variable glycemic control | 132 (26%) |
| Pregnancy | 66 (13%) |
| Other | 29 (6%) |
| RT-CGM use before reimbursement | |
| No | 300 (58%) |
| Yes | 215 (42%) |
Data are mean (standard deviation) or n (%).
Abbreviation: BMI, body mass index.
Defined as graduated from university.
Peripheral and/or autonomic neuropathy.
Based on questionnaire filled out by patients or the clinical team.
Average value based on blood glucose readings in 12 months prior to reimbursement.
The main indication to start RT-CGM therapy was hypoglycemia (n = 289, 56%), followed by insufficient and variable glycemic control (n = 132, 26%) (Supplemental Table 4).
Patients used RT-CGM 87.5 ± 8.2% of time over the 12-month period. Most frequent reasons for discontinuation were related to the system itself, such as alarm fatigue (n = 18, 35%). Other reasons were <70% usage of RT-CGM (n = 17, 33%), local and/or technical problems (n = 16, 31%), and no apparent benefit for patient and/or physician (n = 12, 23%).
Evolution of HbA1c after introduction of RT-CGM reimbursement
In terms of primary outcome, HbA1c was significantly lower at 12 months [7.4 ± 0.8% (57.0 ± 8.7 mmol/mol)] compared with baseline [7.7 ± 0.9% (61.0 ± 9.8 mmol/mol), P < 0.0001] for the total population [Fig. 1(a)]. The proportion of patients who achieved HbA1c <7% (<53 mmol/mol) increased from 23% to 33% at 12 months (P = 0.001). A stronger decrease in HbA1c was observed in patients with higher baseline HbA1c, but only at 4 months this correlation exceeded the regression to the mean effect (r = −0.49, P = 0.0002) [Fig. 1(b)]. At each time point, the changes vs baseline differed significantly between the groups defined by indication for entering the RT-CGM program (P < 0.0001) [Fig. 1(c)]. In the subgroup of patients who were using RT-CGM because of insufficient and variable glycemic control, HbA1c decreased from 8.2 ± 0.9% (66.0 ± 9.8 mmol/mol) before reimbursement to 7.6 ± 0.8% (60.0 ± 8.7 mmol/mol) after 12 months (P < 0.0001), whereas patients who were using RT-CGM because of hypoglycemia had a slight decrease in HbA1c from 7.5 ± 0.8% (58.0 ± 8.7 mmol/mol) to 7.4 ± 0.8% (57.0 ± 8.7 mmol/mol) (P = 0.001). As expected, women who used RT-CGM because of ongoing or planned pregnancy had the lowest baseline HbA1c [7.2 ± 0.7% (55.0 ± 7.7 mmol/mol)], yet they managed to decrease it even further to 6.6 ± 0.7% (49.0 ± 7.7 mmol/mol) at 4 months (P < 0.0005), after which it increased to 6.9 ± 0.9% (52.0 ± 9.8 mmol/mol) at 12 months (P = 0.029 between 4 and 12 months) [Fig. 1(c)].
![Evolution of HbA1c from before until 12 months after start of the RT-CGM reimbursement program. Data points represent mean (standard error) of HbA1c measurements per time point for (a) the total population, (b) as a function of baseline HbA1c, and (c) divided per indication to start RT-CGM therapy. Numbers under the graphs represent number of patients who had data at the specific time point. Note that in (c), the 14 subjects who entered the RT-CGM program for other reasons are not included in the figure. In (b), the model-based predictions (obtained from the multivariate normal distribution) are averaged within the groups with baseline values >8% (>64 mmol/mol), 7% to 8% (53 to 64 mmol/mol), and <7% (<53 mmol/mol), respectively. ***P < 0.001; **P < 0.01; and *P < 0.05 for the comparisons between HbA1c before reimbursement and the time points after start (a, c). §§§P < 0.001; §§P < 0.01; and §P < 0.05 for the relation between the variable and the change vs baseline [i.e., test if the correlation between baseline HbA1c and the change in HbA1c exceeds the regression to the mean effect in (b); test for the interaction term in (c)].](https://oup.silverchair-cdn.com/oup/backfile/Content_public/Journal/jcem/103/3/10.1210_jc.2017-02498/1/m_jc.2017-02498f1.jpeg?Expires=1716321059&Signature=li9SHAP0cLmgPT1OUQcifMigqxWF9s~Q7w6vKszVxAavoTFpW1oYPvof7ziPwSDsdjkGLEYkhBVHjb7c3CmMReLMzRXNc9jrj~vw69v-zBWOtcqxLHJZp2H22OcjVTT3OiqYx5yGYF0GeL07weiSBmIps11JtAoTbxEEFGceIkPrQAgAy4wCtXrrp8ZX5itAhWvYHfwXIrP3Mo~oQ-eJ77vHsLtN0ZmzhFH5kLj9W9rvJjTgAcfhe1rC~Wo2V~05BzNcldwMJfVATVmYklcSuA1eNvLVLB7GyM9dUH1MgPTbzE9NbTYvbn6NECZLNsx-jiBLt7CrMTSwaNj4ePu29g__&Key-Pair-Id=APKAIE5G5CRDK6RD3PGA)
Evolution of HbA1c from before until 12 months after start of the RT-CGM reimbursement program. Data points represent mean (standard error) of HbA1c measurements per time point for (a) the total population, (b) as a function of baseline HbA1c, and (c) divided per indication to start RT-CGM therapy. Numbers under the graphs represent number of patients who had data at the specific time point. Note that in (c), the 14 subjects who entered the RT-CGM program for other reasons are not included in the figure. In (b), the model-based predictions (obtained from the multivariate normal distribution) are averaged within the groups with baseline values >8% (>64 mmol/mol), 7% to 8% (53 to 64 mmol/mol), and <7% (<53 mmol/mol), respectively. ***P < 0.001; **P < 0.01; and *P < 0.05 for the comparisons between HbA1c before reimbursement and the time points after start (a, c). §§§P < 0.001; §§P < 0.01; and §P < 0.05 for the relation between the variable and the change vs baseline [i.e., test if the correlation between baseline HbA1c and the change in HbA1c exceeds the regression to the mean effect in (b); test for the interaction term in (c)].
In the multivariable analysis, only the indication for entering the RT-CGM reimbursement system was an independent predictor of changes in HbA1c at all follow-up moments (P < 0.0001) (Supplemental Fig. 2).
Change of acute hospital admissions and work absenteeism after introduction of RT-CGM reimbursement
The number of patients who were admitted to emergency room or hospital because of severe hypoglycemia and/or ketoacidosis decreased from 16% the year prior to RT-CGM initiation to 4% during the year in the program (P < 0.0005). The average number of days of diabetes-related hospital admissions per 100 patient years over 12 months was significantly reduced compared with the 12-month period prior to reimbursement (54 at baseline vs 18 days per 100 patient years, P < 0.0005), with greatest benefit seen in hypoglycemia-related admissions. The number of patients reporting diabetes-related work absenteeism decreased (123 vs 36 patients, P < 0.001), with less absenteeism days (from 495 to 234 days per 100 patient years after 12 months, P = 0.001) (Table 2).
Evolution of Diabetes-Related Hospital Admissions and Work Absenteeism
| Before Reimbursement (n = 496) | 12 Months of Reimbursement (n = 379) | P Value | |
|---|---|---|---|
| Patients with | |||
| Hospitalizations due to hypoglycemia and/or ketoacidosis | 77 (16%) | 14 (4%) | <0.0005 |
| Hospitalizations due to hypoglycemia | 59 (11%) | 12 (3%) | <0.0005 |
| Hospitalizations due to ketoacidosis | 23 (5%) | 4 (1%) | 0.092 |
| Work absenteeisma | 123 (25%) | 36 (9%) | <0.0005 |
| Days (per 100 patient years) of | |||
| Hospitalizations due to hypoglycemia and/or ketoacidosis | 53.5 | 17.8 | <0.0005 |
| Hospitalizations due to hypoglycemia | 38.5 | 12.5 | 0.001 |
| Hospitalizations due to ketoacidosis | 14.9 | 5.3 | 0.220 |
| Work absenteeism | 494.5 | 233.8 | 0.001 |
Data are n (%).
Work absenteeism of at least half a day. Patient-reported hospital admissions were validated by clinicians.
Change in QOL after introduction of RT-CGM reimbursement
Completion rate of questionnaires was 87% both at baseline and after 12 months. Patients who filled out QOL questionnaires at both time points did not differ significantly in QOL at baseline from patients who filled out the questionnaire only once. After 12 months of reimbursement, a significant change in all but one general measures of QOL was observed. Both diabetes-specific measures (Problem Areas in Diabetes-short form and HFS-II Worry) were significantly improved at 12 months (Table 3). Based on effect sizes, improvement in QOL was largest in patients who had problems with hypoglycemia, and weakest in patients with insufficient and variable glycemic control (Table 3) as indication for implementing RT-CGM, especially for general health, social functioning, and HFS-II Worry.
QOL Outcomes
| Total Population | Indication for RT-CGM: Hypoglycemia | Insufficient and Variable Glycemic Control | |||||||||||
|---|---|---|---|---|---|---|---|---|---|---|---|---|---|
| Before Reimbursement (n = 448) | 12 Months of Reimbursement (n = 362) | P Value | Effect Sizea | Before Reimbursement (n = 262) | 12 Months of Reimbursement (n = 220) | P Value | Effect Sizea | Before Reimbursement (n = 108) | 12 Months of Reimbursement (n = 86) | P Value | Effect Sizea | P Valueb | |
| SF-36 | |||||||||||||
| Physical functioning | 79.4 (21.1) | 82.7 (21.2) | <0.0005 | 0.16 | 79.7 (21.1) | 83.3 (20.7) | <0.0005 | 0.17 | 75.1 (23.1) | 80.3 (22.3) | 0.002 | 0.23 | 0.401 |
| Role-physical | 62.5 (27.1) | 68.0 (26.8) | <0.0005 | 0.20 | 61.9 (27.0) | 69.0 (27.1) | <0.0005 | 0.26 | 60.0 (27.5) | 63.3 (26.6) | 0.211 | 0.12 | 0.209 |
| Bodily pain | 71.8 (26.2) | 74.4 (27.0) | 0.033 | 0.10 | 71.1 (25.8) | 74.7 (26.7) | 0.020 | 0.14 | 67.7 (28.8) | 69.2 (28.5) | 0.569 | 0.05 | 0.484 |
| General health | 49.5 (21.5) | 54.1 (22.5) | <0.0005 | 0.21 | 49.4 (21.5) | 56.3 (22.4) | <0.0005 | 0.32 | 47.6 (21.4) | 48.6 (22.5) | 0.644 | 0.05 | 0.016 |
| Vitality | 54.5 (19.3) | 57.4 (19.5) | 0.003 | 0.15 | 54.9 (19.3) | 59.0 (19.1) | 0.002 | 0.21 | 54.3 (19.6) | 54.4 (20.1) | 0.962 | 0.01 | 0.078 |
| Social functioning | 70.0 (26.1) | 76.3 (24.9) | <0.0005 | 0.24 | 69.1 (26.2) | 77.7 (24.3) | <0.0005 | 0.33 | 69.9 (26.3) | 72.0 (25.0) | 0.407 | 0.08 | 0.038 |
| Role-emotional | 70.8 (28.1) | 76.4 (26.7) | <0.0005 | 0.20 | 69.9 (27.8) | 76.7 (27.3) | 0.001 | 0.24 | 69.2 (30.4) | 74.0 (28.3) | 0.170 | 0.16 | 0.623 |
| Mental health | 65.2 (17.8) | 68.8 (18.1) | <0.0005 | 0.20 | 64.3 (17.6) | 68.8 (17.6) | <0.0005 | 0.26 | 67.7 (19.1) | 68.4 (19.7) | 0.747 | 0.04 | 0.110 |
| PAID-SF | 7.7 (4.9) | 6.6 (4.7) | <0.0005 | 0.22 | 7.7 (4.8) | 6.2 (4.5) | <0.0005 | 0.31 | 8.4 (5.3) | 7.6 (5.0) | 0.110 | 0.15 | 0.243 |
| HFS Worry | 18.6 (10.5) | 15.1 (9.5) | <0.0005 | 0.33 | 19.4 (10.8) | 15.4 (9.9) | <0.0005 | 0.47 | 15.4 (8.9) | 14.4 (8.7) | 0.381 | 0.11 | 0.018 |
Data are mean (standard deviation).
Abbreviations: PAID-SF, Problem Areas in Diabetes–Short Form; SF-36, Short Form 36.
Effect size indicates a small effect (0.1–0.3), a medium effect (0.3–0.5), or a large effect (>0.5).
P value for the difference between patients with indication for RT-CGM: hypoglycemia and insufficient and variable glycemic control.
Change of time in hypoglycemia, range, and hyperglycemia after introduction of RT-CGM reimbursement
In the total population, the percentage of measurements <70 mg/dL (3.9 mmol/L) based on SMBG data was on average 11.1 ± 5.7% 1 year before RT-CGM reimbursement (Supplemental Fig. 3). Using RT-CGM data, the percentage of measurements <70 mg/dL (3.9 mmol/L) was 5.6 ± 3.8% in the first 2 weeks, with a decline to 4.5 ± 3.2% after 12 months (P = 0.002) [Supplemental Fig. 3(a)]. This decline was seen independent of baseline HbA1c [Supplemental Fig. 3(b)] or indication to start RT-CGM reimbursement [Supplemental Fig. 3(c)].
In contrast to time spent in hypoglycemia, time in range (70 to 180 mg/dL; 3.9 to 10 mmol/L) or hyperglycemia (>250 mg/dL; >13.9 mmol/L) was greatest in the first weeks after start of reimbursement, with a worsening afterward (Fig. 2; Supplemental Fig. 3).
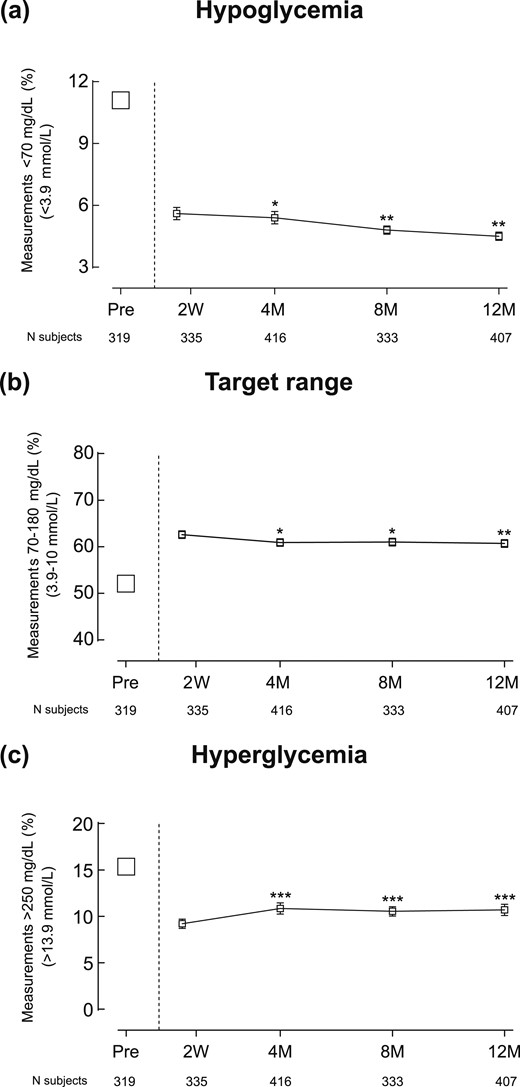
Evolution of time in hypoglycemia, range, and hyperglycemia before and until 12 months after start of the RT-CGM reimbursement program. Symbols represent mean percentage of SMBG measurements (a) <70 mg/dL (3.9 mmol/L), (b) 70 to 180 mg/dL (3.9 to 10 mmol/L), and (c) >250 mg/dL (13.9 mmol/L) before reimbursement and serve as a reference point. Connected data points represent mean (standard error) percentage of RT-CGM measurements (a) <70 mg/dL (3.9 mmol/L), (b) 70 to 180 mg/dL (3.9 to 10 mmol/L), and (c) >250 mg/dL (13.9 mmol/L) at the different time points after start of reimbursement. Numbers under the graphs represent number of patients who had data at the specific time point. ***P < 0.001; **P < 0.01; and *P < 0.05 for the comparisons between RT-CGM data point at 2 weeks and the later RT-CGM data points.
Glucose variability, as measured by mean coefficient of variation (95% confidence interval) of RT-CGM readings, slightly decreased from 38.7% (38.0 to 39.4) in the first 2 weeks to 37.9% (37.2 to 38.6) at 12 months (P = 0.02).
Discussion
Results from our observational real-world cohort study show that nationwide reimbursement of RT-CGM in specialized diabetes centers for patients with T1D using CSII resulted in lower HbA1c, less hospital admissions for acute diabetes complications, and improvement in QOL.
We observed a clinically significant 0.3% (3.3 mmol/mol) reduction in HbA1c after 12 months for the total population. This demonstrates that a similar magnitude of HbA1c reduction as reported in RCTs can be achieved in real-world conditions. The SWITCH Study comparing SAP to CSII showed a 0.5% (5.5 mmol/mol) decrease in HbA1c after 6 months in patients using RT-CGM >70% of the time (20), and in the STAR 3 trial patients using SAP had a 0.8% (8.7 mmol/mol) lower HbA1c at 12 months than those using multiple daily insulin injections and SMBG (2). In line with the recent consensus statement (11), our trial reports on time in hypoglycemia, time in range, and glucose variability. A continued decrease in time in hypoglycemia was observed after the first weeks of RT-CGM use at the price of only a slight decrease in time in range. This indicates that longer use of RT-CGM helps in preventing hypoglycemic events, which is important in a patient population that was selected mainly on the basis of problematic hypoglycemia.
Hospital admissions for acute diabetes complications decreased significantly, in particular for severe hypoglycemia, to a similar extent as described with SAP with low glucose-suspend function (21). Taking into account a mean cost of €4,733 per hospitalization (source University Hospitals Leuven), it represents a nationwide cost reduction of €345,509 during the RESCUE trial period. Most RCTs do not assess the effect on such hospitalizations because usually patients with these events in their recent history are excluded. In addition, few real-world studies with RT-CGM have been conducted that investigated the effect on hospitalizations. In the INTERPRET Study, a 12-month multinational real-world study on SAP, incidence of hospital admissions due to hypoglycemia even increased, possibly explained by low sensor usage (∼30%) (8). Of interest, we also observed a decline in work absenteeism, which is a less visible (but substantial) financial burden to society (22).
Patients in the RESCUE trial had a sensor usage of 87.5%, which is more than in many RCTs (1–3, 23, 24), and in a study on real-world use based on the CareLink database (25). We believe that an important motivator for patients in our real-world setting to use the sensor >70% of the time, as suggested by guidelines (26), was that this was a prerequisite for prolongation of reimbursement clearly stipulated at start of the program to each patient. We believe that this also contributed to the very low discontinuation rate of RT-CGM use in our study, which is lower than observed in the T1D Exchange Clinic Registry (27), in which 44% of patients reported discontinuing RT-CGM use within 1 year. Possible reasons for this difference might be that patients were aware that stopping RT-CGM would mean giving up the possibility of RT-CGM reimbursement for at least 3 years. Also, half of patients in our study had impaired awareness of hypoglycemia and were dependent on RT-CGM for managing their hypoglycemic episodes.
In this study, QOL was prospectively evaluated in a large real-world T1D population on RT-CGM and CSII using validated questionnaires. Compared with a European study that evaluated QOL in adults with T1D on CSII or multiple daily insulin injections, patients in the RESCUE trial had a lower overall perceived health status at baseline (28). Additionally, almost half of the patients in the RESCUE trial reported problematic emotional distress (15). QOL improved and fear for hypoglycemia decreased in the total population, but most dramatically in those who started RT-CGM because of hypoglycemia.
The RESCUE trial originated from a unique quality control requirement imposed by the Belgian health care authorities, linking reimbursement of RT-CGM to a preplanned analysis of the results and their publication in a peer-reviewed journal. Payers are often reluctant to promote wider use of RT-CGM, due to its substantial cost. Therefore, generally only a small proportion of patients with T1D has access to reimbursement based on criteria that vary per health insurance system (6, 7, 26, 29, 30). In the Belgian reimbursement system, diabetes teams were free in choosing patients, but available funding was limited to a fixed number of patients (∼500 nationwide). This unique situation forced the diabetes teams to choose the patients whom they thought would benefit most from RT-CGM. The teams, independently from each other or from predefined criteria, mainly selected patients who suffered from hypoglycemia, differing from another real-world study in which glycemic instability and persistently high HbA1c were the main indications to start SAP therapy (8). We believe our data confirm the validity of the Belgian strategy, as clinical teams eventually selected highly motivated patients, who derived a high benefit from the technology.
This study has limitations. First, because it is a nonrandomized observational trial, it is possible that factors other than RT-CGM use (e.g., training, education, and more intense contact with health care professionals when starting RT-CGM therapy) contributed to the observed benefits. Second, because of its observational nature, it did not have a prospective control group. However, by having patients as their own controls, the study was able to show benefits linked to the introduction of RT-CGM. A third weakness is the unavailability of blinded RT-CGM measurements before start of reimbursement, making it impossible to compare time spent in hypoglycemia, range, and hyperglycemia before and after reimbursement. Finally, patients and diabetes teams were free in choosing which combination of insulin pump and sensor they would use. This resulted in a wide variety of combinations across the program, making it impossible to study the effectiveness of one RT-CGM device or to compare different devices.
In conclusion, nationwide reimbursement of RT-CGM for selected patients with T1D using CSII in specialized diabetes centers improved glycemic control and lowered risk of acute diabetes-related hospitalizations. Additionally, it decreased fear of hypoglycemia and led to higher QOL. These results support the benefit of RT-CGM use in a real-world setting.
Abbreviations:
- CSII
continuous subcutaneous insulin infusion
- HbA1c
hemoglobin A1c
- HFS
Hypoglycemia Fear Survey
- QOL
quality of life
- RESCUE
Reimbursement Study of Continuous Glucose Monitoring in Belgium
- RCT
randomized controlled trial
- RT-CGM
real-time continuous glucose monitoring
- SAP
sensor-augmented pump
- SMBG
self-monitoring of blood glucose
- T1D
type 1 diabetes.
Acknowledgments
We thank the data nurses and the local investigators and teams for monitoring the patients, completing the case reporting files, and collecting data. A complete list of investigators in the Reimbursement Study of Continuous Glucose Monitoring in Belgium (RESCUE) trial is available in Supplemental Material.
Financial Support: This work was supported by project 17502 “Close,” a European Institute of Innovation and Technology Health project. S.C. received a doctoral grant strategic basic research from the Fonds Wetenschappelijk Onderzoek (Research Foundation–Flanders, 1S13517N).
Clinical Trial Information: ClinicalTrials.gov no. NCT02601729 (registered 11 September 2015).
Author Contributions: P.G. and C.M. designed the study, analyzed and discussed the data, and wrote the manuscript. S.C. collected and analyzed the data, performed statistical analyses, wrote the manuscript, and made figures and tables. F.N., C.D.B., R.P.R., M.P.H., Y.T., C.V., G.T., L.C., and B.K. collected and discussed the data and edited the manuscript. S.F. performed statistical analyses and edited the manuscript. P.G. is the guarantor of this work and, as such, had full access to all the data in the study and takes responsibility for the integrity of the data and accuracy of the data analysis.
Disclosure Summary: The authors have nothing to disclose.
References
National Institute for Health and Care Excellence (NICE). Type 1 diabetes in adults: diagnosis and management. NICE guideline [NG17]. Available at: https://www.nice.org.uk/guidance/ng17. Accessed 20 June 2017.
Zorginstituut Nederland. Real time continue glucose monitoring voor meer diabetespatiënten in basispakket. Available at: https://www.zorginstituutnederland.nl/actueel/nieuws/2017/06/09/real-time-continue-glucose-monitoring-voor-meer-diabetespatienten-in-basispakket. Accessed 20 June 2017.
