


Abstract
Proprotein convertase subtilisin/kexin type 9 (PCSK9) is a key regulator of low-density lipoprotein cholesterol (LDL-C) concentrations. In patients with severe obesity, biliopancreatic diversion with duodenal switch (BPD-DS) surgery induces substantial weight loss and influences lipoprotein metabolism. The effect of BPD-DS on PCSK9 levels is unknown.
To determine the acute and chronic impact of BPD-DS on PCSK9 levels and whether the acute impact of BPD-DS could be explained by BPD-DS–associated caloric restriction (CR).
PCSK9 levels were measured in 20 men and 49 women (age, 41.5 ± 11.1 years) with severe obesity before, 24 hours, 5 days, and 6 and 12 months after BPD-DS and in a comparable control group (n = 31) at baseline and at 6 and 12 months. PCSK9 levels were also measured during 3-day CR in patients (n = 7) with severe obesity and type 2 diabetes.
PCSK9 levels increased 13.4% after 24 hours (248.7 ± 64.8 to 269.7 ± 63.8 ng/mL; P = 0,02) and decreased 9.5% at 12 months compared with baseline (217.6 ± 43.0 ng/mL; P < 0,0001). LDL-C levels decreased 36.2% after 24 hours (2.6 ± 0.7 to 1.7 ± 0.6 mmol/L; P < 0.0001) and 30% at 12 months compared with baseline (1.7 ± 0.5 mmol/L; P < 0.0001). Compared with baseline levels, PCSK9 levels were lower at day 2 but not at day 1 or 3 after CR.
BPD-DS is associated with acute increases in PCSK9 levels that do not appear to be explained by CR but may be due to an acute response following surgery. BPD-DS induces chronic reductions in both PCSK9 and LDL-C levels.
The prevalence of severe obesity is increasing globally (1). A high proportion of patients with severe obesity are insulin resistant and dyslipidemic and are at increased risk for type 2 diabetes (T2D) and cardiovascular disease (CVD) (2, 3). Bariatric surgery is the only established treatment leading to long-term extensive and durable weight loss, as well as a sustainable remission/improvement of comorbidities associated with excess body weight in most patients (4). Over the past several years, many bariatric surgery procedures have been shown to improve insulin sensitivity and the cardiometabolic risk profile of patients with severe obesity. Sleeve gastrectomy, Roux-en-Y gastric bypass surgery (RYGB), and biliopancreatic diversion with duodenal switch (BPD-DS) surgery are the most effective surgeries for sustainable weight loss and resolution of comorbidities (5, 6). Data from the Swedish Obesity Study have suggested that patients undergoing bariatric surgery could benefit from a 53% reduction in cardiovascular mortality compared with severely obese individuals who did not undergo bariatric surgery (7). A recently published meta-analysis has shown that contemporary bariatric surgery is associated with an improvement in the lipoprotein-lipid profile (8). However, the biological mechanisms underlying dyslipidemia resolution following bariatric surgery remain unclear.
Large-scale genetic association studies and family-based investigations have identified a pivotal role for proprotein convertase subtilisin/kexin type 9 (PCSK9) in the regulation of plasma cholesterol levels (9, 10). PCSK9 is secreted by the liver, binds to and targets the low-density lipoprotein (LDL) receptor for lysosomal degradation, thereby decreasing LDL receptor density on hepatocytes (11, 12). A recent study demonstrated that elevated plasma PCSK9 concentrations are associated with future risk for CVD even after adjustments for established CVD risk factors (13). Factors that regulate PCSK9 expression and secretion are not well understood. Plasma PCSK9 levels can be influenced by insulin levels in humans. Although some in vitro and in vivo studies in rodents have suggested an association between insulin and PCSK9 gene expression (14, 15), whether this association is causal in humans is unknown (16, 17). Additionally, several studies have also shown that statin therapy increases PCSK9 levels (18).
We have recently shown that a 1-year lifestyle modification program that included both improvements in physical activity levels and dietary quality failed to influence plasma PCSK9 levels in patients with abdominal obesity and patients with coronary artery disease (19, 20). In patients with coronary artery disease, we unexpectedly found that patients treated with hypolipidemic agents who decreased their amount of visceral fat and increased their cardiorespiratory fitness levels had higher PCSK9 levels at the end of the 1-year lifestyle modification program compared with baseline levels (20). However, the effects of interventions that lead to greater weight loss and substantial metabolic changes, such as bariatric surgery, on plasma PCSK9 levels are unknown.
The objective of our study was to determine the acute and long-term impact of bariatric surgery on plasma lipid-lipoprotein profile and PCSK9 levels in patients with severe obesity. We also sought to determine whether the acute impact of bariatric surgery on plasma PCSK9 could be explained by bariatric surgery–associated caloric restriction (CR).
Material and Methods
Study participants
Patients were recruited at the bariatric surgery clinic of the Institut universitaire de cardiologie et de pneumologie de Québec, as previously described (21). A total of 69 randomly selected men and women with severe obesity [body mass index (BMI) ≥ 40 or ≥ 35 kg/m2 with associated comorbidities] who were 18 years of age or older were included in this study. A control group that included 31 participants, also with severe obesity, was randomly selected from the waiting list to match patients in the BPD-DS group for age and sex. Blood samples were obtained before BPD-DS surgery (baseline), 1 and 5 days after surgery, and 6 and 12 months after surgery. For the control group, blood samples were obtained at baseline and at 6 and 12 months. The ethics committee of the Institut universitaire de cardiologie et de pneumologie de Québec approved the protocol, and all patients gave their written informed consent before being included in the study.
Anthropometric measurements
Weight, BMI, fat mass, and fat-free mass were measured with an electrical bioimpedance balance (TBF-310; Tanita, Tokyo, Japan) after a 12-hour fast. Medical history and pharmacotherapy were collected from clinical file consultations for the presence of diabetes, hypertension, CVD, and dyslipidemia.
Plasma lipid-lipoprotein profile
After a 12-hour overnight fast, blood samples were collected into Vacutainer tubes containing EDTA for the measurement of plasma lipid and lipoprotein levels (BD, Franklin Lakes, NJ). Plasma was then divided into aliquots in microtubes and stored at −80°C until analysis. Hemoglobin A1c (HbA1c) was measured in fresh samples by turbidimetric inhibition immunoassay. Assays were performed in the hospital clinical biochemistry laboratory using standard methods (fasting plasma glucose, cholesterol, triglyceride, and high-density lipoprotein cholesterol [HDL-C]) or in the research laboratory. LDL cholesterol (LDL-C) concentration was calculated by using the Friedewald formula. Apolipoprotein B levels were measured by immunoturbidimetric method (Integra 800 System; Roche Diagnostics, Indianapolis, IN). Plasma cholesterol, triglyceride, HDL-C, and glucose were measured by using colorimetric enzymatic kits (cholesterol, triglycerides, and HDL-C: Roche Diagnostics; glucose: Wako Chemicals, Richmond, VA). Plasma insulin and adiponectin levels were measured by enzyme-linked immunosorbent assay (ELISA) kit (Crystal Chem Inc., Downers Grove, IL). Homeostatic model assessment of insulin resistance was calculated from fasting plasma insulin and glucose levels as (insulin × glucose)/22.5, where the insulin concentration is reported as milliunits per liter and glucose as millimolar concentrations. PCSK9 levels were measured by ELISA (R&D Systems, Minneapolis, MN).
CR study
Eight patients with T2D and severe obesity (three men and five women) who were eligible for BPD-DS surgery were selected for the CR substudy as previously described (22). All participants had stable weight for 2 months before inclusion. Approximately 2 months before surgery, patients underwent a CR protocol during which energy intake matched the average quantity of food ingested routinely after BPD-DS. During this CR protocol, patients were administered a mixed intravenous solution (NaCl 0.9% at 30 mL/h and dextrose 5% at 60 mL/h). Patients who undergo bariatric surgery receive saline plus dextrose infusions to avoid postsurgery dehydration. To avoid any residual effect of this compound, we administered saline plus dextrose infusions during the CR protocol to make sure that the only differences between treatments were the surgery itself and not the saline plus dextrose infusions. Plasma PCSK9 levels were measured in seven of these patients after an overnight fast during a 3-day CR phase and before and after BPD-DS surgery. The CR protocol and BPD-DS surgery were performed approximately 2 months apart.
Statistical analyses
Student t tests and χ2 tests were, respectively, used to assess differences between continuous and categorical clinical variables at baseline in the surgery vs control group. Stepwise multiple regression analyses were computed to quantify the contribution of cardiometabolic risk markers to the variance in log-transformed PCSK9 levels. Student t tests were also used to test the differences in plasma PCSK9 levels across patient subgroups (sex, statin use, and T2D status). For the bariatric surgery patients, to analyze significant changes among scheduled endpoints measurements (baseline, 24 hours, 5 days, and 6 and 12 months), data were analyzed by using a mixed model with two experimental factors defined: one linked to the variability among patients (a random factor) and the other associated with the comparison among the different time periods (a fixed factor). The latter was analyzed as a repeated-measure factor with the use of a heterogeneous compound symmetric covariance structure. To compare with the control group at baseline, 6 months, and 12 months, a second fixed factor was introduced in the statistical mixed model with an interaction term. The impact of CR vs bariatric surgery was also tested by using the statistical mixed model with an interaction term. When appropriate, some variables were analyzed by using log-transformation to fulfill the model assumptions; reported P values are based on these transformations. Spearman rank-correlation coefficients were computed to determine the association between PCSK9 levels and other cardiometabolic parameters at baseline. Spearman rank-correlation coefficients were also computed to determine the association between changes in PCSK9 levels and 6- and 12-month changes in other cardiometabolic parameters. All statistical analyses were performed with SAS software, version 9.3 (SAS Institute, Inc., Cary, NC).
Results
Baseline anthropometric and clinical characteristics of the 100 patients are presented in Table 1. Patients who underwent BPD-DS had a higher BMI (49.9 ± 7.0 vs 45.3 ± 7.7 kg/m2; P = 0.004), which appeared to be mostly explained by a greater fat mass (70.6 ± 17.5 vs 60.5 ± 17.7 kg; P = 0.008). There was no significant difference in baseline PCSK9 levels between the BPD-DS and control groups. Stepwise multiple regression analyses revealed that HbA1c, sex, and statin treatment together explained 33.7% (P = 0.01) of the variance in log-transformed PCSK9 levels. Accordingly, we observed differences in PCSK9 levels at baseline in some subgroups, such as patients with vs without diabetes (Fig. 1A), patients receiving statins vs patients not receiving statins (Fig. 1B), and men vs women (Fig. 1C).
Baseline Characteristics of Study Patients
| Characteristic | Bariatric Surgery | Controls | P Value |
|---|---|---|---|
| Patients, n | 69 | 31 | |
| Age, y | 41.5 ± 11.1 | 41.8 ± 10.3 | 0.9 |
| Men, n (%) | 20 (29.0) | 11 (35.5) | <0.0001 |
| Statin users, n (%) | 23 (33.3) | 17 (54.8) | <0.0001 |
| Smokers, n (%) | 13 (18.8) | 8 (25.8) | <0.0001 |
| T2D, n (%) | 34 (49.3) | 10 (32.3) | <0.0001 |
| Coronary artery disease, n (%) | 11 (11.1) | 1 (1.01) | <0.0001 |
| Hypertension, n (%) | 46 (45.5) | 20 (19.8) | <0.0001 |
| Weight, kg | 136.6 ± 26.4 | 127.1 ± 28.4 | 0.1 |
| BMI, kg/m2 | 49.9 ± 7.0 | 45.3 ± 7.7 | 0.004 |
| Fat mass, kg | 70.6 ± 17.5 | 60.5 ± 17.7 | 0.008 |
| Fat-free mass, kg | 66.0 ± 13.5 | 66.7 ± 16.1 | 0.8 |
| LDL-C, mmol/L | 2.61 ± 0.72 | 2.56 ± 0.86 | 0.8 |
| HDL-C, mmol/L | 1.27 ± 0.29 | 1.12 ± 0.27 | 0.02 |
| Triglycerides, mmol/L | 1.70 ± 1.07 | 1.88 ± 0.75 | 0.3 |
| Apolipoprotein B, g/L | 0.78 ± 0.19 | 0.8 ± 0.2 | 0.6 |
| Insulin, pmol/L | 199.4 ± 133,5 | 180.0 ± 140.0 | 0.5 |
| Glucose, mmol/L | 6.77 ± 2.40 | 6.62 ± 2.91 | 0.9 |
| HOMA-IR | 8.92 ± 7.15 | 8.04 ± 6.58 | 0.6 |
| HbA1c, % | 6.24 ± 1.05 | 6.51 ± 1.32 | 0.3 |
| Adiponectin, ng/mL | 5414 ± 3531 | 9163 ± 8663 | 0.03 |
| PCSK9, ng/mL | 248.7 ± 64.8 | 241.6 ± 53.4 | 0.6 |
Data are presented as mean ± standard deviation or n (%). HOMA-IR, homeostatic model of insulin resistance.
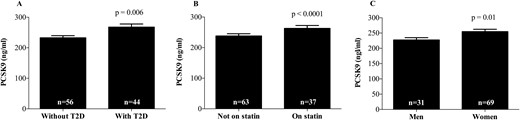
Baseline PCSK9 levels according to (A) T2D status, (B) statin use, and (C) sex.
Changes in PCSK9 and LDL-C levels during follow-up in both groups are presented in Fig. 2. One day after surgery, PCSK9 levels significantly increased, whereas LDL-C levels decreased in comparison with baseline levels. LDL-C levels remained significantly lower during follow-up. PCSK9 also decreased following day 1 after BPD-DS and reduced to levels similar to baseline levels at day 5. PCSK9 levels, however, were significantly lower at 6 and 12 months compared with baseline levels. Significant time–group interactions were found for both PCSK9 (P = 0.04) and LDL-C (P < 0.0001) levels. Analyses of least-square means considering changes in both study groups revealed that LDL-C and PCSK9 levels were significantly lower at 6 and 12 months in the surgery group compared with the control group. In the intervention group, we also found that plasma apolipoprotein B levels decreased at 6 months (change, −18.9% ± 25.2%; P < 0.0001) and 12 months (−29.6% ± 23.4%; P < 0.0001).
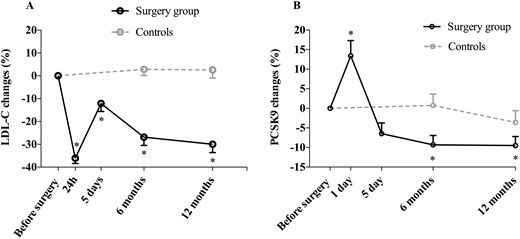
Acute and chronic changes in (A) LDL-C and (B) PCSK concentrations in patients who underwent bariatric surgery and in controls. *Significantly different from baseline at P < 0.05.
All patients in the surgery group who were receiving statins at baseline (n = 23) stopped using them after surgery. Because statin therapy influences PCSK9 levels, we evaluated changes in PCSK9 levels in patients who were not receiving statins and in patients treated with statins at baseline. Results presented in Fig. 3 suggest that although PCSK9 levels decreased in both subgroups of patients, these changes appeared to be more pronounced in patients who were receiving statins at baseline. PCSK9 levels were, however, not significantly different in both groups at 6 and 12 months.
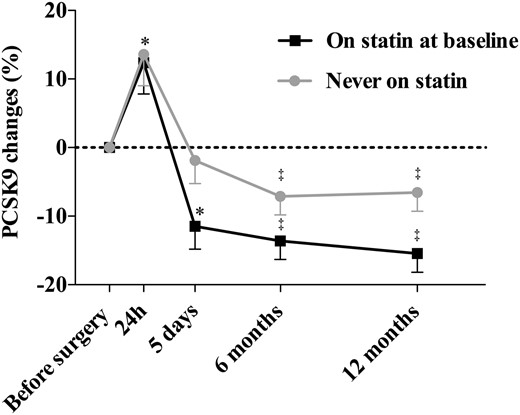
Acute and chronic changes in PCSK9 levels in the surgery group according to baseline statin use. *Significantly different from baseline at P < 0.05; ‡P < 0.005.
Spearman correlation coefficients between PCSK9 levels and cardiometabolic risk markers at baseline and between 6- and 12-month changes in PCSK9 levels and changes in cardiometabolic risk markers are presented in Table 2. At baseline, PCSK9 levels were negatively associated with body weight and fat mass and positively associated with glucose levels and HbA1c. Six-months changes in PCSK9 levels were positively associated with changes in insulin levels whereas the homeostatic model assessment of insulin resistance and 12-month changes in PCSK9 were positively associated with changes in HDL-C and adiponectin levels as well as with HbA1c (Table 2).
Associations Between PCSK9 and Cardiometabolic Risk Markers at Baseline and Association Between Changes in PCSK9 and Changes in Cardiometabolic Risk Markers in the Surgery Group
| Variable | Baseline | 6-Month Changes | 12-Month Changes | ||||||
|---|---|---|---|---|---|---|---|---|---|
| PCSK9 | LDL-C | ApoB | PCSK9 | LDL-C | ApoB | PCSK9 | LDL-C | ApoB | |
| Weight | −0.22 (0.02) | −0.12 (0.23) | −0.08 (0.39) | −0.06 (0.63) | −0.21 (0.08) | −0.23 (0.06) | −0.11 (0.36) | −0.13 (0.27) | −0.08 (0.48) |
| BMI | −0.11 (0.25) | −0.11 (0.22) | −0.09 (0.32) | −0.07 (0.60) | −0.20 (0.09) | −0.26 (0.03) | −0.11 (0.35) | −0.16 (0.17) | −0.14 (0.22) |
| Fat percentage | −0.11 (0.26) | 0.02 (0.80) | 0.03 (0.69) | 0.04 (0.73) | −0.03 (0.84) | −0.07 (0.58) | 0.13 (0.28) | 0.04 (0.77) | 0.04 (0.71) |
| Fat mass | −0.21 (0.03) | −0.09 (0.34) | −0.08 (0.43) | −0.08 (0.53) | −0.17 (0.16) | −0.22 (0.07) | −0.17 (0.17) | −0.12 (0.30) | −0.08 (0.48) |
| Fat-free mass | −0.18 (0.06) | −0.16 (0.09) | −0.12 (0.22) | −0.06 (0.61) | −0.11 (0.37) | 0.009 (0.94) | −0.01 (0.9) | −0.12 (0.33) | −0.08 (0.53) |
| ApoB | −0.09 (0.34) | 0.85 (<0.0001) | — | −0.16 (0.18) | 0.82 (<0.0001) | — | −0.19 (0.11) | 0.85 (<0.0001) | — |
| LDL-C | −0.10 (0.32) | — | 0.85 (<0.0001) | −0.12 (0.34) | — | 0.82 (<0.0001) | −0.15 (0.22) | — | 0.85 (<0.0001) |
| HDL-C | 0.02 (0.81) | 0.08 (0.42) | −0.06 (0.57) | −0.22 (0.07) | −0.002 (0.99) | −0.09 (0.47) | 0.34 (0.005) | −0.15 (0.21) | −0.21 (0.07) |
| Triglycerides | 0.09 (0.36) | 0.20 (0.04) | 0.45 (<0.0001) | −0.07 (0.54) | 0.38 (0.0008) | 0.43 (<0.0001) | 0.20 (0.09) | 0.22 (0.06) | 0.41 (0.0003) |
| Insulin | 0.04 (0.67) | −0.10 (0.32) | −0.007 (0.95) | 0.25 (0.04) | −0.14 (0.24) | −0.10 (0.42) | −0.08 (0.50) | −0.08 (0.51) | 0.05 (0.68) |
| Glucose | 0.37 (<0.0001) | −0.19 (0.05) | −0.05 (0.63) | 0.08 (0.49) | 0.10 (0.39) | 0.16 (0.18) | 0.17 (0.16) | −0.06 (0.60) | −0.02 (0.88) |
| HOMA-IR | 0.16 (0.10) | −0.11 (0.26) | 0.03 (0.77) | 0.25 (0.04) | −0.08 (0.51) | −0.03 (0.80) | −0.08 (0.5) | −0.08 (0.49) | 0.03 (0.79) |
| HbA1c | 0.33 (0.0006) | −0.19 (0.05) | −0.06 (0.56) | 0.20 (0.12) | −0.15 (0.27) | −0.07 (0.60) | 0.29 (0.02) | −0.16 (0.17) | −0.13 (0.27) |
| Adiponectin | −0.005 (0.9) | 0.15 (0.14) | 0.06 (0.56) | 0.23 (0.07) | 0.04 (0.75) | −0.03 (0.81) | 0.39 (0.001) | −0.25 (0.04) | −0.19 (0.12) |
| PCSK9 | — | −0.10 (0.32) | −0.09 (0.34) | — | −0.12 (0.34) | −0.16 (0.18) | — | −0.15 (0.22) | −0.19 (0.11) |
Values are given as Spearman correlation coefficients (P value). ApoB, apolipoprotein B; HOMA-IR, homeostatic model of insulin resistance.
To determine whether acute changes in PCSK9 levels after bariatric surgery (Fig. 2) could be due to BPD-DS–associated CR, we submitted patients with severe obesity and T2D to a 3-day CR protocol that matched the energy intake before and immediately after BPD-DS surgery 2 months prior to their bariatric surgery. PCSK9 levels were measured during the 3-day CR protocol and (approximately) 2 months later, before and after BPD-DS. Results presented in Fig. 4 show the acute elevation in PCSK9 levels following BPD-DS (an elevation that appears to peak 2 days after surgery). On the other hand, PCSK9 levels did not increase upon CR. In fact, PCSK9 levels were even significantly lower 2 days after the initiation of severe CR compared with baseline level. No differences were observed at day 1 and day 3 (Fig. 4).
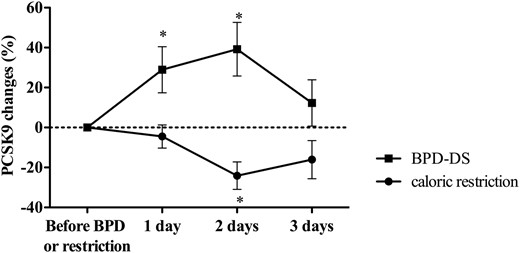
Changes in PCSK9 concentration in patients who underwent CR followed by BPD-DS surgery. *Significantly different compared with before BPD-DS at P < 0.05.
Discussion
Our findings suggest that BPD-DS surgery positively influences LDL metabolism in patients with severe obesity. Indeed, we found that LDL-C levels rapidly dropped in the acute phase after BPD-DS surgery and that it remained low in the chronic phase. Conversely, we found that plasma PCSK9 levels significantly increased in the acute phase following BPD-DS. Similar to LDL-C levels, however, PCSK9 levels decreased compared with baseline levels in the chronic phase of the response to surgery. By exploring the acute and chronic effect of BPD-DS surgery on plasma PCSK9 levels, our study provides additional information on the modulation of PCSK9 levels and underscores that long-term weight loss induced by malabsorptive surgery could reduce both PCSK9 and LDL-C levels in patients with severe obesity.
We also found that PCSK9 levels could be influenced by the baseline characteristics of the patients; women had higher PCSK9 levels than men, and patients treated with statins had higher PCSK9 levels than patients who were not treated with statins. Although these observations have been previously reported by others (18, 23), our results extend these findings by showing that the same applies to the population of patients with severe obesity. In our sample, patients with T2D had higher PCSK9 levels than patients without T2D. PCSK9 levels were also associated with glucose levels and HbA1c at baseline, as previously reported in a smaller cohort (24). However, another study found no differences between PCSK9 levels in patients with vs those without T2D (25). Important questions still remain regarding the directionality and causality of this association. In that respect, insulin has been shown to enhance PCSK9 expression, which may argue in favor of T2D causing elevations in PCSK9 levels (14, 15).
Several studies have shown that LDL-C decreased significantly after bariatric surgery. Recently, Carswell et al. (26) showed in a meta-analysis of 7815 study participants that RYGB surgery could decrease LDL-C levels within 1 month and up to 4 years. In our study, PCSK9 levels significantly increased 1 day after the surgery, and levels returned close to baseline at day 5. The biological mechanisms underlying this finding are not known. Because it was not possible in this study to determine whether the acute impact of BPD-DS surgery on cardiometabolic risk markers is due to BPD-DS per se or to the severe CR accompanying this procedure, we conducted a crossover trial and showed that severe CR was accompanied by decreases in PCSK9 levels, whereas BPD-DS led to acute increases in PCSK9 levels. This suggests that CR associated with BPD-DS surgery may not be responsible for the acute increase in PCSK9 levels after BPD-DS surgery. Previously studies had already reported similar results about CR in healthy and lean individuals (27). Our results extend these findings to patients with severe obesity.
Because BPD-DS could induce an acute inflammatory phase response, the rapid increase in PCSK9 levels could therefore be explained by the surgery itself. In a cohort of >2000 patients, PCSK9 levels increased 12 to 24 hours after an acute coronary syndrome, suggesting a possible upregulation of PCSK9 levels in the acute context of acute coronary syndrome (28). PCSK9 gene transcript and plasma PCSK9 levels were also increased 1 to 2 days after acute myocardial infarction in a study conducted in rats (29). Plasma C-reactive protein (CRP) levels may increase (up to 1000-fold) in the acute phase response, and CRP was recently shown to increase PCSK9 gene expression in cultured hepatocytes (30). As expected, CRP-mediated PCSK9 increases were simultaneously associated with lower LDL receptor density at the surface of these cells, which is likely to decrease LDL clearance. This observation, however, does not explain the discordance between increases in PCSK9 levels and decreases in LDL-C levels observed at 24 hours, and more data are needed to consider PCSK9 as an acute phase reactant.
In the chronic phase, PCSK9 levels were significantly decreased in patients who underwent BPD-DS surgery. This decrease in PCSK9 levels could be due to the longer-term weight loss CR induced by the bariatric surgery and by sustained reductions in total food intake. In a recent study, we showed that among abdominally obese men with dyslipidemia, improving dietary quality and increasing physical activity levels did not lead to reductions in plasma PCSK9 levels, thereby suggesting that modest weight loss may not decrease plasma PCSK9 levels (19). In contrast, Richard et al. (31) have shown that a Mediterranean diet could reduce plasma PCSK9 and LDL-C levels by approximately 10% in men with the metabolic syndrome, even in the absence of weight loss. On top of total body weight, previous studies have shown that PCSK9 levels are correlated with hepatic fat accumulation, the severity of hepatic steatosis, and very-low-density-lipoprotein and triglyceride levels (32, 33). Because bariatric surgery has been shown to reduce the prevalence of comorbidities associated with obesity, including fatty liver and steatosis (34), the reduction of hepatic fat induced by bariatric surgery could contribute to decrease circulating PCSK9 levels. Biliopancreatic diversion with or without duodenal switch induces a rapid improvement in insulin sensitivity and glucose control in most patients (6, 22).
Among other factors involved in the regulation of PCSK9, insulin may exert a substantial impact by, for instance, promoting the degradation of the LDL receptor in a PCSK9-dependent manner in vivo (15). In our cohort of abdominally obese men, PCSK9 levels were associated with insulin levels during an oral glucose tolerance test (19).
Another recent study found that PCSK9 gene and protein expression appeared to be downregulated in the small intestine of obese patients with insulin resistance compared with insulin-sensitive patients (35). Although the contribution of the intestine to circulating PCSK9 levels is unknown, studies have shown that PCSK9 could be secreted by the basolateral compartment of intestinal cells, where it colocalizes with the LDL receptor (36). Furthermore, in intestinal cells, PCSK9 expression could be regulated by sterol and bile acids via the farnesoid X receptor (37). It was also recently suggested that the concentration of circulating bile acids was increased after RYGB surgery, independent of CR (38). The alterations in bile flow that result from anatomic changes caused by bariatric surgery and changes in gut microbiome may consequently influence circulating bile acids concentrations and could subsequently contribute to decreases in PCSK9 levels. Finally, improved adipose tissue function and adipokine secretion modulation after BPD-DS surgery may also explain the reductions in PCSK9 levels in the chronic phase. Indeed, resistin and leptin were recently identified as potential modulators of both PCSK9 and LDL-C levels (39, 40).
One third of patients who underwent bariatric surgery in our sample were treated with statins, and all of them stopped taking those drugs after the surgery. Investigating the impact of BPD-DS surgery in patients who were receiving statins vs patients who were not, we found that, as expected, patients who underwent BPD-DS surgery and who simultaneously stopped taking statins appeared to have experienced a more important reduction in plasma PCSK9 levels. On the basis of the absence of any significant correlations between PCSK9 and LDL-C levels at baseline, or changes in PCSK9 levels during the follow-up and changes in LDL-C, we conclude that the variability in LDL-C levels after surgery was not explained by concomitant changes in PCSK9 levels. Finally, in this study, we measured plasma PCSK9 levels by ELISA, which takes into account both lipoprotein-bound and free PCSK9 levels. Other studies, such as the one by Gauthier et al. (41), used a mass spectrometric immunoassay to monitor up to seven PCSK9 peptides, many of which were correlated with LDL-C levels in a cohort of obese patients.
In conclusion, our results suggest that BPD-DS surgery is associated with reductions in circulating levels in both PCSK9 and LDL-C levels. Additional studies are needed to improve our comprehension about the mechanisms underlying the effect of BPD-DS surgery on PCSK9 levels, as well as to identify the clinical impact of BPD-DS surgery on PCSK9 in terms of CVD risk.
Abbreviations
- BMI
body mass index
- BPD-DS
biliopancreatic diversion with duodenal switch
- CR
caloric restriction
- CRP
C-reactive protein
- CVD
cardiovascular disease
- ELISA
enzyme-linked immunosorbent assay
- HbA1c
hemoglobin A1c
- HDL-C
high-density lipoprotein cholesterol
- LDL
low-density lipoprotein
- LDL-C
low-density lipoprotein cholesterol
- PCSK9
proprotein convertase subtilisin/kexin type 9
- RYGB
Roux-en-Y gastric bypass surgery
- T2D
type 2 diabetes.
Acknowledgments
We thank Sylvain Pouliot for technical help.
Financial Support: This work was supported by operating grants from the Canadian Institutes of Health Research. M.-E.P. is recipient of a studentship from the Fonds de Recherche du Québec-Santé (FRQS). A.C.C. is the recipient of the GlaxoSmithKline Chair in Diabetes of the Université de Sherbrooke. P.P. is a senior scholars from the FRQS. B.J.A. holds a junior scholar award from the FRQS.
Disclosure Summary: L.B. and A.T. receive research funding from Johnson & Johnson Medical Companies for scientific work on bariatric surgery, and B.J.A. has received research funding from Pfizer for scientific work on PCSK9. The remaining authors have nothing to disclose.
References
