


Abstract
Severe vitamin D deficiency may lead to myopathy in adults. Little is known about vitamin D and muscle strength in children.
To test whether hand grip strength (HGS) in 5-year-old children is associated with serum 25-hydroxyvitamin D (S-25OHD).
Observational study in the population-based Odense Child Cohort, Denmark. At 5 years, anthropometrics, body fat percentage by skinfold measurements, HGS (n = 881), and S-25OHD2+3 (n = 499) were obtained.
Mean (SD) HGS was higher for boys compared with girls [8.76 (1.76) vs 8.1 (1.64) kg, P < 0.001]. Mean (SD) 5-year S-25OHD was 70.7 (24.5) nmol/L. HGS was directly associated with height in girls and with weight (directly) and body fat percentage (inversely) in both sexes (P < 0.01 for all). In girls, 5-year S-25OHD was associated with HGS, adjusting for height, weight, and body fat percentage [β = 0.011 (95% CI: 0.004; 0.019), P = 0.003]. S-25OHD ≥75 nmol/L was associated with higher HGS compared with values <50 nmol/L [adjusted β = 0.783 (95% CI: 0.325; 1.241), P = 0.001]. The odds of having myopathy (HGS <10th percentile) were reduced by approximately 70% for S-25OHD ≥50 vs <50 nmol/L [adjusted OR: 0.310 (95% CI: 0.126; 0.762), P = 0.011]. No associations were seen for boys. Pregnancy or umbilical cord S-25OHD did not associate with 5-year HGS.
Five-year S-25OHD was independently associated with HGS and myopathy in girls but not in boys. Muscle strength may be dependent on vitamin D status even in the higher range in preschool girls. The sex difference remains unexplained.
Children’s muscle strength, endurance, and power have positive correlations to bone health, self-perceived sports competence, and self-esteem and an inverse relationship to adiposity, cardiovascular disease, and metabolic risk factors (1). Additionally, low muscle strength in adolescence is a risk factor for early adulthood mortality on par with other well-established risk factors such as elevated body mass index (BMI) and blood pressure (2).
Hand grip strength (HGS) is an established test to measure muscle strength in children (3). HGS is a good predictor for general muscle strength and a reliable alternative to the gold-standard isokinetic dynamometry in population studies (4, 5). However, research on HGS in preschoolers is sparse, with conflicting data on predictors for lower strength (6–8).
Hypovitaminosis D, here defined as a serum 25-hydroxyvitamin D (S-25OHD) < 50 nmol/L, is frequent worldwide in all age groups, including pregnant women and their newborns (9–13). In adults, vitamin D deficiency (S-25OHD <25 nmol/L) can lead to vitamin D–associated myopathy before the development of bone disease (14). Only a few studies researched the association between vitamin D and muscle strength in children/adolescents, and only one study included children down to 4 and 5 years of age, but results were inconclusive (15–22).
One animal study and one human study suggested a programing effect of vitamin D during pregnancy, as maternal S-25OHD was associated with offspring HGS in adjusted analyses (23, 24).
Given the high prevalence of hypovitaminosis D, mild or severe vitamin D–associated myopathy may be prevalent in preschool children. We therefore aimed to determine explanatory variables for HGS and myopathy, including S-25OHD during pregnancy, at birth, and at 5 years in a preschool population–based cohort.
Subjects and Methods
Design and population
Data from the Odense Child Cohort (OCC), a large-scale, prospective, population-based follow-up study, were used. Mothers and their children born from January 2010 to December 2012 in Odense, Denmark, were followed from early pregnancy up to 5 years at present (25).
Inclusion and data acquisition
The study complied with the STROBE guidelines (26). Five-year-old children participating in the OCC were included. Exclusion criteria were multiple birth, preterm birth [gestational age (GA) <259 days], chronic disease, and no available HGS measurements. Data sampling was closed 30 June 2017, at which time almost half of the potential participants had reached 5 years and were therefore investigated (n = 1243).
Baseline information about the mothers was obtained by questionnaires twice during pregnancy. Information at birth was obtained from medical records. At child age 3 and 15 months and 3 and 5 years, parents were asked to fill out wide-ranging questionnaires and the children underwent extensive examinations.
The questionnaires underwent pilot testing before implementation in the OCC. Where possible, extracted self-reported variables (e.g., smoking during pregnancy) were validated using medical records.
Blood samples
Blood samples were obtained at early (GA <20 weeks) and late pregnancy (GA ≥20 weeks), at birth (from umbilical cord), and at 5 years. The blood samples were stored at –80°C. S-25(OH)D2+3 analyses were performed by liquid chromatography–mass spectrometry as previously described (12, 13).
The hand grip test and 5-year examination
The children were invited to a clinical examination within a week of their fifth birthday. Hand dominance was noted before the test. In case of uncertainty, the child was asked to pick up a pen and draw a sun. The hand used was noted as dominant. A DHD-1 Digital Hand Dynamometer (CE2195; SAEHAN Corporation, Seoul, South Korea) was used to measure HGS. The first setting on the handle proved to be suitable for all the 5-year-old subjects. The children were sitting with a straight back, feet on the ground, a slight abduction of the shoulder, and 90 degrees of flexion of the elbow, and the hand was in the neutral position (27). The weight of the device was supported by the examiner during the measurement.
The child was instructed to squeeze as hard as possible as shortly demonstrated by the examiner beforehand. Each press was 5 seconds long with a 1-minute break in between measuring the right and left hand interchangeably. Three measurements of each hand were taken, starting with the right hand regardless of dominance. If the last measure was the highest, a fourth measurement was taken. A fifth and last measurement was taken if the fourth was the highest. The child performed the test starting with a countdown, receiving continuous encouragements until stop. The summary statistic of repeated HGS measurements was the maximal strength across all measurements regardless of hand side.
In addition to HGS and other parameters, height (without shoes; Seca Corporation, Hamburg, Germany), weight (in light underwear; Seca Corporation), and subscapular and triceps skinfold thickness (nondominant side; Harpenden Skinfold Caliper; ProTerapi A/S, Ballerup, Denmark) were measured.
The examinations were conducted by trained staff, blinded from questionnaire and laboratory data.
Explanatory variables
Continuous variables, including exact age, height, weight, BMI, triceps skinfold and subscapular skinfold (the mean of three measurements), body fat percentage (calculated as shown below), birth weight, and birth length were investigated as potential explaining factors to children’s HGS. Categorical variables, including examination season (summer: April to October vs winter: November to March), parental education (lower: high school or less vs intermediate: high school plus 1 to 3 years vs higher: high school plus 4 years or more), ethnicity (western: Europe, America, and Australia vs nonwestern), mother’s parity (first birth vs ≥second birth), smoking during pregnancy, vitamin D supplements at 5 years, participation in organized sports (at least once a week for the last year), physical activity compared with peers, motor skills compared with peers, and choice of free-time activities, were used as potential explanatory variables for HGS and/or to describe the study population.
For each sex, the mean height, weight, and BMI were compared with a recent Danish growth reference for age (28). Estimates of body fat percentage were calculated from skinfolds using Slaughter’s equation. The sum of triceps and subscapular skinfolds was <35 mm for all participants, and all children were prepubertal. The equation for girls was ; and for boys, . Body fat percentage by Slaughter shows a good correlation and agreement with body fat percentage by dual-energy X-ray absorptiometry scan (29, 30).
Statistical analysis
Statistical analyses were conducted using Stata (version 14.0; Statacorp, College Station, TX). Mean and SD were used to describe parametric data and median and interquartile range for nonparametric data. All data were investigated in total and for each sex separately. The Student t test and Mann-Whitney test for parametric and nonparametric data, respectively, were used to test the differences between boys and girls and the differences between participants and nonparticipants. Univariate regression models tested the associations between explanatory variables and HGS. HGS was used as a continuous variable and dichotomized to the lower 10% vs the rest in boys and girls, respectively, to specifically identify explanatory variables of myopathy. S-25OHD was investigated both as a continuous and as a categorical parameter split by quartiles, or by the routine cutoffs 25, 50, and 75 nmol/L.
Multivariate regression analyses were likewise performed. Linear regression results were expressed in β-coefficients and their respective 95% CIs. Mandatory explanatory variables for HGS were decided upon a priori. Model 1 variables included 5-year height, weight, and sex, based on the most frequent appearance in the existing literature. A univariate P value <0.10 was used to explore further variables. Variables with independent significant associations were included in the next model, which is why body fat percentage (in Model 2) and parental education were added. Model 2 was then extended to include S-25OHD-status at the 5-year examination (Model 3), and at birth and at early and late pregnancy. Logistic regression was used to calculate ORs for HGS <10th percentile. A likelihood-ratio test was used to check for interactions between sex and the other variables in the models and between weight and S-25OHD. Model assumptions were checked for all final linear models with visual inspection of scatterplots and QQ plots over the studentized residuals. A 2-sided P value <0.05 was accepted as significant.
Ethical considerations
The study was carried out according to the Helsinki II declaration and approved by the Regional Scientific Ethical Committee for Southern Denmark (no. S-20090130) and the Danish Data Protection Agency (no. 16/42833). All parents signed consent forms to receive information and invitations to follow-up examinations from the OCC. Both parents’ and children’s permissions were obtained before blood was drawn at 5 years, and the children were free to refuse any part of the examinations.
Results
Population, characteristics, and comparisons
Of the 2549 participants in the OCC, 881 5-year-old children had the HGS test performed at the closure of the inclusion period and did not meet other exclusion criteria for this study (Fig. 1). The 881 children constituted 96% of the potential population for the current study, as only 35 refused to participate in the HGS test.
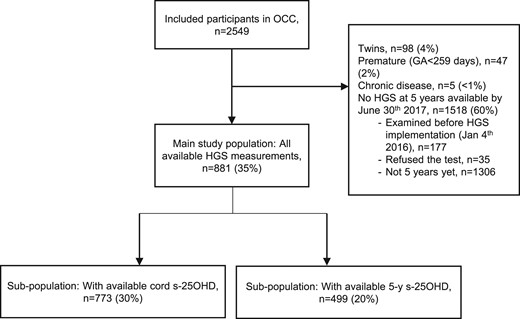
Participant inclusion flowchart. Percentages may not add up due to rounding.
In the study population, 449 (51%) were boys. For a large subset of the population (n = 773, 88%), cord S-25OHD was available. Among those, 520 (59%) had available early pregnancy S-25OHD data (GA <20 weeks) and 534 (61%) had available late pregnancy S-25OHD data (GA ≥20 weeks). Five-year S-25OHD was measured for 499 (57%) children of the study population.
Participant characteristics are presented in Tables 1 and 2. Girls and boys were of similar age, weight, and BMI. Boys were taller than girls, and girls had larger skinfolds and higher body fat percentage than boys (P < 0.001). The boys’ and girls’ mean height, weight, and BMI were within ±0.1 SD from the recent Danish growth reference for age (28).
Descriptive Characteristics of the Study Population and the Continuous Variables of Interest
| Mean (SD) or Median [IQR] | Minimum–Maximum | P Valuea | |
|---|---|---|---|
| Age, y, n = 881 | 5.0 [0.06] | 4.9–5.4 | |
| Height, cm, n = 881 | |||
| Total | 112.0 (4.3) | 97.1–126.4 | <0.001 |
| Boys | 112.6 (4.1) | 102.3–126.4 | |
| Girls | 111.4 (4.4) | 97.1–124.1 | |
| Weight, kg, n = 865 | |||
| Total | 19.26 (2.34) | 11.60–31.70 | 0.250 |
| Boys | 19.35 (2.23) | 15.00–31.70 | |
| Girls | 19.17 (2.44) | 11.60–26.40 | |
| Triceps skinfold, mm, n = 854 | |||
| Total | 8.8 [2.9] | 4.7–19.4 | <0.001 |
| Boys | 8.3 [2.3] | 4.7–18.9 | |
| Girls | 9.8 [2.9] | 5.3–19.4 | |
| Subscapular skinfold, mm, n = 849 | |||
| Total | 5.1 [1.5] | 3.2–19.6 | <0.001 |
| Boys | 4.8 [1.1] | 3.2–19.6 | |
| Girls | 5.5 [1.6] | 3.4–17.9 | |
| Body fat, %, n = 847 | |||
| Total | 13.7 [4.0] | 8.2–27.5 | <0.001 |
| Boys | 12.7 [3.3] | 8.2-27.0 | |
| Girls | 14.9 [4.0] | 8.5-27.5 | |
| BMI, kg/m2, n = 865 | |||
| Total | 15.32 (1.21) | 10.65–21.18 | 0.055 |
| Boys | 15.24 (1.16) | 10.65–21.18 | |
| Girls | 15.40 (1.26) | 12.24–20.25 | |
| 5-year S-25OHD, nmol/L, n = 499 | |||
| Total | 70.73 (24.48) | 6.80–173.32 | 0.104 |
| Boys | 72.48 (24.96) | 14.63–173.32 | |
| Girls | 68.92 (23.89) | 6.80–157.98 | |
| Cord S-25OHD, nmol/L, n = 773 | |||
| Total | 46.71 (21.60) | 1.53–127.05 | 0.518 |
| Boys | 46.22 (21.56) | 1.62–118.88 | |
| Girls | 47.23 (21.67) | 1.53–127.05 | |
| Maternal S-25OHD during early pregnancy,b nmol/L, n = 520 | |||
| Total | 64.09 (20.79) | 10.26–145.44 | 0.391 |
| Boys | 64.83 (21.56) | 14.33–130.12 | |
| Girls | 63.27 (19.89) | 10.26–145.44 | |
| Maternal S-25OHD during late pregnancy,c nmol/L, n = 534 | |||
| Total | 77.25 (27.47) | 16.46–164.02 | 0.948 |
| Boys | 77.33 (26.74) | 16.46–151.17 | |
| Girls | 77.17 (28.24) | 16.56–164.02 |
Significant P values in bold.
Abbreviation: IQR, interquartile range.
Mann-Whitney test or Student t test where appropriate for difference between boys and girls.
GA <20 weeks.
GA ≥20 weeks.
Descriptive Characteristics of the Study Population and the Categorical Variables of Interest
| n (%) | Missing, n | |
|---|---|---|
| Number | — | |
| Total | 881 | |
| Boys | 449 (51) | |
| Girls | 432 (49) | |
| Hand dominance | 5 | |
| Right | 794 (91) | |
| Left | 82 (9) | |
| Examination season | — | |
| Summera | 513 (58) | |
| Winterb | 368 (42) | |
| Vitamin D supplements | 163 | |
| Yes | 400 (56) | |
| No | 318 (44) | |
| Parents’ education | 195 | |
| Lowerc | 86 (13) | |
| Intermediated | 367 (54) | |
| Highere | 233 (34) | |
| Smoking during pregnancy | 4 | |
| No | 832 (95) | |
| Yes | 45 (5) | |
| Ethnicity | 0 | |
| Westernf | 840 (95) | |
| Nonwestern | 41 (5) | |
| Organized sportsg | 165 | |
| Yes | 541 (76) | |
| No | 175 (24) | |
| Physical activity compared with peers | 163 | |
| A lot less active | 1 (0.1) | |
| Somewhat less active | 14 (2) | |
| As active | 518 (72) | |
| Somewhat more active | 157 (22) | |
| A lot more active | 28 (4) | |
| Motor skills compared with peers | 182 | |
| A lot worse | 2 (0.3) | |
| Somewhat worse | 22 (3) | |
| The same | 400 (57) | |
| Somewhat better | 227 (32) | |
| A lot better | 48 (7) | |
| Choice of free-time activities | 162 | |
| Always sedentary | 16 (2) | |
| Mostly sedentary | 86 (12) | |
| As much active as sedentary | 477 (66) | |
| Mostly physically active | 117 (16) | |
| Always physically active | 23 (3) |
Percentages may not add up due to rounding.
May to October.
November to April.
High school or less.
High school plus 1 to 3 years.
High school plus 4 years or more.
European, American, or Australian background.
At least once a week for the last year.
There were no differences in age, height, weight, skinfold thickness, body fat percentage, or BMI between children with valid HGS measurements (participants) vs without (nonparticipants, n = 212) at the closure time of the study period (Supplemental Table 1). Both groups were predominantly of western origin. Fewer children had organized sports in the nonparticipant group compared with participants (50% vs 61%, P = 0.042). Other variables did not differ in the two groups.
Hand grip reference data and explanatory variables
For the 881 children, 5-year HGS was normally distributed with a mean (SD) of 8.1 (1.6) kg for girls and 8.8 (1.8) kg for boys (P < 0.001 for difference between sexes) (Supplemental Table 2). The HGS range for girls was 3.0 to 14.1 kg and for boys 3.9 to 13.8 kg. HGS <10th percentile (sex-specific percentiles) was observed in 27 girls (<6.2 kg) and 27 boys (<6.4 kg).
Univariate regression results are shown in Supplemental Table 3. Height, weight, and BMI were positively associated with HGS (P < 0.001). Positive associations between birth weight and HGS (P < 0.001), and between intermediate parental education and HGS (P = 0.048), were detected for boys only. Body fat percentage showed a trend toward a negative association (P = 0.091) for both sexes. The other variables, examination season, ethnicity, organized sports, vitamin D supplements, smoking during pregnancy, mother’s parity, and birth length, did not show univariate associations to HGS.
Multivariate linear regression results are shown in Table 3. The data were stratified by sex due to the detection of a significant interaction between sex and weight and sex and height (data not shown). In Model 1 (height and weight), both height and weight were positively associated with HGS in boys (P < 0.001). For girls, only height reached significance (P < 0.001).
Multivariate Regression Analyses on Associations With HGS at 5 Years Stratified by Sex
| Girls | Boys | |||
|---|---|---|---|---|
| Coefficient [95% CI] | P Value | Coefficient [95% CI] | P Value | |
| Model 1 (n = 865) | ||||
| Height, cm | 0.141 [0.091; 0.192] | <0.001 | 0.117 [0.066; 0.167] | <0.001 |
| Weight, kg | 0.040 [–0.052; 0.132] | 0.389 | 0.223 [0.130; 0.316] | <0.001 |
| Model 2 (n = 839) | ||||
| Height, cm | 0.081 [0.022; 0.141] | 0.007 | 0.047 [–0.009; 0.103] | 0.100 |
| Weight, kg | 0.203 [0.079; 0.327] | 0.001 | 0.412 [0.292; 0.532] | <0.001 |
| Body fat, % | −0.115 [–0.179; –0.051] | <0.001 | −0.145 [–0.207; –0.082] | <0.001 |
Significant P values in bold.
In Model 2 (height, weight, and body fat percentage), a 1% increase in body fat resulted in a decrease in HGS for both sexes (P < 0.001). For boys, the addition of body fat resulted in a strengthening of the positive association for weight compared with Model 1, whereas height became reduced to a marginal trend. For girls, weight became a highly significant positive predictor and height remained significant. Model 1 was reanalyzed with the subset of the population with complete data for all variables in Model 2 (n = 839) without changing the estimates (Supplemental Table 4).
Addition of parental education to Models 1 and 2 did not change the results (Supplemental Table 5).
Vitamin D
The mean (SD) S-25OHD at 5 years (n = 499) was 70.7 (24.5) nmol/L. S-25OHD <25 nmol/L and <50 nmol/L were found in 3% and 23% of the children, respectively, and 46% had S-25OHD ≥75 nmol/L. The 5-year S-25OHD quartile splits were 52.3, 72.0, and 86.3 nmol/L. The mean S-25OHD was comparable in pregnancy, but lower in cord (46.7 nmol/L).
No differences in S-25OHD between boys and girls were seen at any time point (early and late pregnancy, birth, and 5 years).
In univariate analysis, the 5-year S-25OHD values were positively associated with HGS in both sexes [β = 0.008 (95% CI: 0.002; 0.014), P = 0.013], driven by a significant association for girls [β = 0.009 (0.001; 0.018), P = 0.031] (Supplemental Table 6) The association in girls appeared to be linear using S-25OHD as continuous data. In other words, an increase in S-25OHD of 25 nmol/L resulted in an increase of 0.23 kg in HGS for girls. The β-coefficient for boys was weaker and did not reach significance. In analyses using S-25OHD categorized by various cut points, positive associations were found as well, supporting a positive association with increasing S-25OHD throughout the scale for girls only.
No univariate associations between S-25OHD in early pregnancy or late pregnancy or at birth and HGS at 5 years were observed (Supplemental Table 6).
Multivariate regression results are presented in Table 4, stratified by sex due to a significant interaction between sex and weight (data not shown). No interaction between weight and S-25OHD was detected. The 5-year S-25OHD concentration remained positively associated with HGS for girls after adjustment for height, weight, and body fat (P = 0.003). For each increase of 25 nmol/L S-25OHD in girls, HGS increased with 0.28 kg. As in univariate analyses, S-25OHD was significantly associated with HGS in girls in categorical analyses with different cutoffs, supporting a positive association with increasing S-25OHD throughout the scale (Models 4 and 5). Five-year S-25OHD ≥50 nmol/L was associated with an increase in HGS of 0.66 kg compared with values <50 nmol/L (Model 4, P = 0.002). and S-25OHD ≥75 nmol/L was associated with an increase in HGS of 0.78 kg compared with values <50 nmol/L (Model 5, P = 0.001). Analyses split by quartiles showed similar results (data not shown). No significant associations were observed for boys.
Multivariate Regression Analyses on Associations Including 5-Year S-25OHD With HGS at 5 Years Stratified by Sex
| Girls | Boys | |||
|---|---|---|---|---|
| Coefficient [95% CI] | P Value | Coefficient [95% CI] | P Value | |
| Model 3 (n = 493) | ||||
| Height, cm | 0.117 [0.043; 0.192] | 0.002 | 0.026 [–0.054; 0.105] | 0.529 |
| Weight, kg | 0.179 [0.025; 0.333] | 0.023 | 0.448 [0.275; 0.620] | <0.001 |
| Body fat, % | −0.129 [–0.209; –0.048] | 0.002 | −0.156 [–0.247; –0.066] | 0.001 |
| 5-year S-25OHD (nmol/L) | 0.011 [0.004; 0.019] | 0.003 | 0.006 [–0.001; 0.013] | 0.103 |
| Model 4 (n = 493) | ||||
| Height, cm | 0.110 [0.035; 0.184] | 0.004 | 0.023 [–0.056; 0.103] | 0.565 |
| Weight, kg | 0.188 [0.035; 0.341] | 0.016 | 0.448 [0.275; 0.621] | <0.001 |
| Body fat, % | −0.123 [–0.203; –0.043] | 0.003 | −0.156 [–0.246; –0.065] | 0.001 |
| 5-year S-25OHD ≥50 vs <50 nmol/L | 0.658 [0.251; 1.066] | 0.002 | 0.282 [–0.171; 0.736] | 0.221 |
| Model 5 (n = 339) | ||||
| Height, cm | 0.161 [0.067; 0.255] | 0.001 | 0.051 [–0.043; 0.145] | 0.287 |
| Weight, kg | 0.117 [–0.079; 0.313] | 0.239 | 0.372 [0.172; 0.573] | <0.001 |
| Body fat, % | −0.127 [–0.232; –0.023] | 0.017 | −0.169 [–0.272; –0.065] | 0.002 |
| 5-year S-25OHD ≥75 vs <50 nmol/L | 0.783 [0.325; 1.241] | 0.001 | 0.382 [–0.108; 0.872] | 0.126 |
Significant P values in bold.
Including S-25OHD in the regression model did not change the associations between weight, height, or body fat percentage, and HGS compared with Model 2. Removing the nonsignificantly associated variable height from Models 2 to 5 in boys did not change the estimates (data not shown). The R-squared of Models 3 to 5 reached 29% to 33%. Explorations in whether low S-25OHD could be a proxy for other factors escaping our statistical analysis including indoor, sedentary behavior in girls seemed fruitless. The most sedentary free-time activity group (n = 16; girls, n = 5) had S-25OHD values of 32 to 100 nmol/L and HGS of 5.3 to 12.2 kg with no difference between sexes.
Multivariate regression did not show any independent association of early/late pregnancy or cord S-25OHD concentrations to 5-year HGS (Supplemental Table 7). A significant association between late pregnancy S-25OHD and HGS in boys disappeared when including 5-year S-25OHD in the regression model.
Model 2 was reanalyzed with the subset of the population with complete data for all variables in Model 3 (n = 495). The results did not differ from those in the complete population of Model 2 (Supplemental Table 8).
ORs were calculated for various 5-year S-25OHD values for associations to myopathy (HGS ≤10th percentile; <6.2 kg for girls; <6.4 kg for boys). A univariate trend toward lower odds of myopathy with increasing 5-year S-25OHD was seen for girls [OR (95% CI) 0.985 (0.967; 1.002), P = 0.083] (Table 5). The univariate odds for myopathy were highly reduced [OR 0.294 (0.129; 0.669), P = 0.003] for S-25OHD ≥50 nmol/L vs <50 nmol/L. No such associations were seen in boys.
Univariate and Multivariate Logistic Regression Analyses on 5-Year S-25OHD Associations With HGS Values in the Lowest 10th Percentile (Reference >10th Percentile) Stratified by Sex
| Girls | Boys | All | ||||
|---|---|---|---|---|---|---|
| OR [95% CI] | P Value | OR [95% CI] | P Value | OR [95% CI] | P Value | |
| Univariate | ||||||
| 5-year S-25OHD, nmol/L | 0.985 [0.967; 1.002] | 0.083 | 0.995 [0.979; 1.011] | 0.521 | 0.990 [0.978; 1.002] | 0.096 |
| 5-year S-25OHD ≥50 vs <50 nmol/L | 0.294 [0.129; 0.669] | 0.003 | 0.590 [0.243; 1.435] | 0.245 | 0.410 [0.226; 0.741] | 0.003 |
| Multivariate | ||||||
| ≤10p vs >10p, n = 495 | ||||||
| Height, cm | 0.695 [0.587; 0.824] | <0.001 | 0.958 [0.810; 1.133] | 0.615 | — | — |
| Weight, kg | 1.357 [1.049; 1.756] | 0.020 | 0.601 [0.403; 0.895] | 0.012 | — | — |
| 5-year S-25OHD, nmol/L | 0.983 [0.965; 1.001] | 0.062 | 0.991 [0.974; 1.008] | 0.318 | — | — |
| ≤10p vs >10p, n = 493 | ||||||
| Height, cm | 0.767 [0.633; 0.930] | 0.007 | 0.994 [0.824; 1.200] | 0.954 | — | — |
| Weight, kg | 1.023 [0.694; 1.508] | 0.907 | 0.554 [0.343; 0.896] | 0.016 | — | — |
| Body fat, % | 1.222 [0.992; 1.505] | 0.059 | 1.090 [0.867; 1.371] | 0.458 | — | — |
| 5-year S-25OHD, nmol/L | 0.985 [0.967; 1.003] | 0.098 | 0.990 [0.973; 1.008] | 0.279 | — | — |
| ≤10p vs >10p, n = 493 | ||||||
| Height, cm | 0.773 [0.637; 0.937] | 0.009 | 0.993 [0.823; 1.198] | 0.940 | — | — |
| Weight, kg | 1.016 [0.688; 1.501] | 0.935 | 0.563 [0.349; 0.907] | 0.018 | — | — |
| Body fat, % | 1.216 [0.986; 1.499] | 0.068 | 1.079 [0.860; 1.354] | 0.509 | — | — |
| 5-year S-25OHD ≥50 vs <50 nmol/L | 0.310 [0.126; 0.762] | 0.011 | 0.530 [0.203; 1.387] | 0.196 | — | — |
Results presented in ORs. Significant P values in bold. Twenty-seven girls and 27 boys had HGS <10th percentile (sex specific).
Abbreviation: 10p, 10th percentile.
Adjusting for height, weight, and body fat percentage (Table 5), girls with S-25OHD ≥50 nmol/L had similar decreased odds of myopathy by 69% [OR 0.310 (0.126; 0.762), P = 0.011]. Multivariate analyses were stratified by sex due to interaction.
The studentized residuals from all final linear models were normally distributed with a mean of zero.
Discussion
In our population-based cohort of 5-year-old children, the 5-year S-25OHD showed a strong, independent association with HGS, as well as myopathy (HGS <10th percentile) in girls, but not in boys. Neither S-25OHD at birth nor during pregnancy was associated with HGS.
Hand grip and explanatory variables
Our mean HGS and 10th percentile cutoffs were higher for both sexes compared with other published normative values in 5-year-olds (6, 8, 31).
HGS was associated with height in our population, although only after adjusting for body fat percentage in girls. Height predicted HGS in other studies in children with a broader age range (6, 8, 32).
Weight also predicted HGS in our and in other pediatric studies (6, 8). However, weight only reached significance in both sexes after adjustment for body fat percentage, which had a strong negative association with HGS in both sexes. In our interpretation, weight became a stronger expression for muscle and bone mass after adjusting for body fat percentage, analogous to lean body mass, or fat-free mass. The impact of body fat percentage has only been investigated in a few other studies in children with similar results (7, 16). In further studies on muscular strength in children, we recommend adjustment with a measure of body fat in addition to weight and height and stratification by sex.
Vitamin D
We surprisingly found a sex-specific association between S-25OHD and both HGS and myopathy (HGS <10th percentile) in 5-year-old girls. Vitamin D sufficiency (S-25OHD >50 nmol/L) decreased the odds of myopathy by approximately 70% in girls.
In mice, grip strength is reduced after vitamin D receptor ablation (33). Furthermore, mouse myoblast cells increase proliferation, differentiation, and myotube size when treated with 25-hydroxyvitamin D or calcitriol (34). In adult humans, a systematic review with a meta-analysis of 30 randomized controlled trials (RCTs) showed a small positive effect of vitamin D supplementation on muscle strength, most evident in the lower limb (35). Results of observational studies in adults have shown mixed results (36–40).
Only a few RCTs have been published in children or adolescents. In a small RCT in 10- to 17-year-old Lebanese girls (n = 168), 1-year supplementation with two different doses of vitamin D3 resulted in insignificant increases in HGS (21). Another small RCT (n = 69) of postmenarchal 12- to 14-year-old girls from the United Kingdom with S-25OHD of 18 nmol/L at baseline showed improved jump efficacy in the treatment group (four doses of 150,000 IU vitamin D2 over 1 year), but improvements in HGS and other jump parameters did not reach significance compared with placebo (20). RCT results from supplementing 117 4- to 8-year-old Danish children with vitamin D3 (10 or 20 mcg/d) for 20 weeks showed no difference in HGS between intervention and placebo groups (22). However, baseline S-25OHD was associated with HGS, fat-free mass index, and IGF-binding protein-3 in girls only.
Observational studies on vitamin D and muscle strength in children and adolescents have shown positive results in four (15–18), and negative results in one (19). Taken together, the large RCT meta-analysis in adults and the majority of observational studies in different populations favor an impact of vitamin D on muscle strength.
A potential sex-differential effect of vitamin D on muscle strength in children has not been investigated in previous studies, either because the outcome was not split by sex or because studies were performed in one sex only. The reason for our unique finding suggesting sex dimorphism remains unknown, although vitamin D in part may exert its impact on muscles through IGF-I (22, 34, 41), which is lower in girls, even in the prepubertal stage. We did not have the possibility to analyze serum IGF-I in our cohort. One could speculate that lower S-25OHD was a proxy for a physically more inactive, indoor lifestyle in girls, who furthermore would be more difficult to motivate for HGS measurements. However, our data on physical activity and motor skills from questionnaires did not show associations to HGS, and a sex difference in motivation for HGS was not observed by our staff. We cannot rule out an association between S-25OHD and HGS in boys in a larger population, or in populations with lower S-25OHD values. A post hoc analysis showed that 1630 boys would be needed to detect a significant association between S-25OHD and HGS, given a HGS difference of 0.005 kg (HGS SD = 1.8 kg, S-25OHD SD = 25.0 nmol/L, 2-sided α 0.05 and β 0.80).
We did not detect any programing effect of pregnancy or birth vitamin D status on HGS at 5 years. A programming effect of vitamin D on offspring muscle development has been found in one animal study (23). In humans, two studies have shown contradicting results (24, 42). Taken together, human studies do not support a programming effect of vitamin D status in pregnancy on offspring muscle strength, at least beyond infancy.
Strengths and limitations
Our study had several strengths including the population-based prospective design, the relatively large study number, the analysis of S-25OHD by gold standard method (instead of vitamin D supplementation questionnaire data) and longitudinal S-25OHD data from early/late pregnancy and birth, the blinding of trained examiners, and the use of a standardized HGS protocol applicable to 5-year-olds. Furthermore, the access to data from repeat questionnaires and physical examinations of the OCC allowed for the testing of a multitude of potential confounders, of which body fat percentage by skfold measurements proved important.
Limitations included the observational nature of the study, the lack of nutritional calcium intake data, and the possible impact of the child’s motivation on the HGS performance. Although minor differences have been found between the cohort participants and the background population (25), no differences were identified between participants with HGS measurements with or without available S-25OHD.
Conclusion
In this large, prospective, population-based study on 5-year-old children, S-25OHD was directly associated with HGS and inversely associated with myopathy (HGS <10th percentile) in girls, but not in boys. No associations with pregnancy or cord S-25OHD values were found. The suggested sex-specific negative impact of vitamin D insufficiency (S-25OHD <50 nmol/L) on myopathy in girls needs further studies, as vitamin D insufficiency is common and easily preventable.
Abbreviations:
- BMI
body mass index
- GA
gestational age
- HGS
hand grip strength
- OCC
Odense Child Cohort
- RCT
randomized controlled trial
- S-25OHD
serum 25-hydroxyvitamin D
Acknowledgments
We thank the participants and staff of the OCC and our collaborators at the Department of Clinical Biochemistry and Pharmacology at Odense University Hospital for the S-25OHD analyses.
Financial Support: This work was supported by the Aase and Ejnar Danielsen fund (to R.F.A.-J.), the Ingemann O. Buck fund (to R.F.A.-J.), and the Odense University Hospital (to R.F.A.-J.).
Author Contributions: E.J. and H.T.C. designed research. R.F.A.-J. conducted research. C.D., N.B., and H.T.C. provided essential materials. R.F.A.-J., E.J., C.D., and H.T.C. analyzed data. R.F.A.-J. and H.T.C. wrote paper and had primary responsibility for final content. All authors read and approved the final manuscript.
Disclosure Summary: The authors have nothing to disclose.
