


Abstract
Almost 50% of type 2 diabetic (T2D) patients are poorly controlled [glycated hemoglobin (HbA1c) ≥ 7%]; however, the mechanisms responsible for progressively worsening glycemic control are poorly understood. Lower skeletal muscle mitochondrial respiratory capacity is associated with low insulin sensitivity and the development of T2D.
We investigated if skeletal muscle insulin sensitivity (SI) was different between well-controlled T2D (WCD) and poorly controlled T2D (PCD) and if the difference was associated with differences resulting from mitochondrial respiratory function.
Vastus lateralis muscle mitochondrial respiration, mitochondrial content, mitochondrial enzyme activity, and fatty acid oxidation (FAO) were measured. SI and the acute response to glucose (AIRg) were calculated by MINMOD analysis from glucose and insulin obtained during a modified, frequently sampled, intravenous glucose tolerance test.
SI and AIRg were lower in PCD than WCD. Muscle incomplete FAO was greater in PCD than WCD and greater incomplete FAO was associated with lower SI and higher HbA1c. Hydroxyacyl-coenzyme A dehydrogenase expression and activity were greater in PCD than WCD. There was no difference in maximal mitochondrial respiration or content between WCD and PCD.
The current results suggest that greater skeletal muscle incomplete FAO in poorly controlled T2D is due to elevated β oxidation and is associated with worsening muscle SI.
The incidence of type 2 diabetes mellitus (T2D) is increasing at an alarming rate and is associated with substantial financial burden to the health care system. In patients with diabetes, 46% of patients are poorly controlled [glycated hemoglobin (HbA1c) ≥ 7%]. The costs associated with related treatments are greater in poorly controlled patients with diabetes, and an elevated HbA1c increases the risk for diabetes comorbidities (1). Even with aggressive pharmacological treatment, fasting blood glucose and glycemic control rise over time, documenting the progressive effect of T2D duration on glycemic control (2). Skeletal muscle insulin resistance is a hallmark decrement in T2D (3, 4). We have recently shown that higher HbA1c is associated with increased duration of diabetes and low skeletal muscle insulin sensitivity (SI) and β-cell function, confirming a deterioration of glycemic control with progression of the disease (5).
There is a stepwise reduction in skeletal muscle SI from lean to obese to obese type 2 patients with diabetes, with further declines with longer duration of T2D (5). Several potential mechanisms have been proposed for the low overall skeletal muscle SI in T2D including lower GLUT4 content (6), impaired insulin signaling (7), greater inflammation (8), reduced glycogen synthesis capacity (9), and altered mitochondrial function due to nutrient overload [increased fatty acid oxidation [FAO; (10) and greater reactive oxygen species production (11)]. Lipid overload leads to increased incomplete fatty acid β oxidation in muscle (10), and increased acylcarnitines have been directly implicated in the development of muscle insulin resistance (12).
However, little is known about the progressive reduction in skeletal muscle SI associated with worsening glycemic control in T2D. In the current report, we investigated if skeletal muscle SI was different between well (HbA1c < 7%) and poorly (HbA1c ≥ 7%) controlled T2D and if the difference was associated with corresponding changes in mitochondrial respiratory function. We hypothesized that skeletal muscle SI and mitochondrial function would be lower in poor vs well controlled T2D.
Materials and Methods
Eight well-controlled (HbA1c < 7%; range, 5.3% to 6.6%) and eight poorly controlled (HbA1c ≥ 7%; range, 7.0% to 9.9%) T2D patients volunteered to participate in the study after receiving written and verbal explanations of the content and intent of the study in accordance with the University & Medical Center Institutional Review Board. Patients in the current report represent a subset of patients from our previous report (5).
Patients were taken off oral glycemic control medications 3 days before testing. Long-acting insulin was stopped 24 hours before; short-acting insulin was stopped after the evening meal the night before undergoing an insulin-modified intravenous glucose tolerance test (IVGTT). Patients on thiazolidinediones or a thyroid hormone replacement were excluded. Diabetic medication usage is shown in Supplemental Table 1. The progression of T2D was determined based on current treatment: 1, diet + exercise; 2, oral glycemic agents exclusively; 3, long-acting insulin; or 4, short-acting insulin.
IVGTT
A frequently sampled insulin-modified IVGTT was performed in all subjects as described previously (5). Initial blood samples were drawn following an overnight fast. Following the fasting blood samples, glucose (50%) was injected into a catheter placed in an antecubital vein at a dose of 0.3 g/kg body mass. Insulin at a dose of 0.025 U/kg body mass was injected at minute 20 after glucose administration. Blood samples were obtained at minutes 2, 3, 4, 5, 6, 8, 10, 12, 14, 16, 19, 22, 25, 30, 40, 50, 60, 70, 80, 90, 100, 120, 140, 160, and 180. Samples were centrifuged, plasma transferred, and frozen at –80°C until determination of glucose and insulin by previously described methodology (5). SI index and β-cell function [acute insulin response to glucose (AIRg)] were assessed using minimal modeling analysis. Homeostatic model assessment of insulin resistance (HOMA-IR) and β-cell function (HOMA-β) were calculated from fasting insulin and glucose.
Skeletal muscle biopsy
Before the IVGTT, a muscle biopsy was obtained from the vastus lateralis; portions were immediately processed for mitochondrial respiration and FAO. The remainder of the muscle sample was frozen in liquid N2 and stored at –80°C for protein analysis by Western blotting and enzyme activity analysis.
Mitochondrial respiration
Skeletal muscle mitochondrial respiration was determined using permeabilized muscle fibers (PmFBs) as previously described (13). After muscle removal, samples were placed in ice-cold buffer X (50 mM K-MES, 7.23 mM K2EGTA, 2.77 mM CaK2EGTA, 20 mM imidazole, 20 mM taurine, 5.7 mm adenosine triphosphate, 14.3 mM phosphocreatine, and 6.56 mM MgCl20.6H2O; pH 7.1). Two small muscle bundles (0.25 to 0.35 mg dry wt) were gently prepared from each sample along the longitudinal axis with a pair of needle-tipped forceps under magnification (MX6 Stereoscope, Leica Microsystems, Buffalo Grove, IL). Bundles were permeabilized in buffer X + 30 µg/mL saponin and placed on a rotator at 4°C for 30 minutes. Following permeabilization, the PmFBs were washed in buffer Z (105 mM K-MES, 30 mM KCl, 0.5 mM EGTA, 10 mM KH2PO4, 5 mM MgCl2/6H2O, 0.5 mg/mL−1 bovine serum albumin; pH 7.14) and placed on a rotator at 4°C for at least 15 minutes until analysis. At the conclusion of each experiment, PmFBs were washed in double-distilled H2O to remove salts, freeze-dried (Labconco, Kansas, MO), and weighed.
O2 consumption was measured at 37°C using a high-resolution Oxygraph-2K (OROBOROS Instruments, Innsbruck, Austria). Measurements were made in buffer Z containing 20 mM creatine and 25 μM Blebbistatin to inhibit contraction. Two protocols were used (one on each fiber bundle): 1) 10 mM glutamate + 2 mM malate (complex I substrates), followed by the sequential additions of 4 mM adenosine 5′-diphosphate (ADP), 10 mM succinate (complex II substrate), 10 μM cytochrome c to test for mitochondrial membrane integrity, and 0.75 μM trifluorocarbonylcyanide phenylhydrazone (FCCP) to measure uncoupled respiration; 2) 25 μM palmitoyl-l-carnitine (β-oxidation) + 2 mM malate, followed by the sequential additions of 4 mM ADP, 10 mM glutamate, 10 mM succinate, 10 μM cytochrome c, and 0.5 μM FCCP.
FAO
FAO was measured as described previously by Kim et al. (14). Briefly, 50 to 60 mg of muscle tissue was collected in 200 μL of a buffer containing 250 mM sucrose, 1 mM EDTA, and 10 mM tris(hydroxymethyl)aminomethane (Tris) HCl, pH 7.4, and minced with scissors. Tissue was placed on ice and homogenized for 30 seconds with a nonstick pestle. Forty microliters of homogenate was added to the top well of a sealed, modified 48-well plate that contained a channel connecting to the adjacent trap well, which allowed for the passage of CO2 liberated by the complete oxidation of [1-14C]palmitate. The bottom trap well contained 1 N NaOH to collect the 14CO2 given off by the oxidation procedure. To initiate the reaction, 160 μL of a reaction buffer composed of the following was added to the top wells: 0.2 mM palmitate ([1-14C]palmitate at 0.5 μCi/mL), 100 mM sucrose, 10 mM Tris HCl, 5 mM KH2PO4, 80 mM KCl, 1 mM MgCl, 0.1 mM malate, 2 mM adenosine triphosphate, 1 mM DTT, 0.2 mM EDTA, 1 mM l-carnitine, 0.5 mM coenzyme A, and 0.5% fatty acid-free bovine serum albumin; pH 7.4. Samples were incubated in a 37°C water bath for 30 minutes, at which point 100 μL of 70% perchloric acid was added to terminate the reaction. The plate was placed on a shaker for 1 hour to ensure complete transfer of CO2 into the bottom well. Label incorporation into 14CO2 was determined by scintillation counting using 4 mL of Uniscient BD (National Diagnostics, Atlanta, GA). Incomplete oxidative products [acid-soluble metabolites (ASMs)] remaining in the top well were measured as described by Bell et al. (15).
Western blotting
Muscles were homogenized in lysis buffer (20 mM Tris HCl, pH 7.4; 5 mM EDTA, 10 mM sodium pyrophosphate, 100 mM NaF, 2 mM Na3VO4, 1% NP-40, 10 μg/mL aprotinin, 10 μg/mL leupeptin, 3 mM benzamidine, 1 mM PMSF) and then diluted in 4X Laemmli + DTT. Proteins were fractionated on sodium dodecyl sulfate-polyacrylamide gels (Criterion precast gels; Bio-Rad, Hercules, CA); transferred to reduced-fluorescence polyvinylidene fluoride membrane (Immobilon-FL; Millipore, Bedford, MA), and incubated with one of the following primary antibodies: hydroxyacyl-coenzyme A [CoA dehydrogenase (HADHA, also known as β-HAD)], malonyl-CoA decarboxylase, and pyruvate dehydrogenase kinase 4 (PDK4), all from Abcam (Cambridge, MA); phospho-acetyl-CoA carboxylase (p-ACC) (Ser79) and pan-ACC from Millipore (Burlington, MA); and Total OXPHOS (complexes I through V) cocktail from Mitosciences (Eugene, OR). Either florescence-conjugated (LI-COR, Lincoln, NE) or horseradish peroxide–conjugated (Santa Cruz, Dallas, TX) secondary antibodies were incubated with the membrane and detected using florescence (Odyssey, LI-COR) or chemiluminescence (PerkinElmer, Waltham, MA). Densitometric analysis was performed using either the Odyssey IR Imaging System (LI-COR) or Image Laboratory software (Bio-Rad). Results were normalized to β-actin or tubulin.
Enzyme activity
The activity of β-HAD and citrate synthase (CS) were performed according to Jaworowski et al. (16) and Spinazzi et al. (17), respectively. Approximately 20 mg of frozen muscle was homogenized on ice in isolation buffer (20 mM Tris, 40 mM KCl, 2 mM EGTA, 50 mM sucrose, 0.2 mM Na3VO4, 50 mM NaF; pH 7.4). Total sample protein concentration was determined by the bicinchoninic acid method (BCA protein assay kit, Bio-Rad Laboratories). Samples were then frozen and kept at −80°C until enzyme analysis.
In silico analysis
To identify if in, a larger cohort of T2D, a relationship existed between glycemic control and skeletal muscle β-oxidation, we performed in silico correlation with HbA1c and biological pathway analysis on the T2D patient subcohort (n = 45) of the publicly available National Center for Biotechnology Information Gene Expression Omnibus (GEO) dataset GSE18732 (18). This dataset contains a profile of messenger RNA expression in the skeletal muscle of normal, glucose-intolerant, and T2D subjects. Our analysis was focused on the T2D subjects only. After downloading CEL files from GEO, CHP files were generated in Expression Console using the PLIER algorithm (Affymetrix); a Pearson product-moment correlation analysis was then performed. Probes with unadjusted P values < 0.01 were carried into biological pathway analysis using Ingenuity Pathway Analysis (Qiagen; Germantown, MD). Ingenuity Pathway Analysis uses a highly curated Ingenuity knowledge base to assign annotations, functional biological data, and pathways to probe sets, based on peer-reviewed literature and third-party databases.
Statistical treatment
Student t test was used to compare differences between groups. Linear regression and stepwise forward linear regression (P ≤ 0.05 to enter and to stay in the model) were performed to investigate relationships between variables. Significance was established at P ≤ 0.05 for all statistical sets, except in silico analysis, which used P < 0.01.
Results
Subject characteristics for T2D patients grouped by well-controlled T2D (WCD) and poorly controlled T2D (PCD) glycemic control are in Table 1. There are several differences in PCD compared with WCD: longer duration of T2D and higher stage of T2D; greater fasting glucose, fasting insulin, and fasting triglycerides; and lower SI and AIRg. Correlations among HbA1c, SI, AIRg, HOMA-IR, and HOMA-β appear in Table 2. HbA1c was correlated with SI (r = −0.66), consistent with skeletal muscle SI being an important regulator of glycemic control. Forward stepwise linear regression between HbA1c and SI, AIRg, HOMA-IR, and HOMA-β revealed that SI explained 42% of the variance in HbA1c and that the addition of AIRg, HOMA-IR, or HOMA-β did not significantly improve the prediction of HbA1c. When the analysis was covaried for age and body mass index (BMI), SI explained 34% of the variance in HbA1c with no other variable predicting a substantial amount of the remaining variance.
Characteristics of T2D Patients Grouped by Glycemic Control (HbA1c < 7.0 mg/dL; HbA1c ≥ 7.0 mg/dL)
| HbA1c < 7.0 (n = 8) | HbA1c ≥ 7.0 (n = 8) | |
|---|---|---|
| Age, y | 51.5 ± 3.1 | 59.4 ± 2.1 |
| Body mass, kg | 98.7 ± 5.5 | 111.7 ± 7.2 |
| BMI, kg/m2 | 32.8 ± 1.7 | 37.2 ± 2.1 |
| Sex, M/F | 5/3 | 6/2 |
| Race, C/AA | 3/5 | 6/2 |
| Duration of T2D, ya | 4.1 ± 0.9 | 8.8 ± 1.7 |
| Age of T2D onset, y | 47.4 ± 3.2 | 50.6 ± 2.9 |
| Stage* | 2.3 ± 0.2 | 3.3 ± 0.2 |
| Fasting glucose, mg/dLa | 113 ± 6 | 156 ± 15 |
| Fasting insulin, µIU/mLa | 15.8 ± 2.0 | 28.2 ± 7.8 |
| HOMA-IR | 4.4 ± 0.7 | 10.1 ± 2.9 |
| HOMA-β | 125.3 ± 21.1 | 189.0 ± 84.8 |
| Total cholesterol (mg/dL) | 171 ± 7 | 173 ± 11 |
| Triglycerides (mg/dL)a | 92 ± 8 | 164 ± 27 |
| HDL (mg/dL) | 46 ± 2 | 41 ± 3 |
| LDL (mg/dL) | 106 ± 6 | 99 ± 11 |
| SI (min−1 × μU−1 × mL−1)a | 2.1 ± 0.3 | 0.5 ± 0.2 |
| AIRg (μU × mL−1)a | 127.1 ± 46.0 | 5.0 ± 11.1 |
| HbA1c, %* | 6.2 ± 0.1 | 8.4 ± 0.4 |
Abbreviations: AA, African American; C, Caucasian; F, female; HDL, high-density lipoprotein; LDL, low-density lipoprotein; M, male.
P ≤ 0.05.
To investigate the role of skeletal muscle mitochondrial respiratory function on glycemic control in T2D, high-resolution respirometry in permeabilized fibers was performed using glutamate (Fig. 1A) and palmitoylcarnitine (Fig. 1B) as substrates. There were no differences between PCD and WCD, whether using either glutamate or palmitoylcarnitine as substrate. Also, there was no difference between groups when analyzed during state 3 or 4 respiration, with combined complex I and II (glutamate + succinate) substrates, or during uncoupled respiration. There was no difference in state 3 respiration with the addition of cytochrome C in either condition. Consistent with this, there was no difference in mitochondrial complexes I through V protein content between PCD and WCD (Fig. 1C). Thus, differences in glycemic control and SI between PCD and WCD cannot be accounted for by differences in maximal skeletal muscle mitochondria respiration or content.
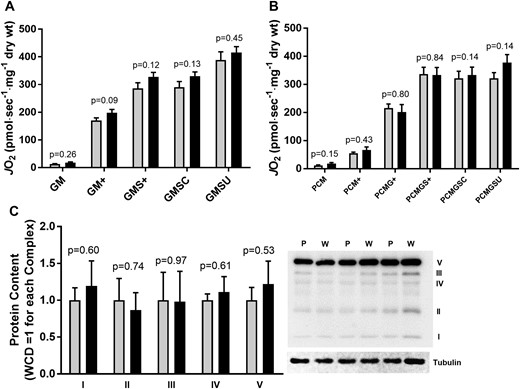
(A, B) JO2 and (C) mitochondrial complexes I through V in T2D patients grouped by glycemic control (HbA1c < 7.0 mg/dL; HbA1c ≥ 7.0 mg/dL). JO2, skeletal muscle mitochondrial respiratory O2 flux (pmol/s−1/mg dry wt−1). GM, 2 mM glutamate + 1 mM malate; GM+, GM + 2 mM ADP (state 3); GMS+, GM state 3 + 3 mM succinate; GMSU, GMS state 3 + 2 μM FCCP; PCM, 25 μM palmitoylcarnitine + 1 mM malate; PCM+, PCM + 2 mM ADP (state 3); PCMG+, PCMG state 3 + 2 mM glutamate; PCMGS+, PCMG state 3 + 3 mM succinate; PCMGSC, PCGMS state 3 + cytochrome C; PCMGSU, PCMGSC state 3 + 2 μM FCCP. Gray bars, HbA1c < 7.0 mg/dL (W); black bars, HbA1c ≥ 7.0 mg/dL (P).
Elevated skeletal muscle FAO has been proposed as a potential mechanism for impaired SI (10). To investigate if differences in skeletal muscle FAO existed between WCD and PCD, complete and incomplete FAO were measured. There was no difference in the complete oxidation of palmitate between groups, but incomplete oxidation products (ASMs) were greater in PCD compared with WCD (Fig. 2A). In addition, there were correlations between incomplete FAO and HbA1c and SI consistent with excessive skeletal muscle FAO contributing to impaired glycemic control and SI (Fig. 2B and Fig. 2D). Linear regression revealed that incomplete FAO (ASM) explained 40% of the variance in SI and 69% of the variance in HbA1c. When the analysis was covaried for age and BMI, incomplete FAO explained 34% of the variance in SI and 66% of the variance in HbA1c.
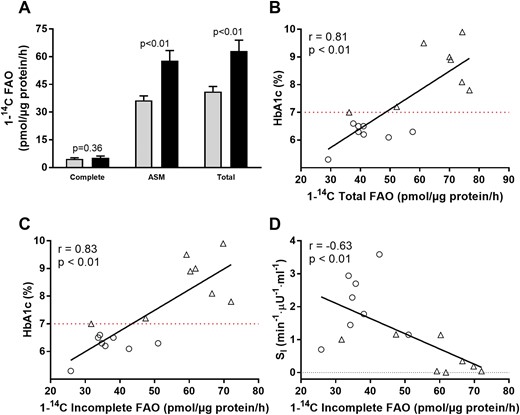
FAO in T2D grouped by glycemic control (HbA1c < 7.0 mg/dL; HbA1c ≥ 7.0 mg/dL). (A) FAO complete, complete oxidation of 1-14C-palmitate to 14CO2; total FAO, complete + incomplete FAO. (B–D) Relationships among HbA1c, SI, and FAO. ○, HbA1c < 7.0 mg/dL (gray bars); Δ, HbA1c ≥ 7.0 mg/dL (black bars).
To investigate where the impairment in FAO might occur, protein content for PDK4, p-ACC/pan-ACC, malonyl CoA decarboxylate (MCD), and β-HAD were measured (Fig. 3). Although no differences were observed in PDK4, p-ACC/pan-ACC, and MCD, β-HAD protein was greater in PCD compared with WCD. Consistent with greater β-HAD protein, β-HAD activity was greater in PCD vs WCD. There was no difference in CS activity, and the β-HAD/CS activity ratio was greater in PCD, suggesting an elevation in β-oxidation relative to the citric acid [tricarboxylic acid (TCA)] cycle. In addition to greater β-HAD protein content, greater β-HAD activity could also be the result of posttranslational modification such as phosphorylation. Insulin phosphorylates several mitochondrial proteins in human skeletal muscle (19); whether allosteric or posttranslational modification of muscle β-HAD occurs with worsening T2D requires further study.
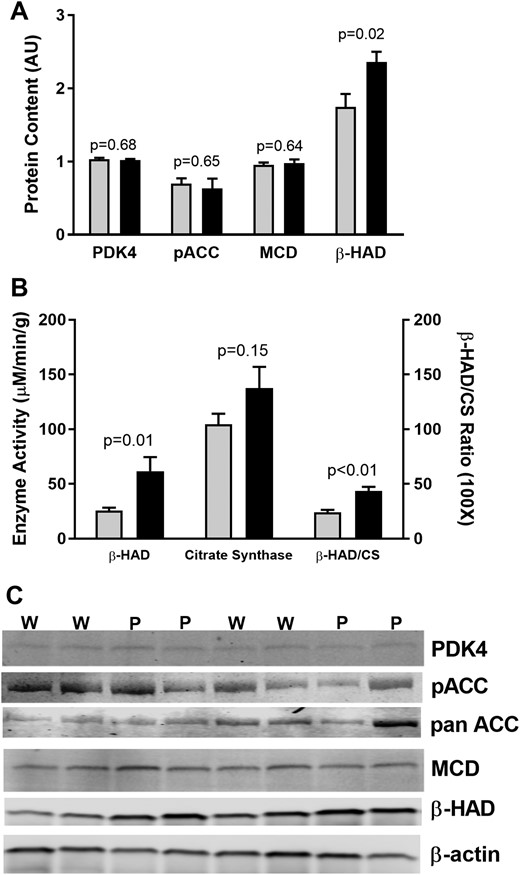
Regulation of FAO in T2D grouped by glycemic control (HbA1c < 7.0 mg/dL; HbA1c ≥ 7.0 mg/dL). (A) Protein content for regulators of FAO. (B) Enzyme activity for β-HAD and citrate synthase. Gray bars, HbA1c < 7.0 mg/dL (W); black bars, HbA1c ≥ 7.0 mg/dL (P).
Gene array data analysis of the National Center for Biotechnology Information GEO dataset GSE18732 found significant correlations between HbA1c and 1114 skeletal muscle molecules with Pearson correlations at P < 0.01 (18). Of these, several FAO-related genes including HADHA (r = 0.50), carnitine palmitoyltransferase 1A (CPT-1α) (r = 0.49), and CPT 1B (CPT-1β) (r = 0.35) were correlated with HbA1c confirming our findings of an upregulation in muscle β-HAD with worsening glycemic control (Table 3). The top 10 canonical pathways in skeletal muscle of T2D patients associated with HbA1c are in Supplemental Table 2.
Correlations Between HbA1c and Skeletal Muscle FAO-Related Genes
| Gene | r Value a |
|---|---|
| ACADL: acyl-CoA dehydrogenase, long chain | 0.50 |
| ACSL3: long-chain-fatty-acid-CoA ligase 3 | 0.36 |
| ACSL4: long-chain-fatty-acid-CoA ligase 4 | −0.37 |
| ADH1C: alcohol dehydrogenase 1C | 0.52 |
| CPT1A: carnitine palmitoyltransferase 1α | 0.49 |
| CPT1B: carnitine palmitoyltransferase 1β | 0.35 |
| CYP19A1 | 0.36 |
| CYP1B1 | 0.50 |
| CYP3A7 | −0.36 |
| CYP4B1 1 | 0.33 |
| HADHA | 0.50 |
| SLC27A1: solute carrier family 27 member 1 | 0.32 |
P ≤ 0.01.
Discussion
The principal findings from the current investigation are: (1) poorly controlled patients with T2D have elevated in vitro skeletal muscle incomplete FAO compared with well controlled T2D; and (2) muscle incomplete FAO is inversely related to muscle SI and glycemic control; whereas maximal mitochondrial respiratory capacity is not different between well and poorly controlled T2D. These findings provide evidence for a link between elevated skeletal muscle incomplete FAO and worsening insulin resistance and glycemic control in type 2 patients with diabetes.
Skeletal muscle mitochondrial function
There are several reports documenting decrements in mitochondrial function between type 2 diabetic patients and nondiabetic controls (20–22). In the current report, we investigated mitochondrial function within T2D patients across glycemic control (WCD and PCD) with the goal of identifying mitochondrial changes associated with poor glycemic control. In addition, we used a multipronged approach in which mitochondrial respiration, mitochondrial content, FAO, and mitochondrial enzyme activities were measured. This comprehensive approach provided a broad perspective on detrimental changes in skeletal muscle that might occur in worsening T2D.
In contrast to reports of reduced mitochondrial respiration (23–25) and content (22, 26) in T2D compared with nondiabetic controls, we found no differences between WCD and PCD patients with diabetes. The lack of difference in respiration was across several different states of respiration (non-ADP supported, ADP supported, uncoupled), substrate entry into complex I or complexes I + II (glutamate or glutamate + succinate), and macronutrient substrate (glutamate or palmitoylcarnitine). There also was no difference in mitochondrial content as measured by complexes I through V protein content. Previously, our group found that reductions in mitochondrial respiration and content are not required for the initial manifestation of insulin resistance (27). Thus, lower mitochondrial respiration and content that exist between T2D compared with non-T2D individuals (22–26) do not further contribute to the progressive worsening in SI and glycemic control in T2D.
Skeletal muscle FAO is regulated at several steps. We investigated if elevated muscle FAO (measured in vitro) could be the result of alterations in PDK4, ACC, MCD, and β-HAD. Although there was no difference in PDK4, ACC, or MCD, there was greater β-HAD protein content and β-HAD activity in PCD vs WCD. Our data point to an elevation in β-oxidation unmatched by increases in the TCA cycle, which would result in an accumulation of acylcarnitines. Consistent with the current findings, high-fat feeding increases muscle incomplete FAO unmatched by compensatory increases in the TCA cycle in both humans and animals (10, 28).
It is recognized that the current study represents a small cohort of WCD and PCD patients. To address this, in silico analysis of the GEO dataset GSE18732 was performed (18). The analysis revealed that elevated HbA1c was associated with skeletal muscle gene expression in T2D patients for: acyl-CoA dehydrogenase, long chain, members of the long-chain fatty-acid-CoA ligase family, alcohol dehydrogenase 1C, CPT-1α and CPT-1β, members of the cytochrome P450 family (CYP19A1, CYP1B1, CYP3A7, CYP4B1), HADHA (the gene that encodes β-HAD), and solute carrier family 27 member 1. Combined, these findings demonstrate a clear upregulation of skeletal muscle FAO with worsening muscle SI and glycemic control and identify the potential for FAO inhibition as an effective treatment in poorly controlled T2D.
Koves et al. (10) found lipid overloading promoted skeletal muscle insulin resistance through the overproduction of acylcarnitines resulting from elevated incomplete FAO. Elevated plasma acylcarnitines have been observed in T2D (29), and incubation of skeletal muscle cells with acylcarnitines results in insulin resistance, possibly through increases in reactive oxygen species (12). It is also possible that elevated fatty acid–derived acetyl-coA could inhibit pyruvate dehydrogenase and contribute to poor glycemic control and insulin resistance in poorly controlled T2D patients via the Randle/glucose-fatty acid cycle (30). If the Randle cycle does explain limits in glucose oxidation in poorly controlled T2D, the current results suggest it is not through altered expression of PDK4, MCD, or ACC phosphorylation.
Worsening glycemic control in T2D
In patients with diabetes, 46% of patients are poorly controlled (HbA1c ≥ 7.0%), documenting a critical need to better understand the underlying pathologies and develop better treatments for poor glycemic control (1). Linear regression identified a significant relationship between HbA1c and SI (skeletal muscle) and trends with AIRg (pancreas) and HOMA-IR (liver). Because HOMA-IR is calculated from fasting glucose and insulin and because fasting glucose is predominantly regulated by the liver, HOMA-IR was used as an index of liver insulin resistance. Stepwise linear regression was then performed between HbA1c and AIRg, SI, and HOMA-IR to identify the contribution of each to explain HbA1c. In the model, SI explained 43% of the variance in HbA1c, whereas AIRg and HOMA-IR did not significantly improve the model. If AIRg and HOMA-IR are forced into the model, the addition in variance explained is a nonsignificant 11% (54% of total variance). The current findings are in agreement with the long-held belief that β-cell function deteriorates with worsening T2D (31) and that higher HbA1c is associated with impaired β-cell function (32). However, the current data support a greater role for poor skeletal muscle SI in worsening T2D than for poor β-cell function.
In conclusion, the current findings suggest that excessive incomplete skeletal muscle FAO explains low SI and poor glycemic control in T2D. Because of the association with longer duration of T2D, early interventions focused on improving skeletal muscle health (SI, metabolism) should be a first-line treatment in recently diagnosed T2D patients to prevent the progressive worsening that occurs in T2D.
Abbreviations:
- ADP
adenosine 5′-diphosphate
- AIRg
acute response to glucose
- ASM
acid-soluble metabolite
- BMI
body mass index
- CoA
coenzyme A
- CS
citrate synthase
- FAO
fatty acid oxidation
- FCCP
trifluorocarbonylcyanide phenylhydrazone
- GEO
Gene Expression Omnibus
- HADHA
hydroxyacyl-coenzyme A
- HbA1c
glycated hemoglobin
- HOMA-β
homeostatic model assessment of β-cell function
- HOMA-IR
homeostatic model assessment of insulin resistance
- IVGTT
intravenous glucose tolerance test
- MCD
malonyl CoA decarboxylate
- p-ACC
phospho-acetyl-CoA carboxylase
- PCD
poorly controlled T2D
- PmFB
permeabilized muscle fiber
- T2D
type 2 diabetic
- TCA
tricarboxylic acid
- Tris
tris(hydroxymethyl)aminomethane
- SI
insulin sensitivity
- WCD
well-controlled T2D.
Acknowledgments
The authors thank Angela Clark and Rita Bowden for their assistance and dedicate this work to our long-time colleague Ed Tapscott, whose support and friendship is missed every day.
Financial Support: This work was supported by an East Carolina Diabetes and Obesity Institute Pilot and Purdue University Research Initiative funds.
Author Contributions: T.P.G. designed the experiments, wrote the manuscript, and researched data. J.M.E., H.B.K., S.E.C., M.A.R., R.T.G., Y.N., J.A.W., and C.-T.L. researched data. W.J.P. and G.L.D. designed the experiments, reviewed/edited the manuscript, and contributed to the discussion. M.D. and M.J.H. researched data, reviewed/edited the manuscript, and contributed to the discussion. S.K. and P.D.N. reviewed/edited the manuscript and contributed to the discussion.
Disclosure Summary: The authors have nothing to declare.
