


Abstract
Context: The rate at which people eat has been suggested to be positively associated with obesity, although appetite and related gut hormones have not been measured.
Objective: The objective of the study was to determine whether eating the same meal at varying speeds elicits different postprandial gut peptide responses.
Design and Setting: This was a crossover study at a clinical research facility.
Study Participants: Seventeen healthy adult male volunteers participated in the study.
Intervention: A test meal consisting of 300 ml ice cream (675 kcal) was consumed in random order on two different sessions by each subject: meal duration took either 5 or 30 min.
Main Outcome Measures: The postprandial response of the orexigenic hormone ghrelin and the anorexigenic peptides peptide YY and glucagon-like peptide-1 over 210 min was assessed. Visual analog scales for the subjective feelings of hunger and fullness were completed throughout each session.
Results: Peptide YY area under the curve (AUC) was higher after the 30-min meal than after the 5-min meal (mean ± sem AUC 5 min meal: 4133 ± 324, AUC 30 min meal: 5250 ± 330 pmol/liter · min, P = 0.004), as was glucagon-like peptide-1 AUC (mean ± sem AUC 5 min meal: 6219 ± 256, AUC 30 min meal: 8794 ± 656 pmol/liter · min, P = 0.001). There was a trend for higher visual analog scale fullness ratings immediately after the end of the 30-min meal compared with immediately after the 5-min meal. There were no differences in ghrelin response.
Conclusions: Eating at a physiologically moderate pace leads to a more pronounced anorexigenic gut peptide response than eating very fast.
The notion that eating quickly may lead to weight gain used to be considered an old wives’ tale. Anecdotal evidence does suggest that faster rates of eating may not induce satiety as thoroughly as a moderate rate, thus leading to overconsumption. Moreover, Maruyama et al. (1) suggested that rate of eating is positively associated with body weight, whereas another study showed that eating fast is independently associated with insulin resistance (2).
Over the last few years, knowledge regarding the mechanisms involved in appetite control has increased. It is now accepted that the immediate postprandial state is characterized by hormonal changes that include a decrease in the concentrations of the orexigenic gut peptide ghrelin, at the same time as an increase in the anorexigenic peptides such as peptide YY (PYY) and glucagon-like peptide (GLP)-1 (3). Ghrelin, PYY, and GLP-1 act on the hypothalamus and play an important regulatory role in the mediation of hunger, satiety, and energy intake (3). Furthermore, the incretin effect that GLP-1 exerts on insulin synthesis and secretion may be key to the postprandial insulin response (4).
Postprandial concentrations of appetite-regulating hormones have not been examined in the context of different rates of eating. We hypothesized that eating more slowly will be associated with more satiety and higher concentrations of anorexigenic peptides and lower orexigenic peptides. Our study examined possible differences in the postprandial responses of ghrelin, PYY, and GLP-1 when identical meals were consumed at two separate sessions of different duration by the same healthy individuals.
Subjects and Methods
All procedures were compliant with the Declaration of Helsinki, and the experimental protocol was approved by the ethics committee of our hospital. Seventeen male volunteers were consecutively recruited and gave written informed consent. All subjects were healthy and were not taking any medication.
On the morning of each study session, subjects arrived at the clinical research facility between 0800 and 0830 h after a 10-h overnight fast. They were weighed and their height, waist, and hip circumferences were measured. Body mass index (BMI) and waist to hip ratio were calculated accordingly. A venous cannula for blood sampling was then inserted into a superficial forearm vein and kept patent by isotonic saline water infusion.
The sessions were performed in random order and at least 1 wk apart from the other. Specifically, the study protocol was fully explained to each subject before the first session, and each subject then drew a lot at the time of venipuncture and completion of the first visual analog scales (VASs) regarding which meal duration would correspond to the specific session. All subjects consumed the same test meal of 300 ml of ice cream (675 kcal, 59% of kcal fat, 33% carbohydrates, 8% protein) at different rates. In one session, the meal was weighed and divided into two equal portions, which were consumed 5 min apart, whereas in the other, it was divided into seven equal portions, which were given to the subject every 5 min and consumed within 30 min. Subjects were instructed to finish each portion in less than 1 min to maintain a uniform rate of meal ingestion. Blood samples for the measurement of glucose, insulin, plasma lipids, ghrelin, PYY, and GLP-1 were drawn before the meal and at 30-min intervals after the beginning of meal consumption until the end of the session 210 min later. VASs for assessment of the subjective feelings of hunger and fullness were completed during the meal and at 30-min intervals after meal termination until the end of the study session.
Analytical methods
Serum glucose was measured with the oxidase-peroxidase method (Zafiropoulos, Athens, Greece). Plasma total cholesterol, high-density lipoprotein cholesterol, and triglycerides were measured enzymatically on an RA-XT analyzer (Technicon, Dublin, Ireland). Plasma insulin was assayed with a commercially available RIA kit [Biosure, Brussels, Belgium; coefficient of variation (CV): 3.3 ± 1.2%]. Established in-house RIAs were used for GLP-1 (5), PYY (6), and ghrelin (7). The GLP-1 assay detected changes of 7.5 pmol/liter, with an intraassay CV of 6.1%. Total PYY-like immunoreactivity was measured with a specific and sensitive RIA. The assay detected changes of 2 pmol/liter, with an intraassay CV of 5.8%. Ghrelin-like immunoreactivity was measured with a specific and sensitive RIA. The assay measures both octanoyl and des octanoyl ghrelin and did not cross-react with any known gastrointestinal or pancreatic peptide hormones. The assay detected changes of 25 pmol/liter with an intraassay CV of 5.5%.
Statistical analysis
Results are reported as mean ± sem. The responses in plasma glucose, insulin, ghrelin, PYY, and GLP-1 were assessed as area under the curve (AUC) of postprandial measurements using the trapezoid rule for each session (AUC 5 min meal and AUC 30 min meal). VASs for hunger and fullness were assessed at the time when the meal was completed as well as in terms of AUC. End points were compared with the use of two-tailed, paired Student t tests (SPSS, Chicago, IL).
Results
Baseline characteristics of the study subjects are displayed in Table 1.
Baseline characteristics of the study subjects (mean ± sem)
| Characteristic | Value |
|---|---|
| Age | 29.7 ± 1.2 yr |
| Weight | 82.4 ± 3.0 kg |
| Height | 1.77 ± 0.02 m |
| BMI | 26.1 ± 0.9 kg/m2 |
| Waist circumference | 88.5 ± 2.5 cm |
| Hip circumference | 103.4 ± 2.2 cm |
| WHR | 0.85 ± 0.01 |
| Fasting glucose 5-min sessiona | 96.2 ± 1.5 mg/dl (5.34 ± 0.08 mmol/liter) |
| Fasting triglycerides 5-min sessiona | 119.9 ± 24.7 mg/dl (1.35 ± 0.28 mmol/liter) |
| Fasting insulin 5-min sessiona | 21.3 ± 5.6 mIU/liter |
| Fasting ghrelin 5-min sessiona | 754.5 ± 71.4 pmol/liter |
| Fasting PYY 5-min sessiona | 15.6 ± 1.4 pmol/liter |
| Fasting GLP-1 5-min sessiona | 23.0 ± 1.4 pmol/liter |
WHR, Waist to hip ratio.
Baseline values did not differ significantly between the two meal sessions.
There was a trend for a higher fullness VAS rating immediately after the end of the meal for the 30-min meal vs. the 5-min meal (mean ± sem: 51.7 ± 4.9 vs. 43.4 ± 4.6 mm, P = 0.09), (Fig. 1B) but no differences in hunger VAS ratings at the same time points (Fig. 1D). Otherwise, fullness VAS ratings increased and hunger ratings decreased, respectively, postprandially in a similar way for both sessions and were not significantly different at any particular time point (Fig. 1, A and C) or in terms of AUC (hunger VAS AUC 5 min meal: 6794.1 ± 896.2 vs. hunger VAS AUC 30 min meal: 7448.8 ± 875.7 mm · min, P = 0.4; fullness VAS AUC 5 min meal: 10447.1 ± 978.6 vs. fullness VAS AUC 30 min meal: 10197.4 ± 969.0 mm · min, P = 0.7).
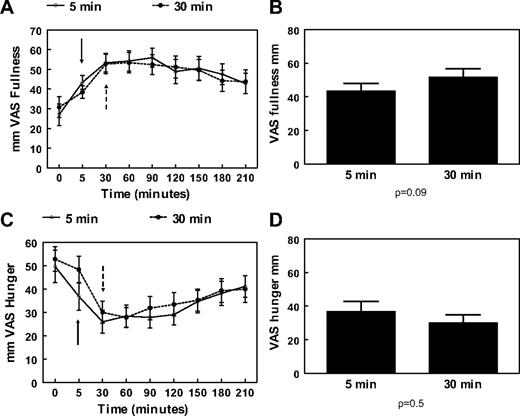
A, Mean and sem changes of VAS for fullness after a 675-kcal meal eaten in 5 min (○) or 30 min (•). B, Mean and sem values of VAS for fullness at the end of a 675-kcal meal eaten in 5 or 30 min. C, Mean and sem changes of VAS for hunger after a 675-kcal meal eaten in 5 min (○) or 30 min (•). D, Mean and sem values of VAS for hunger at the end of a 675-kcal meal eaten in 5 or 30 min. Both meals start at 0 min. Solid arrows indicate end of 5-min meal; dashed arrows indicate end of 30-min meal.
The AUCs for both PYY and GLP-1 responses over 210 min were significantly greater after the 30-min meal than after the 5-min meal (PYY AUC 30 min meal: 5250 ± 330 vs. PYY AUC 5 min meal: 4133 ± 324 pmol/liter · min, P = 0.004, and GLP-1 AUC 30 min meal: 8794 ± 656 vs. GLP-1 AUC 5 min meal: 6219 ± 256 pmol/liter · min, P = 0.001) (Fig. 2, B and D). PYY plasma concentrations were higher after the 30-min meal than the 5-min meal at 90, 120, and 150 min postprandially (Fig. 2A). From 60 to 210 min postprandially, GLP-1 levels were also higher after the 30-min meal (Fig. 2C). There were no differences for ghrelin AUC values (AUC 30 min meal: 129133.1 ± 11392.1 vs. AUC 5 min meal: 136304.2 ± 12619.6 pmol/liter · min, P = 0.3), although there was a trend for lower ghrelin levels at the 120-min time point for the 30-min meal (ghrelin 5 min meal: 651.8 ± 80.3 vs. ghrelin 30 min meal: 539.9 ± 53.7 pmol/liter, P = 0.08) (Fig. 3A). Both insulin and glucose displayed an almost identical postprandial increase and decrease, and there were no differences either between separate time points of each session or in terms of AUC (insulin AUC 30 min meal: 8084.3 ± 1166.7 vs. AUC 5 min meal: 6552.0 ± 827.9 mIU/liter · min, P = 0.2, and glucose AUC 30 min meal: 21038.0 ± 532.4 vs. AUC 5 min meal: 20737.1 ± 306.9 mg/dl · min, P = 0.6), (Figs. 3, B and C).
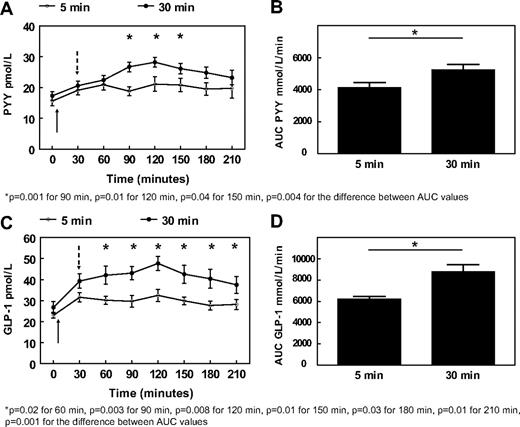
Mean and sem values after a 675-kcal meal eaten in 5 min (○) or 30 min (•) for PYY (A), and GLP-1 (C). Mean and sem values after a 675-kcal meal eaten in 5 or 30 min for PYY AUC over 210 min (B) and GLP-1 AUC over 210 min (D). Both meals start at 0 min. Solid arrows indicate end of 5-min meal; dashed arrows indicate end of 30-min meal.
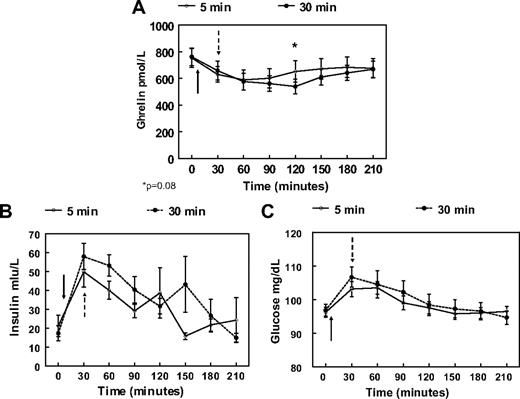
Mean and sem values after a 675-kcal meal eaten in 5 min (○) or 30 min (•) for ghrelin (A), insulin (B), and glucose (C). Both meals start at 0 min. Solid arrows indicate end of 5-min meal; dashed arrows indicate end of 30-min meal.
Discussion
The results of our study suggest that eating at a physiologically moderate pace leads to a more pronounced anorexigenic gut peptide response than eating very fast. PYY and GLP-1 are higher after the 30- vs. the 5-min meals. Thus, eating very quickly elicits a weaker anorexigenic gut hormone response.
Ghrelin is a 28-amino acid peptide hormone that is mainly produced by the gastric fundus and was first recognized as the endogenous ligand for the GH secretagogue receptor (3, 8). It thus stimulates GH secretion but, most importantly, exerts a powerful orexigenic effect through its action on neurons of the arcuate hypothalamic nucleus (3, 8). Ghrelin concentrations rise in the fasted state and decrease rapidly after food ingestion (3). GLP-1 and PYY, on the other hand, are anorexigenic peptides that are produced by the L cells of the gastrointestinal tract, mainly in response to food ingestion (8). PYY acts mainly on the arcuate nucleus, as does GLP-1, which, in addition, exerts its effects on the nucleus of the solitary tract in the brain stem and also acts as an incretin hormone (4, 8).
The importance of the hormones evaluated in the present study in inducing satiety has been highlighted by studies examining the anorectic effect of gastric bypass surgery, in which an exaggerated PYY and GLP-1 postprandial response seems to play an important role in weight loss and glycemic control (9). The role of ghrelin after bariatric operations is controversial, whereas another anorexigenic hormone, cholecystokinin, does not change (9, 10). Still, it may be interesting to assess possible interactions of eating speed with the postprandial response of other gut hormones (e.g. cholecystokinin and pancreatic polypeptide).
The ghrelin postprandial response did not differ significantly between the two sessions, but there was a trend for lower ghrelin levels at the 120-min time point for the 30-min meal, which is consistent with our findings regarding PYY and GLP-1. This suggests that rate of eating may not influence this orexigenic gut hormone as much as the anorexigenic peptides.
In the present study, there was a trend for higher fullness immediately after the end of the 30-min meal compared with immediately after the 5-min meal. Still, no clear-cut differences similar to those of the gut hormone responses were demonstrated in terms of overall response, as expressed by AUC values. VASs remain the best tool we have but are a subjective expression of a person’s perceptions, and as such the standard VAS we used may not have been sensitive enough to discern differences in fullness (11). The nonsignificant change may also suggest that the rate of eating may not be as important as the content of what is eaten when it comes to changes in VAS measured fullness.
We did not expect a difference between glucose and insulin responses after the 5- or 30-min meals. Healthy young individuals should be able to deal with a moderate glycemic load such as the test meal without significantly exaggerated hyperinsulinemic responses or fluctuations in glycemia.
A possible limitation of the present study could be the fact that both normal-weight and overweight subjects were included. However, when these were evaluated separately using a 25-kg/m2 BMI cutoff point, there were no differences between the groups in any of the responses measured. Moreover, the differences between GLP-1 and PYY AUC values remained for the group of overweight subjects, as did the difference between GLP-1 AUC for the normal-weight subjects, whereas the difference in PYY AUC lost significance, probably due to the smaller number of subjects in the latter group (n = 7 vs. 10).
Another possible limitation may be that blood samples were taken at baseline and then at 30-min intervals after meal initiation, thus making it possible for early hormone changes (especially an insulin peak) to be missed. However, given the nature of the study, an earlier time of blood sampling (e.g. at 15 min) in the 30-min meal session would find subjects still eating, thus making results difficult to compare with the 5-min meal. In the case of the postprandial increase in PYY and GLP-1 levels and decrease in ghrelin, previous studies have consistently shown that these can be accurately assessed by sampling protocols similar to ours (9). Although an early insulin peak may have been missed, the almost identical insulin and glucose responses between the two sessions make it improbable that there may have been an overall difference in terms of AUC.
The possible influence that the rate of eating could have on overconsumption of calories has not been addressed by our study, but our data demonstrate the effect of speed eating on hormonal regulators of satiety. Apart from the study by Maruyama et al. (1), three smaller studies point to the speed of eating as a determinant of body weight in children and adults (12–14), whereas one study found no such effect (15). The present study is the first to denote possible physiological mechanisms, namely an increased PYY and GLP-1 response, behind the anorectic effect of adhering to a moderate rate of meal consumption.
In summary, our study demonstrates that eating the same meal over 30 min instead of 5 min leads to higher concentrations of anorexigenic gut peptides and favors earlier satiety. Thus, the warning we were given as children that wolfing down your food will make you fat may in fact have a physiological explanation.
Acknowledgments
Disclosure Summary: The authors have nothing to disclose.
A.K. and C.W.l.R. contributed equally to the paper.
Abbreviations:
- AUC
Area under the curve
- BMI
body mass index
- CV
coefficient of variation
- GLP
glucagon-like peptide
- PYY
peptide YY
- VAS
visual analog scale
