


Abstract
Physical activity (PA) is associated with 25-hydroxyvitamin D [25(OH)D] levels. Both are associated with atherosclerotic cardiovascular disease (ASCVD), but their joint association with ASCVD risk is unknown.
To examine the relationship between PA and 25(OH)D, and assess effect modification of 25(OH)D and PA with ASCVD.
Cross-sectional and prospective study.
Community-dwelling cohort.
A total of 10,342 participants free of ASCVD, with moderate- to vigorous-intensity PA assessed (1987 to 1989) and categorized per American Heart Association (AHA) guidelines (recommended, intermediate, or poor).
Serum 25(OH)D levels (1990 to 1992) and ASCVD events (i.e., incident myocardial infarction, fatal coronary disease, or stroke) through 2013.
Participants had mean age of 54 years, and were 57% women, 21% black, 30% 25(OH)D deficient [<20 ng/mL (<50 nmol/L)], and <40% meeting AHA-recommended PA. PA was linearly associated with 25(OH)D levels in whites. Whites meeting recommended PA were 37% less likely to have 25(OH)D deficiency [relative risk, 0.63 (95% confidence interval [CI], 0.56, 0.71)]; there was no significant association in blacks. Over 19.3 years of follow-up, 1800 incident ASCVD events occurred. Recommended PA was associated with reduced ASCVD risk [hazard ratio [HR], 0.78 (95% CI, 0.65, 0.93) and 0.76 (95% CI, 0.62, 0.93)] among participants with intermediate [20 to <30 ng/mL (50 to <75 nmol/L)] and optimal [≥30 ng/mL (≥75 nmol/L)] 25(OH)D, respectively, but not among those with deficient 25(OH)D (P for interaction = 0.04).
PA is linearly associated with higher 25(OH)D levels in whites. PA and 25(OH)D may have synergistic beneficial effects on ASCVD risk.
Atherosclerotic cardiovascular disease (ASCVD) is the leading cause of morbidity and mortality worldwide (1, 2). ASCVD can be effectively prevented through lifestyle modification and treatment of risk factors (3). Engaging in regular physical activity (PA) is one of the most commonly recommended methods to prevent ASCVD; the inverse association between PA and cardiovascular risk has been well established (4, 5). The American Heart Association (AHA) guidelines recommend at least 150 min/wk of moderate to vigorous PA to lower blood pressure (BP) and low-density lipoprotein cholesterol (LDL-C) and reduce ASCVD risk (6).
Although vitamin D is primarily known for its role in calcium homeostasis and bone health, epidemiological evidence has linked serum 25-hydroxyvitamin D [25(OH)D] deficiency with increased ASCVD risk (7, 8). Although the mechanisms underlying this association are not fully elucidated, it is thought that vitamin D primarily affects ASCVD risk factors such as hypertension, diabetes, and inflammation (7, 9). The association of 25(OH)D deficiency with ASCVD may also differ by race, conferring greater ASCVD risk in whites despite lower mean 25(OH)D levels in blacks (10–12).
Individuals with low PA are known to have lower 25(OH)D levels (13–19). Additionally, there is evidence for a positive dose-response relationship between PA and 25(OH)D (14-16), but further studies are required with larger and more diverse patient populations. Furthermore, the nature of the association between PA and 25(OH)D levels has not been fully explored. Much of this association has been attributed to increased cutaneous vitamin D synthesis from sunlight exposure while exercising outdoors (13, 19). However, certain studies have found this relationship to persist even with indoor PA and after accounting for sunlight exposure (16). Meanwhile, biological and clinical studies have suggested that vitamin D plays a role in muscle function and postural stability (20–22). Thus, vitamin D may also influence physical performance and lead to increased PA.
Despite abundant evidence that PA and 25(OH)D are each individually related to cardiovascular outcomes, their joint association with ASCVD outcomes has been largely unexplored. A recent study by Donneyong et al. (19) found evidence that outdoor recreational activity and 25(OH)D may interact synergistically to reduce the risk of cardiovascular disease mortality. However, further studies must be done to formally test for an interaction and to explore differences by race. Because both 25(OH)D and PA levels are potentially modifiable in individuals, this information might help refine future prevention strategies regarding ASCVD risk.
We examined the association between PA and 25(OH)D, and the prospective association between PA and ASCVD outcomes according to 25(OH)D status, in the Atherosclerosis Risk in Communities (ARIC) Study. We hypothesized that there would be a linear dose-response relationship between PA and 25(OH)D, with a plateau at higher PA levels, that this association would be stronger among whites compared with blacks, and that 25(OH)D and PA would jointly influence ASCVD risk.
Methods
Study population
The ARIC Study is an ongoing, mostly biracial, prospective cohort that enrolled 15,792 men and women aged 45 to 64 years from four US communities—Forsyth County, North Carolina; Jackson, Mississippi; suburbs of Minneapolis, Minnesota; and Washington County, Maryland—at baseline/visit 1 (1987 to 1989) (23). Participants took part in up to four additional visits: visit 2 (1990 to 1992), visit 3 (1993 to 1995), visit 4 (1996 to 1998), and visit 5 (2011 to 2013). We excluded from our analysis those with prevalent coronary heart disease (n = 675), prevalent heart failure (n = 558), or prevalent stroke at visit 1 (n = 461); those missing PA data at visit 1 (n = 1309) or 25(OH)D data at visit 2 (n = 2174); and those missing covariate information (n = 181). We also excluded nonblack or nonwhite race (n = 45) and blacks from the Minnesota and Maryland centers (n = 47) because of small numbers that precluded ability to adjust for race/center groups. After exclusions, 10,342 participants were included in the analyses. The institutional review boards at all ARIC study sites and the coordinating center approved study protocols. All participants provided written informed consent at each study visit.
Physical activity
At both visits 1 and 3, a modified Baecke questionnaire was used to assess sports, leisure, and work PAs (24). Data were used from the sports questionnaire. Participants reported involvement in up to four sports within the previous year, and the number of hours per week and months per year spent on each sport. We converted each sport into metabolic equivalents of task (METS) per the Compendium of Physical Activities (25), calculated minutes per week of moderate (3–6 METS) or vigorous (≥6 METS) PA, and categorized these into three groups according to the AHA guidelines as follows: “recommended” (≥150 min/wk of moderate intensity or ≥75 min/wk of vigorous intensity or ≥150 min/wk of moderate plus vigorous intensity), “intermediate” (1 to 149 min/wk of moderate intensity or 1 to 74 min/wk of vigorous intensity or 1 to 149 min/wk moderate plus vigorous intensity), or “poor” (0 min/wk of moderate or vigorous exercise). We also calculated PA in METS × minutes per week (METS*min/wk) to model PA continuously. We used the PA level from visit 1 for our primary analyses. In a sensitivity analysis, we examined the mean of PA levels of visits 1 and 3 in METS*min/wk as a surrogate for PA levels at visit 2 (which were not available).
Vitamin D
From serum samples taken after fasting at visit 2 and frozen at −70°C, 25(OH)D2 and 25(OH)D3 levels were measured from 2012 to 2013 using liquid chromatography tandem high-sensitivity mass spectrometry (Waters Alliance e2795; Waters, Milford, MA). Prior studies have shown 25(OH)D to have excellent long-term stability in frozen samples (26, 27). Using duplicate samples, the coefficient of variation for 25(OH)D2 was 20.8% and 6.9% for 25(OH)D3. The intraclass correlation coefficients from the blind duplicate samples, calculated using the function icc() in the R package irr (R project, https://www.r-project.org/), were 0.96 (95% confidence interval [CI], 0.95, 0.96) for 25(OH)D2 and 0.91 (95% CI, 0.86, 0.92) for 25(OH)D3. 25(OH)D2 and 25(OH)D3 were added together for total 25(OH)D concentration.
We adjusted for seasonal changes by computing residuals from a linear regression model with 25(OH)D as the dependent variable and month of visit as the independent variable. The residuals were added back to the overall mean to determine an estimated annual 25(OH)D value (18). To convert 25(OH)D levels to nmol/L from ng/mL, values were multiplied by 2.496. Using the Institute of Medicine guidelines (28), we considered deficient 25(OH)D as <20 ng/mL [<50 nmol/L] and adequate as ≥20 ng/mL (28). We also considered three categories of 25(OH)D recommended by the Endocrine Society: <20 ng/mL (deficient), 20 to <30 ng/mL (intermediate), and ≥30 ng/mL (optimal) (29).
Covariates of interest
Participant characteristics were obtained from history, physical examination, and laboratory data from visit 1, except as otherwise noted. The main covariates included were age, race/center (Minnesota-whites; Maryland-whites; North Carolina-whites; North Carolina-blacks; Mississippi-blacks), sex, education, smoking status, alcohol intake, body mass index (BMI), diabetes (defined as fasting glucose ≥126 mg/dL or nonfasting glucose ≥200 mg/dL, a self-reported physician diagnosis of diabetes, or current use of hypoglycemic medication). Systolic blood pressure (SBP) was the mean calculated from the second and third measurements of three obtained. Hypertension was defined as SBP ≥140 mm Hg, or a diastolic BP ≥90 mm Hg, or reported use of BP-lowering medications. Total cholesterol, high-density lipoprotein cholesterol (HDL-C), and triglyceride levels were measured using standardized enzymatic assays and reported in milligrams per deciliter. Estimated glomerular filtration rate (eGFR) was calculated from serum creatinine from blood samples collected at visit 2 using the Chronic Kidney Disease Epidemiology Collaboration formula (30).
Outcomes
The cross-sectional analysis of PA and 25(OH)D was nonconcurrent because PA was measured at visit 1 and 25(OH)D at visit 2. For this analysis, the primary outcome was 25(OH)D levels at visit 2. In the prospective analysis, the primary outcome was incident ASCVD following visit 2, defined as definite or probable myocardial infarction, definite coronary death, and definite or probable stroke (defined as sudden or rapid onset of neurologic symptoms that lasted for 25 hours or led to death in the absence of another cause). Information on hospitalizations was obtained from participants via yearly telephone calls, and vital records were examined for all deaths. Additionally, ARIC investigators conducted continuous surveillance for all cardiovascular disease-related hospitalizations and deaths. An ARIC committee adjudicated all ASCVD events. Study participants contributed follow-up time from the date of the participant’s visit 2 date [when 25(OH)D was measured] until the date of incident ASCVD event, death, loss to follow-up, or the end of follow-up (31 December 2013), whichever came first.
Statistical analysis
All analyses were progressively adjusted as follows: model 1 (our primary model) adjusted for demographics of age, sex, and race/center, as well as confounding lifestyle factors such as education, smoking status, and alcohol intake. Model 2 additionally included potential mediating variables of the association between PA or vitamin D and ASCVD risk: SBP, antihypertensive medication use, diabetes, total and HDL cholesterol levels, use of lipid-lowering medications, and eGFR. Model 3 additionally included BMI, another potential mediator.
First, Poisson regression models [for binary 25(OH)D status] and linear regression models [for continuous 25(OH)D] were used to analyze the relationship between levels of PA at visit 1 and 25(OH)D levels at visit 2. To determine if there was a linear dose-response, we modeled the association between PA in METS*min/wk with the difference in 25(OH)D levels (measured in nanograms per milliliter) using restricted cubic spline models. In a sensitivity analysis, we modeled the association of the average of visit 1 and visit 3 PA levels with 25(OH)D concentrations.
Then, we performed prospective analyses to evaluate 25(OH)D as a potential effect modifier of the association between PA and incident ASCVD. We used progressively adjusted Cox models to assess the association of PA categories at visit 1 with incident ASCVD events stratified by 25(OH)D status at visit 2 (deficient, intermediate, and optimal). The comparator reference for these analyses were those with both poor PA and deficient 25(OH)D levels. An interaction term between PA and 25(OH)D categories was included in the Cox models, adjusted for model 1 covariates, and the Wald test was used to test the significance of the interaction and to determine if PA and 25(OH)D levels jointly influenced ASCVD.
We tested for interactions by race. All statistical analyses were performed using Stata 12 (StataCorp, College Station, TX). P ≤ 0.05 was considered statistically significant.
Results
Cross-sectional association between PA and 25(OH)D
Baseline characteristics of the study population at visit 1 by AHA categories of PA levels are presented in Table 1. The mean age (± standard deviation) was 53.8 ± 5.7 years, 57.5% were women, 20.7% of participants were black, and 39.6% achieved AHA-recommended PA levels. The overall mean 25(OH)D level at visit 2 was 24.7 ± 8.5 ng/mL. Those achieving recommended PA had a higher mean level of 25(OH)D (26.6 ± 8.3 ng/mL) compared with participants with intermediate and poor PA (24.4 ± 8.2 and 22.7 ± 8.3 ng/mL, respectively). Similarly, participants achieving recommended PA levels had higher levels of HDL-C, lower levels of triglycerides, lower BMI, and were less likely to be hypertensive, diabetic and current smokers (all P < 0.001).
Baseline Characteristics by AHA-Defined Categories of PA: ARIC Study (1987–1989)
| AHA-PA Categories at ARIC Visit 1 | Overall | Recommended | Intermediate | Poor | Pa |
|---|---|---|---|---|---|
| Patients, no. | 10,342 | 4095 | 2671 | 3576 | |
| METS*min/wkb | 402.0 (0.0–993.6) | 1175.9 (874.8–1700.1) | 339.3 (189.0–489.0) | 0.0 (0.0–0.0) | |
| Age, y | 53.8 ± 5.7 | 54.1 ± 5.7 | 53.7 ± 5.7 | 53.5 ± 5.6 | <0.001 |
| 25(OH)D, ng/mLc,d | 24.7 ± 8.5 | 26.6 ± 8.3 | 24.4 ± 8.2 | 22.7 ± 8.3 | <0.001 |
| Vitamin D supplement usee | 3279 (31.7) | 1440 (35.2) | 891 (33.4) | 948 (26.5) | <0.001 |
| Total cholesterol, mg/dLc | 214.3 ± 40.9 | 213.2 ± 39.4 | 214.9 ± 41.6 | 215.0 ± 42.0 | 0.11 |
| HDL, mg/dLc | 52.6 ± 16.9 | 53.2 ± 17.3 | 52.4 ± 16.2 | 52.0 ± 17.1 | <0.001 |
| LDL, mg/dLc | 136.7 ± 38.3 | 135.6 ± 37.4 | 137.4 ± 38.5 | 137.4 ± 39.1 | 0.06 |
| Triglycerides, mg/dLc | 127.4 ± 84.1 | 124.3 ± 80.2 | 128.1 ± 82.3 | 130.5 ± 89.6 | 0.01 |
| BMI, kg/m2 | 27.4 ± 5.1 | 26.6 ± 4.4 | 27.1 ± 5.0 | 28.4 ± 5.7 | <0.001 |
| Men | 4396 (42.5) | 1962 (47.9) | 1025 (38.4) | 1409 (39.4) | <0.001 |
| Center/race | <0.001 | ||||
| Minneapolis, MN/white | 2963 (28.7) | 1423 (34.7) | 817 (30.6) | 723 (20.2) | |
| Washington Co., MD/white | 2770 (26.8) | 1095 (26.7) | 730 (27.3) | 945 (26.4) | |
| Forsyth Co., NC/white | 2468 (23.9) | 1103 (26.9) | 649 (24.3) | 716 (20.0) | |
| Forsyth Co., NC/black | 241 (2.3) | 82 (2.0) | 88 (3.3) | 71 (2.0) | |
| Jackson, MI/black | 1900 (18.4) | 392 (9.6) | 387 (14.5) | 1121 (31.3) | |
| Education | <0.001 | ||||
| < High school | 1898 (18.4) | 478 (11.7) | 424 (15.9) | 996 (27.9) | |
| High school or vocational school | 4401 (42.6) | 1669 (40.8) | 1180 (44.2) | 1552 (43.4) | |
| College, graduate, or professional school | 4043 (39.1) | 1948 (47.6) | 1067 (39.9) | 1028 (28.7) | |
| Smoking status | <0.001 | ||||
| Never | 4720 (45.6) | 1861 (45.4) | 1275 (47.7) | 1584 (44.3) | |
| Former | 3353 (32.4) | 1499 (36.6) | 831 (31.1) | 1023 (28.6) | |
| Current | 2269 (21.9) | 735 (17.9) | 565 (21.2) | 969 (27.1) | |
| Current alcohol consumption | 6114 (59.1) | 2733 (66.7) | 1607 (60.2) | 1774 (49.6) | <0.001 |
| Diabetes | 890 (8.6) | 282 (6.9) | 221 (8.3) | 387 (10.8) | <0.001 |
| SBP, mm Hg | 119.5 ± 17.4 | 118.2 ± 16.8 | 118.7 ± 17.0 | 121.5 ± 18.0 | <0.001 |
| Hypertension | 2970 (28.8) | 1013 (24.8) | 732 (27.5) | 1225 (34.4) | <0.001 |
| AST, U/Lb,d | 20.0 (17.0–23.0) | 20.0 (17.0–23.0) | 20.0 (17.0–23.0) | 19.0 (16.0–23.0) | <0.001 |
| ALT, U/Lb,d | 15.0 (11.0–19.0) | 15.0 (11.0–19.0) | 15.0 (11.0–19.0) | 14.0 (11.0–19.0) | 0.05 |
| GGT, U/Lb,d | 20.0 (14.0–32.0) | 20.0 (14.0–30.0) | 20.0 (14.0–31.0) | 22.0 (15.0–34.0) | <0.001 |
| eGFR, mL/min/1.73 m2 | <0.001 | ||||
| ≥90 | 8776 (84.9) | 3406 (83.2) | 2262 (84.7) | 3108 (86.9) | |
| 60–<90 | 1489 (14.4) | 660 (16.1) | 383 (14.3) | 446 (12.5) | |
| <60 | 77 (0.7) | 29 (0.7) | 26 (1.0) | 22 (0.6) |
Data are given as mean ± standard deviation or number (%) unless otherwise noted.
Abbreviations: ALT, alanine aminotransferase; AST, aspartate aminotransferase; Co., County; GGT, gamma-glutamyl transferase.
P value comparing trend of characteristics across the PA categories of Recommended, Intermediate, and Poor.
Median (25th to 75th percentile).
To convert 25(OH)D levels to nmol/L from ng/mL, multiply by 2.496. To convert the units of measure of total cholesterol, HDL-C, and LDL-C to mmol/L from mg/dL, divide by 38.67. To convert the unit of measure of triglyceride to mmol/L from mg/dL, divide by 88.57.
From ARIC visit 2 (1990 to 1992).
From ARIC visit 3 (1993 to 1995).
After accounting for differences in demographics and lifestyle factors, participants with AHA-recommended PA levels at baseline had a 31% lower risk of being 25(OH)D deficient at Visit 2 compared with those with a poor PA level [relative risk 0.69 (95% CI, 0.63 to 0.75), Model 1; Table 2]. This association remained statistically significant even after additional adjustment for ASCVD risk factors, including BMI. Participants with intermediate PA had a tendency toward lower risk of 25(OH)D deficiency, but this association was not statistically significant [mean, 0.91 (95% CI, 0.84, 1.00); model 1].
Adjusted Associations Between Physical Activity Levels at ARIC Visit 1 and 25(OH)D Levels at ARIC Visit 2
| Model 1a | Model 2b | Model 3c | |
|---|---|---|---|
| Relative risk ratio (95% CI)d for deficient 25(OH)D <20 ng/mLe by PA levels | |||
| AHA-defined PA categories | |||
| Poor (reference) | Reference (1) | Reference (1) | Reference (1) |
| Intermediate | 0.91 (0.84, 1.00) | 0.94 (0.86, 1.02) | 0.95 (0.87, 1.04) |
| Recommended | 0.69 (0.63, 0.75) | 0.71 (0.65, 0.77) | 0.72 (0.66, 0.79) |
| METS*min/wk (per 100) | 0.97 (0.97, 0.98) | 0.97 (0.97, 0.98) | 0.97 (0.97, 0.98) |
| Differences [β coefficient (95% CI)]f in continuous 25(OH)D levels (ng/mL)e by PA levels | |||
| Poor (reference) | Reference (0) | Reference (0) | Reference (0) |
| Intermediate | 0.78 (0.39, 1.18) | 0.66 (0.26, 1.05) | 0.49 (0.10, 0.89) |
| Recommended | 2.40 (2.03, 2.77) | 2.18 (1.81, 2.54) | 1.97 (1.61, 2.34) |
| METS*min/wk (per 100) | 0.17 (0.15, 0.19) | 0.15 (0.13, 0.17) | 0.14 (0.12, 0.16) |
Data in bold type are statistically significant.
Model 1: Age, sex, race/center, education, smoking status, and alcohol intake.
Model 2: Model 1 plus additional potential mediating variables (of the association between PA or vitamin D and ASCVD risk): SBP, antihypertensive medication use, diabetes, total and HDL cholesterol levels, use of lipid-lowering medications, and eGFR.
Model 3: Model 2 plus BMI.
Relative risk ratios for vitamin D deficiency [<20 ng/mL (<50 nmol/L)] vs adequate 25(OH)D by PA levels were derived from Poisson regression models.
To convert 25(OH)D levels to nmol/L from ng/mL, multiply by 2.496.
β coefficients were derived from linear regression models and represent the differences (in ng/mL) in 25(OH)D levels by PA levels.
There was also a positive association between PA categories and continuous 25(OH)D levels (Table 2). Compared with the group with poor PA, among those with intermediate and recommended PA levels, the adjusted mean 25(OH)D levels were higher: 0.78 ng/mL (95% CI, 0.39, 1.18 ng/mL) and 2.40 ng/mL (95% CI, 2.03, 2.77 ng/mL), respectively, independent of demographic and lifestyle factors (model 1). Again, similar findings were seen when further adjusted for potential mediators of this association.
PA level was also positively associated with 25(OH)D concentrations when PA was modeled as a continuous variable. In adjusted restricted cubic spline models, the association of PA (METS*min/wk) and 25(OH)D levels was nearly linear (Fig. 1), with no evidence of a dose threshold. However, this linear relationship was only seen in whites. Among blacks, 25(OH)D levels plateaued at higher PA levels, although this was based on fewer observations (Fig. 2).
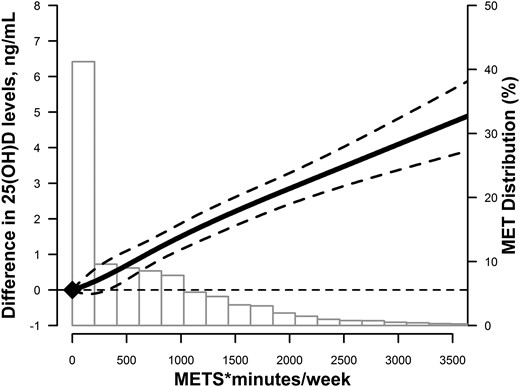
Adjusted restricted cubic spline model showing the difference in 25(OH)D (95% CIs) by PA levels (in METS*min/wk) at ARIC visit 1 in the overall study. The model was adjusted age, sex, race/center, education, smoking status, alcohol intake, SBP, antihypertensive medication use, diabetes, total and HDL cholesterol, use of lipid-lowering medications, estimated GFR, and BMI.
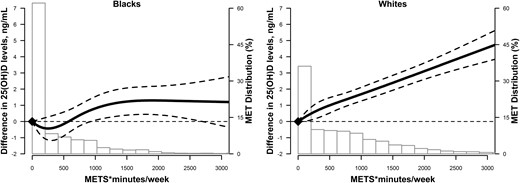
Adjusted restricted cubic spline model showing racial differences in 25(OH)D (95% CIs) by PA levels (in METS*min/wk) at ARIC visit 1 stratified by race. The solid line represents the difference and the dashed lines represent the 95% CIs. Knots are at the 5th, 35th, 65th, and 95th percentiles (corresponding to 0, 38, 745, and 2189 min/wk). The spline is centered at score 0. Histogram shows the distribution of PA levels. Restricted cubic spline is truncated at the first and 99th percentiles of PA levels. The model was adjusted age, sex, race/center, education, smoking status, alcohol intake, SBP, antihypertensive medication use, diabetes, total and HDL cholesterol, use of lipid-lowering medications, estimated GFR, and BMI.
The association between PA levels and 25(OH)D was significantly different by race (P for interaction < 0.001). Whereas higher PA levels were associated with lower risk of vitamin D deficiency among whites, this association was not seen in blacks (Table 3). In fully adjusted models, the relative risk of 25(OH)D deficiency for recommended levels of PA compared with poor PA was 0.63 (95% CI, 0.56, 0.71) in whites and 0.93 (95% CI, 0.90, 1.07) in blacks. However, recommended PA was associated with higher adjusted average 25(OH)D levels in both whites and blacks; however, the average differences were larger in whites (Table 3).
Adjusted Associationsa Between PA Levels at ARIC Visit 1 and 25(OH)D at ARIC Visit 2, Stratified by Race
| White Race (n = 8201) | Black Race (n = 2141) | |
|---|---|---|
| Relative risk ratio (95% CI)b for deficient 25(OH)D <20 ng/mLd | ||
| AHA-defined PA categories | ||
| Poor (reference) | Reference (1) | Reference (1) |
| Intermediate | 0.85 (0.76, 0.95) | 1.07 (0.93, 1.23) |
| Recommended | 0.63 (0.56, 0.71) | 0.93 (0.80, 1.07) |
| METS*min/wk (per 100) | 0.96 (0.96, 0.97) | 1.00 (0.99, 1.00) |
| Difference [β coefficient (95% CI)]c in continuous 25(OH)D levelsd | ||
| PA levels | ||
| Poor (reference) | Reference (0) | Reference (0) |
| Intermediate | 0.79 (0.32, 1.25) | −0.28 (−0.97, 0.41) |
| Recommended | 2.25 (1.83, 2.67) | 0.79 (0.09, 1.49) |
| METS*min/wk (per 100) | 0.15 (0.13, 0.18) | 0.05 (0.01, 0.10) |
Data in bold type indicate P values for race interaction < 0.001 for all comparisons (PA categories and continuous PA levels).
Models are adjusted age, sex, race/center, education, smoking status, alcohol intake, SBP, antihypertensive medication use, diabetes, total and HDL cholesterol levels, use of lipid-lowering medications, eGFR, and BMI.
Relative risk ratios for vitamin D deficiency [<20 ng/mL (<50 nmol/L)] vs adequate 25(OH)D by PA levels were derived from Poisson regression models.
β coefficients were derived from linear regression models and represent the differences (in ng/mL) in 25(OH)D levels by PA levels.
To convert 25(OH)D levels to nmol/L from ng/mL, multiply by 2.496.
Because PA levels were assessed at visit 1 and 25(OH)D levels measured at visit 2, in a sensitivity analysis, we also explored the association between 25(OH)D and the mean of PA levels between visits 1 and 3 (as a proxy for PA at visit 2; Supplemental Table 1). The results were consistent with the associations seen using only visit 1 PA levels (Supplemental Table 2).
Prospective joint relationship between PA and 25(OH)D on ASCVD risk
Over a mean follow-up of 19.3 years, there were 1800 incident ASCVD events. The adjusted hazards of PA groups with incident ASCVD, stratified by vitamin D status, are summarized in Table 4. An interaction was present between PA and 25(OH)D status on ASCVD risk (P = 0.04). Among participants with optimal vitamin D levels (≥30 ng/mL), those achieving intermediate or recommended PA levels [compared with those with poor PA/deficient 25(OH)D] had >35% lower hazard of incident ASCVD independent of demographic and lifestyle factors [HR, 0.64 (95% CI, 0.50, 0.83) and 0.62 (95% CI, 0.51, 0.76), respectively; model 1]. This association remained significant even after adjusting for additional potential mediating factors, including BMI. Among participants with intermediate 25(OH)D levels (i.e., 20 to <30 ng/mL), those who achieved recommended PA levels compared with those with poor PA and deficient 25(OH)D levels had a 28% lower hazard of incident ASCVD, independent of demographic and lifestyle factors. This remained significant after further adjusting for additional potential mediators. Participants with intermediate 25(OH)D levels and intermediate PA did not show a statistically significant reduced hazard of incident ASCVD. Among those with deficient 25(OH)D, achieving intermediate and recommended PA levels was not associated with reduced ASCVD risk.
Hazard Ratios (95% CI)a for the Association of PA with Risk of Incident ASCVD Over 21 Years Follow-Up Stratified by Vitamin D Status: The ARIC Study From ARIC Visit 2 (1990–1992) through December 2013
| AHA Categories | No. of Events/Total No. | IR | Model 1b | Model 2c | Model 3d |
|---|---|---|---|---|---|
| Vitamin D deficient (<20 ng/mL)e (n = 3140) | |||||
| Poor (reference) | 287/1440 | 10.5 | Reference (1) | Reference (1) | Reference (1) |
| Intermediate | 143/840 | 8.9 | 0.84 (0.69, 1.03) | 0.84 (0.68, 1.03) | 0.84 (0.69, 1.03) |
| Recommended | 135/860 | 8.4 | 0.86 (0.70, 1.06) | 0.91 (0.74, 1.12) | 0.92 (0.74, 1.13) |
| Vitamin D intermediate (20 to <30 ng/mL)b (n = 4664) | |||||
| Poor (reference) | 301/1519 | 10.5 | 0.84 (0.71, 1.00) | 0.90 (0.76, 1.07) | 0.91 (0.77, 1.08) |
| Intermediate | 226/1226 | 9.4 | 0.90 (0.75, 1.08) | 0.96 (0.80, 1.16) | 0.98 (0.81, 1.18) |
| Recommended | 306/1919 | 8.2 | 0.72 (0.61, 0.86) | 0.77 (0.65, 0.92) | 0.78 (0.65, 0.93) |
| Vitamin D optimal (≥30 ng/mL)b (n = 2538) | |||||
| Poor (reference) | 137/617 | 11.9 | 0.95 (0.77, 1.18) | 1.05 (0.85, 1.30) | 1.07 (0.86, 1.33) |
| Intermediate | 86/605 | 7.2 | 0.64 (0.50, 0.83) | 0.74 (0.57, 0.95) | 0.75 (0.58, 0.97) |
| Recommended | 179/1316 | 6.8 | 0.62 (0.51, 0.76) | 0.75 (0.61, 0.92) | 0.76 (0.62, 0.93) |
P interaction = 0.04 for PA and 25(OH)D categories on incident ASCVD risk using Model 1 covariates. Data in bold type are statistically significant.
Abbreviation: IR, crude incidence per 1000 person-years.
From Cox hazard models.
Model 1: age, sex, race/center, education, smoking status, and alcohol intake
Model 2: Model 1 plus additional potential mediating variables (of the association between PA or vitamin D and ASCVD risk): SBP, antihypertensive medication use, diabetes, total and HDL cholesterol levels, use of lipid-lowering medications, and eGFR.
Model 3: Model 2 plus BMI.
To convert 25(OH)D levels to nmol/L from ng/mL, multiply by 2.496.
There was no effect modification by race in the associations of PA by 25(OH)D status for ASCVD events (P for interaction = 0.67).
Discussion
This study provides information about the interrelation between PA and 25(OH)D, both cross-sectionally and prospectively, as they relate to ASCVD risk. Although recommended PA was associated with higher mean 25(OH)D levels in both whites and blacks, the relationship was more linear and much stronger among whites than blacks. We also provide information about the synergistic benefit of combined higher PA and 25(OH)D levels on reducing ASCVD risk. These findings suggest that future clinical strategies to prevent ASCVD may be more effective by increasing suboptimal levels of 25(OH)D in addition to efforts to increase PA.
Cross-sectional association between PA and 25(OH)D
Only ∼40% of our study population achieved AHA-recommended levels of PA at baseline and 30% were 25(OH)D deficient (<20 ng/mL), which is somewhat consistent with the general US population. The Centers for Disease Control and Prevention reported that approximately 52% of US adults met the guidelines for aerobic activity in 2011 (31). The National Health and Nutrition Examination Survey (NHANES) found >40% of the US population was deficient in 25(OH)D (32).
PA was associated with elevated levels of 25(OH)D in other studies (13–15, 17–19). Kluczynski et al. (17) found a significant trend between incremental increases in recreational PA and increased 25(OH)D. However, their study was performed in a smaller sample size (n = 1343) consisting of postmenopausal women; therefore, results might not be generalizable to a larger diverse population. A larger study from NHANES (n = 6370) also found evidence of a linear relationship between objectively measured PA and 25(OH)D. Each additional 10 minutes of moderate to vigorous activity per day was associated with 0.32 ng/mL higher serum 25(OH)D (16). However, PA was only assessed categorically in that study. Using a continuous model of PA, our study found evidence of a positive linear dose-response relationship between PA and 25(OH)D levels without a dose threshold. However, this relationship was more significant in whites.
There are several mechanisms by which PA can affect vitamin D levels. One primary mechanism is through outdoor exposure to sunlight. UV radiation interacts with cutaneous 7-dehydrocholesterol to produce previtamin D3, which then isomerizes to vitamin D3 (33). It is estimated that >90% of the vitamin D required comes from sunlight exposure (34). Many studies analyzing the interrelation between PA and 25(OH)D have attributed the correlation to outdoor exercise exposure. A cross-sectional analysis using NHANES-III data found no correlation between indoor activity and 25(OH)D levels (13). However, Wanner etal. (16) did not find a stronger association between PA and 25(OH)D for outdoor activities compared with indoor activities, suggesting there may be other mechanisms by which PA and 25(OH)D interact. BMI is inversely correlated with 25(OH)D levels, which, in part, may be due to vitamin D sequestering in adipose tissue (35). Therefore, increased PA may promote increased 25(OH)D levels by decreasing BMI. However, even after adjusting for BMI (a potential mediator) in our analyses, we still found a correlation between PA and 25(OH)D.
Greater skin pigmentation reduces vitamin D production in the skin (36); thus, increased outdoor PA might have a greater effect on increasing 25(OH)D levels in whites compared with blacks. This phenomenon could explain the lack of significant dose response between PA and 25(OH)D level in blacks. Other studies have also shown that PA is not significantly associated with 25(OH)D levels in blacks (37). In fact, one study found that 25(OH)D levels in non-Hispanic blacks engaging in regular outdoor activities were lower than that of inactive non-Hispanic whites (13). Thus, increasing PA is not an equally effective method for improving 25(OH)D deficiency among different races, and alternative strategies should be explored for targeting different populations.
Other studies have suggested a nonlinear association between UVB exposure and 25(OH)D levels and there may be a UVB-dose threshold in 25(OH)D production (38, 39). Thus, the stronger linear relationship we saw in whites may be due to other non-UVB sources of vitamin D, such as dietary supplements; prior studies have shown that blacks were less likely than whites to take supplements (18, 40). Furthermore, those who are exercising may also be more health conscious in general, and may be more likely to take vitamin supplements. We did find that vitamin D supplement use was higher among those with increased PA. In summary, PA and 25(OH)D may be associated through mechanisms other than UVB sun exposure.
Prospective interrelation between PA and 25(OH)D on ASCVD risk
Additionally, our study found evidence of an interaction between PA and 25(OH)D on ASCVD risk. Our findings show that the association between recommended PA levels and lower hazard of ASCVD events was statistically significant among those who had optimal or intermediate levels of 25(OH)D (≥20 ng/mL) but not among those with deficient levels of 25(OH)D. These results suggest that both PA and vitamin D are modifying factors in reducing incident ASCVD, and together they have synergistic joint effects on ASCVD risk. Our findings corroborate findings by Donneyong et al. (19) who found that the observed joint effects (HR, 0.61) of outdoor recreational activity and 25(OH)D levels were greater than the expected joint effects (HR, 0.71) on cardiovascular disease mortality. However, their study did not formally test for an interaction and was limited to mortality outcomes; we have evidence of a formal interaction with broad ASCVD outcomes, including myocardial infarction and stroke, in addition to cardiovascular death.
One mechanism by which PA and vitamin D may jointly prevent ASCVD is through inflammation reduction. Each bout of exercise promotes an anti-inflammatory environment, and the overall reduction in visceral fat decreases the release of proinflammatory adipokines (41). Likewise, vitamin D has been known to protect against inflammatory effects such as endothelial dysfunction and foam cell formation, which precede atherosclerosis (42). Thus, 25(OH)D may interact with PA to synergistically prevent inflammation.
25(OH)D may also have an effect on PA itself. 25(OH)D has been linked to muscle cell contractility, muscle strength, and postural stability (21). A study of participants >65 years old found that lower 25(OH)D levels were associated with decreased coordination, strength, and a weaker aerobic capacity (22). However, several trials regarding vitamin D supplementation and improved physical performance and activity have had mixed results (43, 44). Thus, further research regarding this association is needed.
Strengths and limitations
Our study has several strengths. The analysis was performed on a large, well-characterized, biracial cohort of men and women. We were able to analyze outcomes with a long-term follow-up of 19 years, and ASCVD events were adjudicated by an expert panel. We accounted for a number of potential confounders and mediators with models of varying adjustment.
Nonetheless, there are several limitations to our study. This was an observational study, limiting our ability to make a causal inference. We also did not have information on other key determinants of 25(OH)D levels such as sun exposure, whether the PA was indoors or outdoors, or sunscreen use. We also did not have data available about vitamin D supplement use at visit 2 (the visit when 25(OH)D levels were measured); however, data were collected about vitamin D supplements at visit 3. Vitamin D supplements can directly contribute to 25(OH)D levels in a causal manner. Another major limitation to our study is that data on PA and 25(OH)D levels were collected at different visits, with PA measured at visits 1 and 3, whereas 25(OH)D was measured at visit 2 (2.5 years after visit 1). Behaviors such as PA could have changed over the course of time between visits 1 and 2. To account for this, we performed an additional analysis considering a PA variable that was an average of PA from visits 1 and 3 and similar trends were found. Also, PA was self-reported, thus reporting bias may have occurred. The Baecke questionnaire (24), although validated, has known limitations. Finally, serum 25(OH)D was taken as a single measurement, whereas 25(OH)D levels can vary over time. We accounted for seasonality of 25(OH)D concentrations in the analysis.In conclusion, PA is linearly associated with higher 25(OH)D levels without a dose threshold, and this relationship is much stronger in whites than in blacks. In this observational study, a synergistic benefit was noted for combined higher PA and vitamin D levels for reduced ASCVD risk. Further interventional studies are needed to determine whether simultaneously targeting both improvements in PA levels and 25(OH)D levels can synergistically improve cardiovascular health.
Abbreviations:
- 25(OH)D
25-hydroxyvitamin D
- AHA
American Heart Association
- ARIC
Atherosclerosis Risk in Communities
- ASCVD
atherosclerotic cardiovascular disease
- BMI
body mass index
- CI
confidence interval
- HDL-C
high-density lipoprotein cholesterol
- HR
hazard ratio
- LDL-C
low-density lipoprotein cholesterol
- METS
metabolic equivalents of task
- METS*min/wk
metabolic equivalents of task times minutes per week
- NHANES
National Health and Nutrition Examination Survey
- PA
physical activity
- SBP
systolic blood pressure.
Acknowledgments
We thank the staff and participants of the ARIC study for their important contributions.
An abstract based on this work was presented at the American Heart Association Scientific Sessions, November 12-16, 2016, in New Orleans, Louisiana.
This research was supported by the following National Institutes of Health grants: from the National Institute of Neurological Disorders and Stroke Grant (R01NS072243 to E.D.M.), the National Heart, Lung, and Blood Institute (NHLBI; Grant R01HL103706 to P.L.L.), and the NIH Office of Dietary Supplements (Grant R01HL103706-S1 to P.L.L.). The Atherosclerosis Risk in Communities Study is carried out as a collaborative study supported by NHLBI contracts HHSN268201100005C, HHSN268201100006C, HHSN268201100007C, HHSN268201100008C, HHSN268201100009C, HHSN268201100010C, HHSN268201100011C, and HHSN268201100012C. E.D.M. is also supported by the Blumenthal Scholars Fund for Preventive Cardiology research.
Disclosure Summary: S.S.M. has received research support from the PJ Schafer Cardiovascular Research Fund, Aetna Foundation, American Heart Association, and Google; has consulted for Abbott Nutrition, Pressed Juicery, Quest Diagnostics, and the Pew Research Institute; and is co-inventor on a provisional patent filed by Johns Hopkins University for a novel method of estimating low-density lipoprotein cholesterol. E.D.M. received an honorarium from Siemens Healthcare Diagnostics. These disclosures are unrelated to the current study.
References
Author notes
Address all correspondence and requests for reprints to: Erin D. Michos, MD, MHS, FACC, FAHA, Division of Cardiology, Johns Hopkins School of Medicine, Blalock 524-B, 600 N. Wolfe Street, Baltimore, Maryland 21287. E-mail: edonnell@jhmi.edu.
