


Abstract
Hajdu-Cheney syndrome (HJCYS) is a rare, multisystem bone disease caused by heterozygous mutations in the NOTCH2 gene. Histomorphometric and bone ultrastructural analyses in children have not been reported and sparse evidence exists on response to bisphosphonate (BP) therapy.
To investigate clinical and bone histomorphometric characteristics, bone matrix mineralization, and the response of bone geometry and density to BP therapy.
Five children with HJCYS (three males) between 6.7 and 15.3 years of age.
Various BP regimens (pamidronate, zoledronic acid, and alendronate) were used for between 1 and 10 years.
Pretreatment transiliac bone biopsy specimens and peripheral quantitative computed tomography results were available in four and three subjects, respectively. Bone histomorphometry and quantitative backscattered electron imaging were performed in two patients. The response to BP was monitored using dual-energy X-ray absorptiometry and peripheral quantitative computed tomography.
Three patients had previously unreported NOTCH2 mutations. Histomorphometry demonstrated increased bone resorption and osteoclast numbers, increased heterogeneity of mineralization, and immature, woven bone. Trabecular bone formation was normal or elevated. Radius cortical thickness and density and lumbar spine bone mineral density were reduced at baseline and increased in response to BP therapy, which was not sustained after therapy discontinuation.
Increased bone resorption and low cortical thickness are consistent with the effect of activating NOTCH2 mutations, which stimulate osteoclastogenesis. The increase in lumbar spine bone density and radial cortical thickness and density by BP therapy provides evidence of beneficial treatment effects in children with HJCYS.
Hajdu-Cheney Syndrome (HJCYS) is a rare multisystem disorder with an autosomal dominant pattern of inheritance, characterized by acroosteolysis, osteoporosis, short stature, specific craniofacial features, neurologic symptoms, cardiovascular defects, and polycystic kidneys (1). The HJCYS phenotype was originally described by Hajdu in 1948 (2) and expanded by Cheney (3). Since then, various sporadic or familial cases have been reported. HJCYS is caused by mutations in exon 34 of the NOTCH2 gene, which encodes the Notch2 receptor, a regulator of skeletal development involved in osteoblast and osteoclast differentiation (4, 5). The Notch2 receptor belongs to a family of four (Notch 1 through 4) transmembrane receptors that plays a critical role in cell fate decisions. Notch1 and specifically Notch2 receptors are considered responsible for the skeletal effects (1, 6).
NOTCH2 mutations in HJCYS result in a receptor protein lacking a predicted C-terminal proline-glutamic acid-serine-threonine-rich domain, which normally reduces the half-life of the encoded protein. Absence of this domain is presumed to yield dominant gain-of-function effects through increased protein stability and signaling activity (4, 5, 7), although this has not yet been verified in functional studies of NOTCH2. The canonical NOTCH pathway is known to modulate cell fate and function in osteoblast and osteoclast lineages (1, 8). In murine models, the activation of Notch signaling stops the commitment of pluripotent precursors to the osteoblastic lineage and suppresses osteoblast differentiation (9). Notch2 mutant mice carrying an equivalent truncating mutation deleting the putative proline-glutamic acid-serine-threonine-rich domain exhibit low bone mass secondary to increased osteoclast numbers and high bone resorption, shown by the increase in the preosteoclast cell pool, the osteoclastogenic response to receptor activator of nuclear factor κB ligand (Rankl), and tissue Rankl concentrations (10).
Although osteoporosis is a known feature of human HJCYS, little is known regarding bone tissue characteristics. Early histological studies in adults were partly inconclusive (11–15). Several reports have documented histological features of high turnover osteoporosis, with increased resorptive surfaces and decreased endosteal bone surfaces compared with healthy controls (11–14). To date, histomorphometric and bone ultrastructural analyses in the developing skeleton of children with HJCYS have not been reported. In addition, although sparse evidence suggests increasing bone mineral density (BMD) during bisphosphonate (BP) therapy in adults (15–19) and two children (20, 21) with HJCYS, the differential response in bone geometry and density of the axial and appendicular skeleton has not been illustrated.
The aim of this study was to investigate clinical and histomorphometric characteristics, bone matrix mineralization, and the response of bone geometry and density to BP therapy in five children with HJCYS, three of whom had previously unreported NOTCH2 mutations.
Materials and Methods
Patients
Five children (two girls, three boys) with HJCYS presented to metabolic bone physicians in Birmingham, UK; Bethesda, MD; Southampton, UK; Rochester, MN; and Montreal, Canada. Clinical information and radiographic data from skeletal surveys were collected at diagnosis. Patients 1, 2, 3, and 5 underwent genetic testing of the NOTCH2 gene; patient 4 had a clinical diagnosis only. Sequencing was performed using standard methods, and data were analyzed using MutationSurveyor (Soft Genetics, Inc.). Transiliac bone biopsies were taken following informed consent. All patients were treated with various BP regimens with a starting age between 6.7 and 15.3 years, based on reduced BMD and/or vertebral and limb fractures. Informed consent for genetic studies and publication of clinical data were obtained from patients or their parents as appropriate.
Bone histomorphometry and quantitative backscattered electron imaging
Patients 3 and 5 had transiliac bone biopsies taken before the initiation of BP treatment and following double-labeling with tetracycline to allow for dynamic measurement of bone formation. Samples were sent to the Genetics Unit of the Shriners Hospital for Children in Montreal, Canada. Sample preparation and histomorphometric analyses were performed using standard procedures (22). Results were compared with reference data of healthy age-matched controls (22, 23). Subsequently, the residual blocks were prepared to assess bone mineralization density distribution (BMDD), reflecting the calcium content of cortical and trabecular bone matrix by quantitative backscattered electron imaging (qBEI) and compared with controls, as described previously (24–26), at the Ludwig Boltzmann Institute of Osteology in Vienna, Austria.
Patient 1 also had a pretreatment transiliac bone biopsy, and patient 4 had a posttreatment biopsy following 20 months of BP discontinuation. Although reports were available, the latter biopsy samples were either decalcified or not double-labeled and not available for detailed histomorphometric analysis. Patient 2 had posttreatment, nonhistomorphometric analysis of maxillary bone, as previously reported [subject HJCYS05 in Zhao et al. (27)].
Dual-energy X-ray absorptiometry
BMD of patient 1 was measured using a GE Lunar iDXA (GE Medical Systems, Madison, WI). Patients 2, 3, and 5 were scanned on a QDR Discovery Hologic (Hologic, Waltham, MA), and patient 4 had scans on both dual-energy X-ray absorptiometry (DXA) models. Lumbar spine scans were obtained; iDXA scans were analyzed using Encore, version 13.6 (basic and enhanced), and Hologic scans with Apex 4.1. Lumbar spine BMD results were adjusted for body size by calculating the bone mineral apparent density (BMAD, g/cm3) using the method of Carter et al. (28) for GE scanner output, and by using height-adjusted z scores (HAZ) for Hologic scanner output (29).
Peripheral quantitative computed tomography
Peripheral quantitative computed tomography (pQCT) was performed at the distal and proximal radius of the nondominant forearm (4% and 66% of radial length, respectively) using a Stratec XCT2000 scanner (Stratec Inc., Pforzheim, Germany) with voxel size of 0.4 mm, slice thickness 2.3 mm, and scan speed 25 mm/s. Positioning of the reference line, depending on the presence of a growth plate, was performed as previously described (30). Bone measurements were obtained 4% proximal to the reference line for total and trabecular volumetric BMD, and at the 66% site for cortical volumetric BMD, bone mineral content, muscle area, and cortical thickness. Cortical thickness was calculated using the manufacturer’s software. Image acquisition, processing, and the calculation of numerical values were performed using the manufacturer's software package (XCT 6.0). The z scores were calculated using reference data for the distal (30) and proximal (31, 32) radii. Patients 1, 3, and 5 had pQCT scans before commencing BP treatment. Repeat pQCT scans were performed in patient 1, 4 years after starting BP, and in patient 3, 1 and 4.5 years after starting BP.
Results
Patient clinical characteristics
All patients were born to healthy, nonconsanguineous parents. Patients 1, 3, and 5 were found to have previously unreported heterozygous protein-truncating NOTCH2 gene mutations (reference sequence NM_024408.3): c.6902T>A (p.Leu2301*), c.6787C>T (p.Gln2263*), and c.6724_6725delAG (p.Ser2242*), respectively (mutations submitted to ClinVar). Patient 2’s mutation was previously reported (27). In addition to displaying common features of HJCYS, our patients showed some rarely described (33) phenotypic features, such as intestinal malrotation, delayed puberty (patient 1 had late menarche at age 19 years with normal estradiol and stimulated gonadotropin test results) and hip acetabular dysplasia with loss of normal femoral epiphysis. Their median height z score was −1.4 (range, −3.5 to −0.4). Patient 1 was wheelchair dependent, but patients 2 through 5 had normal mobility. Supplemental Table 1 summarizes the genetic and phenotypic characteristics of all five patients; Supplemental Table 2 summarizes their radiological findings.
Treatment with BP
Patient 1 has been receiving intravenous zoledronate 0.05 mg/kg/dose every six months from the age of 15 years. Patient 2 received intravenous pamidronate 1 mg/kg/dose every three months from age 6.8 years for 1 year and then was switched to 35 mg oral alendronate weekly for 3 years, which was increased to 70 mg weekly for 2.5 years. Following a 5-year interval without any BP treatment, he had one infusion of 5 mg zoledronate at the age of 17.5 years. Patient 3 received three doses of zoledronate 0.05 mg/kg/dose every six months at the age of 15.5 years and then refused to have more infusions. Patient 4 started therapy at the age of 10 years with 5 mg oral daily alendronate, followed by 35 mg/weekly from age 13 years, and 70 mg weekly from age 15 years, which was discontinued at age 20. Following a 2-year interval without treatment, he received 2 more years of 70 mg alendronate weekly. He then stopped BP therapy at age 24 years because of declining glomerular filtration rate caused by polycystic kidney disease requiring renal transplantation at age 25 years. Patient 5 (age 10 years) has just started therapy with intravenous pamidronate 1.5 mg/kg/d every four months for 2 days.
Bone histomorphometry
Table 1 shows the results of histomorphometric parameters from pre-BP treatment transiliac bone samples of patients 3 (male) and 5 (female). Histological images are depicted for both patients and a control in Fig. 1a–1c. The cortex was the most abnormal structural bone parameter in biopsy samples of patients 3 and 5. Cortical width was 55% of the mean for age in patient 5. The cortices in patient 3 appeared highly porous or trabecularized with no clear distinction between the cancellous and cortical compartment, to the extent that cortical width was not measurable (Fig. 1a). Trabecular number and cancellous bone volume was elevated in patient 3 only, but was average for age in patient 5. There was no hyperosteocytosis. Patient 5’s trabecular compartment contained a few areas with woven bone nodules (Fig. 1d), but the large majority of trabeculae consisted of lamellar bone.
Histomorphometric Results of Transiliac Bone Samples (Pretreatment)
| Parameter | Patient 3 (15 y) | Controls (14-16.9 y) Mean (SD) | Patient 5 (10 y) | Controls (7–10.9 y) Mean (SD) |
|---|---|---|---|---|
| Structural parameters | ||||
| Cortical width, μm | Not measurable | 1178 ± 349 | 531 | 974 ± 367 |
| Bone volume/tissue volume, % | 37.0 | 25.7 ± 5.3 | 22.6 | 22.4 ± 4.2 |
| Trabecular thickness, μm | 163 | 157 ± 22 | 112 | 129 ± 17 |
| Trabecular number, per mm | 2.3 | 1.6 ± 0.2 | 2 | 1.7 ± 0.2 |
| Static parameters of bone formation | ||||
| Osteoid volume/bone volume, % | 3.6 | 2.2 ± 0.9 | 3.4 | 2.6 ± 1.0 |
| Osteoid thickness, μm | 7.0 | 6.3 ± 1.0 | 8.4 | 5.9 ± 1.1 |
| Osteoid surface/bone surface, % | 43 | 26 ± 8 | 23 | 29 ± 13 |
| Osteoblast surface/bone surface, % | 25.3 | 7.9 ± 4.1 | 14.0 | 8.2 ± 4.4 |
| Dynamic parameters of bone formation | ||||
| Mineralizing surface/bone surface, % | 30.9 | 12.5 ± 3.4 | 9.8 | 14.9 ± 4.5 |
| Mineralizing apposition rate, μm/d | 0.97 | 0.81 ± 0.09 | 1.05 | 0.95 ± 0.07 |
| Adjusted apposition rate, µm/d | 0.70 | 0.42 ± 0.11 | 0.44 | 0.47 ± 0.18 |
| Bone formation rate/bone surface, μm/y | 109 | 37 ± 10 | 38 | 52 ± 16 |
| Bone formation rate/bone volume, %/y | 133 | 48 ± 19 | 67 | 78 ± 27 |
| Mineralization lag time, d | 9.9 | 15.3 ± 3.6 | 18.9 | 14.1 ± 4.3 |
| Static parameters of bone resorption | ||||
| Eroded surface/bone surface, % | 33 | 18 ± 6 | 30 | 17 ± 6 |
| Osteoclast surface/bone surface, % | 1.4 | 1.1 ± 0.7 | 1.7 | 1.3 ± 0.6 |
| Number of osteoclasts/bone perimeter, per mm | 0.6 | 0.3 ± 0.2 | 0.7 | 0.4 ± 0.2 |
Boldface indicates abnormal values.
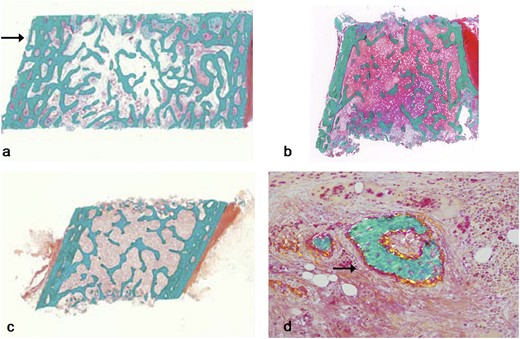
Histological images (Goldner Trichome staining) from transiliac bone biopsies naïve to BP therapy. (a) Patient 3 (male, age 15 years): note increased trabecular density compared with control and trabecularization of the cortex (arrow). (b) Patient 5 (female, 10 years of age): note the relatively thin cortex and normal trabecular bone. (c) Healthy control sample (female, age 9.4 years). (d) Patient 5: note the presence of woven bone (arrow), which is atypical in this location.
Static parameters of bone formation showed that osteoblast surface/bone surface was 320% and 170% of the mean for age in patients 3 and 5, respectively. Osteoid thickness was above the reference range for age in patient 5, but normal in patient 3. Dynamic parameters of bone formation showed inconsistent findings: patient 3’s sample had a clearly elevated mineralization surface/bone surface and bone formation rate, whereas these parameters were within the normal range in patient 5’s sample. There was no mineralization defect in either of these patients.
Consistent in both samples was evidence for high bone resorption activity. Eroded surface was 183% and 176% of the mean for age in patients 3 and 5, respectively, and the number of osteoclasts was 200% and 175%, respectively.
Patient 1’s pretreatment and patient 4’s 20-month posttreatment bone biopsies were reported to show high bone resorption, but biopsies were not available for systematic histomorphometric analysis.
BMDD
Quantitative backscattered images from patient 3 revealed highly trabecularized cortices (Fig. 2a) that was not observed in patient 5 (Fig. 2b;Table 2).
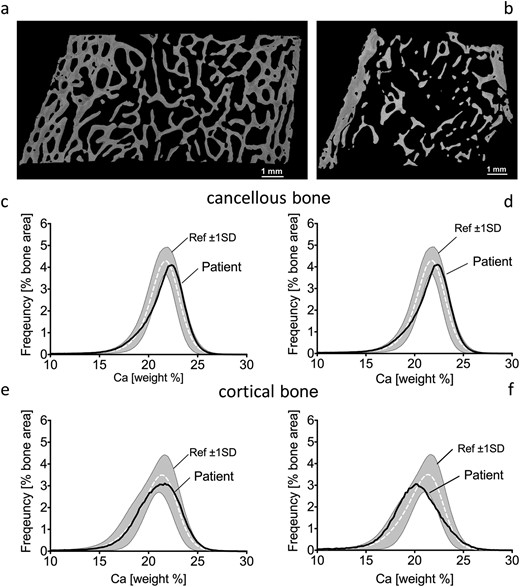
Quantitative backscattered images depicting cortical dimensions and trabecular network (a, b) and BMDD histograms of cancellous (c, d) and cortical (e, f) bone from transiliac biopsy samples of patients 3 (left) and 5 (right). BMDD results of cancellous and cortical bone are compared with reference BMDD from healthy children (gray band) (26). The corresponding parameters are given in Table 2. Ca, calcium; ref, reference; SD, standard deviation.
qBEI Results Showing BMDD of Cancellous and Cortical Bone From Transiliac Bone Biopsy Samples of Patients 3 (15 y) and 5 (10 y)
| Cancellous Bone | Cortical Bone | |||||
|---|---|---|---|---|---|---|
| BMDD Variables | Patient 3 | Patient 5 | Ref. Values: Controls (26) | Patient 3 | Patient 5 | Ref. Values: Controls (26) |
| CaMean, wt%Ca | 20.89 | 21.29 | 20.95 (0.57) | 20.36 | 19.73 | 20.45 [19.68; 21.04] |
| CaPeak, wt%Ca | 22.18 | 22.36 | 21.66 (0.52) | 21.23 | 20.02 | 21.14 [20.62; 21.75] |
| CaWidth, Δwt%Ca | 3.64 | 4.51 | 3.47 [3.12; 3.64] | 5.03 | 4.68 | 3.81 [3.38; 4.38] |
| CaLow, % | 8.49 | 7.65 | 6.14 [4.90; 7.99] | 11.50 | 16.82 | 9.06 [6.22; 15.00] |
| CaHigh, % | 1.30 | 3.55 | 0.89 [0.43; 1.47] | 1.34 | 1.65 | 0.46 [0.28; 1.22] |
Reference data are mean (±1 SD) or median with interquartile range [25%; 75%]. Boldface indicates abnormal values.
Abbreviations: CaMean, the weighted mean calcium concentration of the bone area; CaWidth, the full width at half maximum of the distribution, describing the variation in mineralization density (25).
Trabecular bone
Cancellous bone from patients 3 and 5 showed a slight tendency toward higher matrix mineralization as mirrored by the peak position of the histogram that indicates the most frequently occurring calcium concentration (CaPeak) of the BMDD (Fig. 2c–2d). CaWidth was elevated, demonstrating greater heterogeneity in mineralization, with increased percentage of poorly mineralized bone (CaLow) in both patients, and increased percentage of highly mineralized bone (CaHigh) in patient 5 (Table 2), compared with reference populations (26).
Cortical bone
The CaPeak position of patient 3 was in the normal range, but slightly shifted toward lower bone matrix mineralization in patient 5 compared with controls (Fig. 2e–2f). CaWidth was again elevated, demonstrating greater heterogeneity in mineralization, with increased percentage of CaHigh in both samples, and a greater percentage of CaLow in patient 5 compared with the reference population (26) (Table 2).
Lumbar spine bone density before and during BP treatment
Age-, sex-, and size-adjusted lumbar spine bone density z scores (BMAD, HAZ) were below average before treatment in all patients, ranging from −0.5 to −3.4 (median, −1.3). These z scores increased during BP treatment, with a median ΔZ-score of +0.7 (0.1 to 1) after 1 year of treatment and a peak change of +1.5 (0.1 to 3.3) during treatment. However, after discontinuation of treatment, HAZ dropped again from 0.3 to −2.5 in patient 2, and from −0.7 to −1.1 in patient 3 (Fig. 3). BP treatment was not restarted in patient 2 because of multiple dental procedures. Patient 4 had the greatest initial increase in rise in BMD, which was not sustained on oral alendronate. His BMD dropped after each BP treatment discontinuation, but his clinical course was also complicated by progressive renal failure.
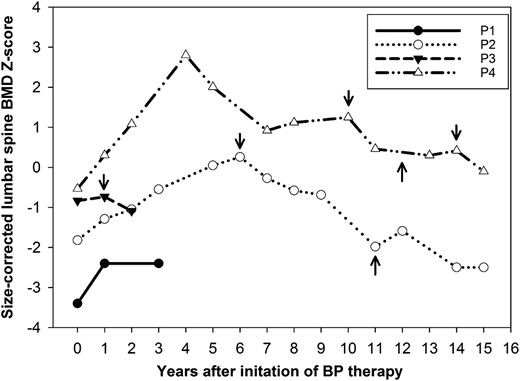
Age-, sex-, and size-adjusted lumbar spine BMD z scores in response to BP therapy in patients 1–4. BMAD z scores are used for patients measured on Lunar scanners and HAZ for patients on Hologic scanners. Arrows pointing downward indicate treatment discontinuation; arrows pointing upward indicate treatment restart. For details on dose and choice of BP therapy, refer to the text. P, patient.
pQCT results before and during BP treatment
Table 3 demonstrates pQCT data at baseline (patients 1, 3, and 5), during zoledronate therapy (patients 1 and 3), and following its discontinuation (patient 3). The common characteristic baseline feature of all three patients is the very low cortical density z score (−4.3, −4.9, and −3.7, respectively) as well as low cortical thickness (−2.3, −1.1, and −2.3, respectively). During zoledronate therapy, cortical density increased in both patients (patient 1: 984 to 1022 mg/cm3; patient 3: 885 to 1029 mg/cm3), although patient 1’s value did not increase relative to reference data (z score pretreatment: −4.3; after 4 years of treatment: −4.9). Patient 3’s cortical density continued to improve even after the discontinuation of zoledronate (z score, −2.5). Cortical thickness z score increased significantly with treatment in patients 1 and 3 and decreased again in patient 3 following treatment discontinuation. In contrast to the low cortical bone thickness and density at the proximal radius, trabecular and total bone densities at the distal radius were relatively normal. Surprisingly, total and trabecular density z scores decreased during BP therapy in patient 1 but increased in patient 3 and dropped to very low levels after treatment discontinuation.
Radius pQCT Results Before, During, and After Treatment With Zoledronic Acid
| z Scores of pQCT Parameter (Site) | Patient 1 | Patient 3 | Patient 5 | |||
|---|---|---|---|---|---|---|
| Pretreatment (15 y) | After 4 y of Zoledronate | Pretreatment (15 y) | After 1 y of Zoledronate | 3.5 y After End of Therapy | Pretreatment (10 y) | |
| Total density (4%) | −0.4 | −2.9 | −1.9 | 0.0 | −3.9 | 0.8 |
| Trabecular density (4%) | 1.5 | −1.6 | −0.6 | 3.0 | −3.1 | −0.9 |
| Cortical density (66%) | −4.3 | −4.9 | −4.9 | −3.1 | −2.5 | −3.7 |
| Cortical thickness (66%) | −2.3 | −1.0 | −1.1 | 2.3 | −0.1 | −2.3 |
| BMC (66%) | −1.7 | 0.0 | −0.9 | −0.5 | −1.4 | −0.3 |
| Muscle area (66%) | 3.7 | −1.6 | −1.1 | −1.4 | −1.1 | −1.4 |
Abbreviation: BMC, bone mineral content.
Fractures and progress of acroosteolysis
At start of BP therapy, patients 1, 3, and 5 had multiple vertebral fractures and patients 1 and 2 had long bone fractures (patient 1: tibia/fibula; patient 2: radius/ulna), whereas patient 4 had no fractures. During therapy, patient 4 developed vertebral and metatarsal fractures and patient 3 sustained a tibia fracture, whereas patients 1 and 2 sustained no new fractures. Patient 2 developed fractures of the fingers and metatarsals after treatment cessation. Mild undertubulation of the metaphyses were observed in patient 2 during treatment, and, because treatment did not appear to slow the progression of acroosteolysis, BP therapy was paused. The fourth fingers were spared bilaterally. Since reaching skeletal maturity, acroosteolysis has remained stable (patient is currently age 21 years). In contrast, patient 4 showed slower progression of acroosteolysis during BP treatment compared with before treatment. No details are available on the progression of acroosteolysis in patients 1, 3, or 5.
Discussion
The results of this study indicate a unique bone tissue phenotype of patients with HJCYS, characterized by increased bone resorption, with or without increased trabecular bone formation, a greater than normal heterogeneity in mineralization, and immature, woven bone. Structurally, activating NOTCH2 mutations appear to affect appendicular cortical bone more than trabecular bone. The markedly reduced cortical thickness and density and lumbar spine BMD increased substantially in response to BP therapy, indicating that affected individuals benefit from antiresorptive therapy. This report also adds three previously unreported NOTCH2 mutations to the literature.
Limited bone histological analyses from affected adults have highlighted HJCYS as a form of high turnover osteoporosis, but the older literature is inconclusive (11–14, 27). Increased bone resorption certainly was a hallmark finding in tissue samples of our patients. Elevated resorption markers were previously reported in HJCYS subjects (14). Bone formation appeared less affected than resorption in histomorphometric analysis. In fact, although patient 5 had normal static and dynamic parameters of bone formation, patient 3 had elevated amounts of trabecular bone with increased bone formation. Decreased trabecular bone volume was previously only described in very young HJCYS mouse mutants who showed no defect in osteoblast differentiation or their bone-forming capacity in vitro from age 3 months (10). Hence, the predominantly cortical rather than trabecular bone defect we observed may be a result of compartment-specific differential regulation by Notch signaling (10), with increased endocortical bone resorption leading to thinning and trabecularization of the cortices. Alternatively, the normal or increased trabecular numbers could potentially be a biomechanical compensation for reduced cortical bone or the result of variable expressivity of modifier genes.
Apart from excessive bone resorption, the other common feature was the more heterogeneous matrix mineralization, caused by variably increased proportions of CaLow and/or CaHigh in both cortical and trabecular bone. Despite normal or increased bone formation, matrix mineralization in cancellous bone was slightly right-shifted (toward higher mineral content of the bone matrix) rather than left-shifted, as one would expect with high bone turnover (25). Possibly, the increased matrix mineralization heterogeneity might be due to the presence of densely mineralized woven bone within normal bone tissue (34, 35). Indeed, patient 5 was found to have immature woven bone, a finding previously described in a maxillary bone specimen from patient 2 when he was 14 years old (27). The presence of woven bone likely represents a typical feature of NOTCH2-mutated bone because it is also present in Notch2-mutated mice and is associated with increased proliferation of immature osteoblasts (36).
The most striking finding on bone imaging was the uniformly low cortical thickness and density in all patients undergoing pQCT scanning (n = 3), which is consistent with the trabecularization of the cortex seen on biopsy. Low cortical thickness and high cortical porosity are also features of the Notch2-mutated mouse (10). This finding fits the histologically evident excessive resorption rather than a formation defect, a hypothesis supported by observation of increasing cortical thickness during BP therapy in this study.
The increased osteoclast number and bone resorption in mice with activating HJCYSNotch2 mutations is in accordance with our histomorphometric findings. However, patient 3 had increased trabecular bone and trabecularization of the cortex, as reported in the appendicular skeleton of mouse models with osteoblast-specific Notch2 inactivation (37, 38). This counterintuitive result gives rise to speculation of variable gene expressivity and postreceptor interactions in osteoblasts and osteoclasts. In addition, age and sex may also play a role, as demonstrated in mouse models (37, 39). Of note, Notch pathway activation in osteocytes leads to induction of Opg expression and Wnt/β-catenin signaling, with a consequent suppression of bone resorption in cancellous bone and enhancement of bone formation in cortical bone (7).
The natural evolution of HJCYS leads to substantial osteoporosis with vertebral compression fractures and continuous deterioration of acroosteolysis (11, 19, 40, 41). A previous report following two patients with HJCYS for 17 years without any treatment showed a dramatic decrease in height and chronic back pain because of the progression of vertebral fractures, alongside a decrease in BMD. The progression of acroosteolysis continued during follow-up (11). The mechanism of disease for acroosteolysis in HJCYS is poorly understood. Samples containing acroosteolysis showed increased osteoclastic bone resorption and reduced bone formation (14), whereas others had high numbers of mast cells and neovascularization with absent osteoclasts (12, 42). Acroosteolysis seemed to progress in patient 2 despite BP therapy; he plateaued postpuberty but patient 4 showed slower progression, reinforcing the suggestion of a disease mechanism other than osteoclastic bone resorption (21).
There are no controlled trials on the management of osteoporosis in HJCYS, apart from anecdotal cases treated with BPs, teriparatide, or denosumab (15–20). Taking into consideration that elevated bone resorption is the main feature in the pathogenesis of osteoporosis in HJCYS, BPs are the logical therapeutic option in these patients because BPs lead to osteoclast apoptosis (43). Accordingly, BPs have become the primary therapy for managing skeletal conditions characterized by increased osteoclast-mediated bone resorption. Here, we show the improvement in height-adjusted lumbar spine BMD z scores and cortical thickness in treated patients. However, relatively fast reversibility of benefit was observed soon after treatment discontinuation, as demonstrated in patients 2 (by DXA), 3 (by DXA and pQCT), and 4 (by DXA and post-BP biopsy). This reversibility appears more pronounced compared with data from children with osteogenesis imperfecta (44). The BMD increase during BP treatment is in accordance with most cases of BP therapy in adults (16, 17), apart from one case in which glucocorticoids were coadministered (15). In children with HJCYS, there are only two case reports of intravenous BP therapy, which showed substantial improvement in lumbar spine BMD, a 9% gain over 1 year in a 13-year-old boy (21) and 67% gain over 2 years in a 9-year-old girl (20). Bone resorption markers also decrease during BP therapy (15, 16). Overall, the results of this study and the existing literature support the use of intravenous BP therapy in patients with HJCYS. Given the association of HJCYS with renal disease (1) and the nephrotoxicity of zoledronate, renal function should be monitored during BP therapy. Antiresorptive therapy with denosumab may also be beneficial (18).
Although it is reasonable to assume that fracture risk decreases during BP therapy, such evidence will be difficult to collect in such an ultrarare disease. Treatment guidelines on type and duration of antiresorptive therapy will need to be established, including systematic observation of acroosteolysis, in a rare bone disease registry. HJCYS clearly is a multisystem disorder, demonstrating that NOTCH2 activation affects development and function of several organs.
In conclusion, this study demonstrates increased bone resorption, increased heterogeneity of bone matrix mineralization, woven bone, and reduced cortical thickness as typical bone characteristics of HJCYS. These features are consistent with the effect of presumptive activating NOTCH2 mutations on osteoclastogenesis and cortical bone described in mouse models. Here, we demonstrate that intravenous BP therapy increased size-corrected lumbar spine BMD and radial cortical thickness and density, which provides further evidence of beneficial treatment effects in children with HJCYS. Because treatment effects were not sustained after BP discontinuation, further studies are needed to inform guidance on treatment dose and duration. Whether acroosteolysis can be improved with BP therapy remains to be elucidated. From a clinical management perspective, the bone phenotype of our patients at baseline suggests, similar to other pediatric conditions with high bone resorption, that early diagnosis, including assessment for vertebral fractures, is essential so that therapy can be started earlier in life.
Abbreviations
- BMD
bone mineral density
- BMDD
bone mineralization density distribution
- BP
bisphosphonate
- CaHigh
highly mineralized bone
- CaLow
poorly mineralized bone
- CaPeak
peak position of bone mineral density
- DXA
dual-energy X-ray absorptiometry
- HAZ
height-adjusted z score
- HJCYS
Hajdu-Cheney syndrome
- pQCT
peripheral quantitative computed tomography
- qBEI
quantitative backscattered electron imaging.
Acknowledgments
We thank Nicola Crabtree for assistance in interpreting peripheral quantitative computed tomography and dual energy X-ray scans, and Daniela Gabriel, Petra Keplinger, Sonja Lueger, and Phaedra Messmer for careful sample preparations and quantitative backscattered electron imaging measurements at the bone laboratory of the Ludwig Boltzmann Institute of Osteology in Vienna.
Financial Support: This study was supported in part by the Intramural Research Program of the National Institutes of Health, National Institutes of Dental and Craniofacial Research, the Austrian Workers’ Compensation Board), Vienna Regional Health Insurance Fund, and the Shriners of North America. M.S. was supported by Genome Canada, Genome Quebec, and the Centre de Recherche du CHU Ste-Justine.
Disclosure Summary: The authors have nothing to disclose.
References
