


Abstract
XOMA 358 (X358) is a fully human monoclonal antibody to the insulin receptor that acts as a negative allosteric modulator of insulin signaling. It is being developed as a novel treatment of hyperinsulinemic hypoglycemia. This report describes pharmacokinetic (PK) and pharmacodynamic (PD) data from a first-in-human clinical trial.
A double-blind, placebo-controlled, single-ascending-dose study was performed with 29 healthy adult males randomized to intravenous infusion of placebo or X358 at 0.1-, 0.3-, 1-, 3-, 6-, or 9-mg/kg dose levels. The primary objective was to assess safety and tolerability, and secondary objectives included PK and PD analyses. A short insulin tolerance test (ITT) was implemented in the 3- to 9-mg/kg dose cohorts at baseline and postinfusion.
There were no deaths, serious adverse events (AEs), or subject discontinuations due to AEs. There were no clinically meaningful safety findings. X358 exhibited dose-proportional PK with a half-life of 21 days. Dose-dependent elevations of circulating insulin levels, likely related to reduced insulin clearance via monoclonal antibody action at receptors, represented a sensitive biomarker of X358 exposure. X358-dependent increases in postprandial glucose levels and fasting homeostatic model assessment of insulin resistance values were observed and persisted for at least 1 week at the higher dose levels. In all the ITT cohorts, the slope for glucose lowering was substantially attenuated after X358 infusion of a similar magnitude, but with increasing duration with rising dose level.
Single X358 infusions were well tolerated and resulted in a dose-dependent reduction in insulin sensitivity. Clinical development of X358 in hyperinsulinemic, hypoglycemic conditions is proceeding.
The treatment and prevention of hyperinsulinemic hypoglycemia (HH) remains a serious unmet medical need. Hypoglycemia due to elevated or dysregulated circulating insulin levels spans all age groups. It may be transitional or persistent in neonates, infants, and children, or in adults with postgastric surgery or it may occur following insulin and insulin secretagogue administration in types 1 and 2 diabetes patients of all ages (see refs. 1–10 for recent reviews and guidance). Despite progress on pharmacological treatment options, drug approvals and validated new approaches are limited, particularly for persistent HH in congenital hyperinsulinism (CHI) and post-gastric-bypass patients (3, 4, 6, 8, 11–14).
The observation about 30 years ago of autoantibodies to the human insulin receptor (InsR) that imparted insulin resistance (15, 16) has supported a novel pharmacological approach utilizing monoclonal antibodies (mAbs) to attenuate insulin-mediated hypoglycemia (17, 18). A clinical development candidate, XOMA 358 (X358, also known as XMetD), has been identified that is a fully human immunoglobulin G2 mAb that acts in an allosteric manner to bind to InsRs and to attenuate the action of insulin on target cells (17). The pharmacology of X358 has been studied in both in vitro and in animal model systems with demonstrated efficacy in ameliorating postprandial and fasting hypoglycemia in hyperinsulinemic conditions (17). The following report describes the first clinical evaluation of X358 in phase 1, single-administration, double-blind, placebo-controlled, ascending-dose studies in healthy adults.
Materials and Methods
Study design
This was a two-part randomized, double-blind, placebo-controlled, single-ascending-dose study. The primary objective was to assess the safety and tolerability of single intravenous (IV) doses of X358 when administered to healthy adult subjects. The first part included X358 dose levels from 0.1 to 3 mg/kg and was restricted to males. The second part included 6- and 9-mg/kg dose levels and was open to male and female enrollment. Secondary objectives included assessment of pharmacokinetics (PKs) and pharmacodynamic (PD) including changes in glucose, insulin, and C-peptide. Limited whole-blood ketone (β-hydroxybutyrate) and serum glucagon analyses were performed. Each dosing cohort included either one to two placebo-infused or three to five X358-treated subjects (Table 1). A short insulin tolerance test (ITT) procedure was implemented for the 3-, 6-, and 9-mg/kg dose cohorts to evaluate insulin sensitivity.
Summary of Subject Demographics and Treatment Disposition
| Trait | Treatment Cohort | |||||||
|---|---|---|---|---|---|---|---|---|
| 0.1 mg/kg (N = 4) | 0.3 mg/kg (N = 3) | 1 mg/kg (N = 3) | 3 mg/kg (N = 4) | 6 mg/kg (N = 5) | 9 mg/kg (N = 3) | Placebo (N = 7) | Overall (N = 29) | |
| Sex | ||||||||
| Male | 100% | 100% | 100% | 100% | 100% | 100% | 100% | 100% |
| Ethnicity | ||||||||
| Hispanic | 25% | 67% | 67% | 25% | 0 | 66.7% | 71.4% | 44.8% |
| Not Hispanic | 75% | 33% | 33% | 75% | 100% | 33.3% | 28.6% | 55.2% |
| Race | ||||||||
| Black | 50% | 0% | 33% | 0% | 100% | 66.7% | 28.6% | 37.9% |
| White | 50% | 100% | 67% | 100% | 0% | 33.3% | 71.4% | 62.1% |
| Age,a y | ||||||||
| Mean | 28.8 | 37.0 | 36.3 | 28.8 | 30.0 | 25.0 | 30.3 | 30.6 |
| Range | 27 to 31 | 30 to 43 | 27 to 45 | 18 to 38 | 26 to 40 | 23 to 29 | 21 to 39 | 18 to 45 |
| Weight,b kg | ||||||||
| Mean | 80.0 | 74.9 | 77.3 | 69.7 | 70.3 | 71.6 | 75.0 | 74.0 |
| Range | 73.8 to 83.3 | 64.0 to 87.2 | 73.6 to 80.0 | 58.7 to 82.9 | 62.6 to 81.9 | 65.1 to 75.3 to | 59.1 to 82.9 | 58.7 to 87.2 |
| BMI, kg/m2 | ||||||||
| Mean | 25.8 | 26.2 | 25.4 | 24.0 | 23.3 | 22.5 | 24.4 | 24.4 |
| Range | 24.0 to 27.4 | 23.2 to 28.3 | 21.1 to 28.6 | 22.3 to 28.0 | 18.8 to 28.0 | 19.9 to 25.7 | 20.5 to 28.7 | 18.8 to 28.7 |
Age at time of consent.
Weight at time of screening.
For each cohort, subjects underwent screening procedures within 14 days prior to check-in. Subjects were admitted to the clinical research unit on day –2 for the non-ITT cohorts, or on day –3 for the ITT cohorts. Subjects remained in the clinical research unit through completion of all scheduled postdose procedures on day 8. Subjects returned for a follow-up visit at 9, 14, 17 (±1 day), 21, 28, 35, and 42 days. Standard phase 1 breakfast, lunch, and dinner meals totaling ∼2500 calories per day were administered. PD procedures included short ITTs as described later. Safety was determined at frequent intervals by evaluating physical examinations, vital signs, electrocardiograms (ECGs), clinical laboratory parameters, glucose monitoring, infusion site reaction, and adverse events (AEs).
Inclusion and exclusion criteria
Eligibility criteria were typical of phase 1 clinical trial protocols with inclusion of nonsmoking healthy subjects 18 to 45 years of age with body mass index (BMI) ≥18.0 and ≤29.0 kg/m2 and weight ≥40 kg and ≤90 kg at screening. Subjects were without clinically significant medical histories, vital signs, ECGs, chest X-rays, and physical examinations, as deemed by the investigator. Clinical laboratory tests, at screening, included HbA1c ≤5.6%, fasting plasma glucose <100 mg/dL (on 2 separate days), and liver and kidney function tests within the normal reference range. Candidates were excluded if they had a first-degree relative with type 2 diabetes mellitus; positive results for urine drug, alcohol, or nicotine; positive tests for HIV, hepatitis C virus, or HBsAg; major surgery or other drug trial participation in the past 90 days; supine blood pressure greater than 140/90 mm Hg; heart rate lower than 40 bpm or higher than 99 bpm; and abnormal ECG.
Insulin sensitivity test
A short (∼17-minute) ITT procedure in the higher dose test cohorts was performed on day –1 (baseline) and days 2, 3, and 5 for the 3-mg/kg X358 cohort and with later days (days 11, 22, and 29) included for the 6- and 9-mg/kg dose cohorts. The ITT procedure (19) followed a 12-hour overnight fast followed by a bolus IV injection of 0.1 U/kg insulin (Humulin R®). Blood samples for glucose and insulin determinations were taken approximately 5 minutes prior to the insulin dose and approximately 3, 6, 9, 12, and 15 minutes after insulin dose. Within a few minutes of the last sampling, subjects received an IV dose of approximately 15 g of glucose to terminate the ITT. Morning “fasting” PD markers were always 8 to 12 hours following a nighttime meal or snack and postprandial PD markers included 2-hour postdinner sampling on baseline and postinfusion days.
Ethics and reporting
This protocol was reviewed by an institutional review board constituted and operated in accordance with the US Code of Federal Regulations [(CFR) 21 CFR Part 56] and was International Conference on Harmonization compliant. The study was carried out in accordance with the protocol, US Code of Federal Regulations, Good Clinical Practice, 21 CFR Parts 50, 56, and 312, the ethical principles set forth in the Declaration of Helsinki, and the International Conference on Harmonization harmonized tripartite guideline regarding Good Clinical Practice (E6 Consolidated Guidance, April 1996). Informed consent included a description of the purpose of the study, the procedures to be carried out and the potential hazards to the subjects. Subjects read, signed, and dated an informed consent form summarizing the discussion at screening, and were assured that they may withdraw from the study at any time without jeopardizing their medical care. Subjects retained a copy of their informed consent form. The study design and contact information were not posted on any website including ClinicalTrials.gov.
Results
Study population
A total of 29 subjects, ultimately all males, entered the study and were randomized to study treatment. A summary of subject demographics and disposition is depicted in Table 1. In summary, the mean age was 30 years, with a mean weight of 74 kg and BMI of 24 kg/m2. The subjects were 45% Hispanic and 38% African American.
Safety
There were no deaths, serious AEs, or subject discontinuations due to AEs in this study. There were no clinically significant safety results in laboratory, ECG, or physical examinations during the study. There was no evidence of trends in treatment-emergent AEs in the X358 vs placebo treatment groups. The most common events reported during the study were headache and hyperhidrosis (10%)—equivalent in placebo and 358 treatment groups—and muscle spasms in only the 3-mg/kg dose cohort. All AEs resolved by the end of the study.
PKs
X358 was infused intravenously over 30 minutes and serial blood samples for serum collection and bioanalysis was performed for at least 28 days. The serum drug concentration vs time profile in at each dose level exhibited curvilinear decay and is depicted in Fig. 1. Analysis for PK parameters (Supplemental Table 1) revealed characteristics typical of many human mAbs including low variability, dose-proportionality, and relatively low clearance and volume of distribution. A consistent elimination half-life across all dose cohorts and averaged 21 days. There were no notable trends in PK parameters observed in this population based on age, weight, or BMI.
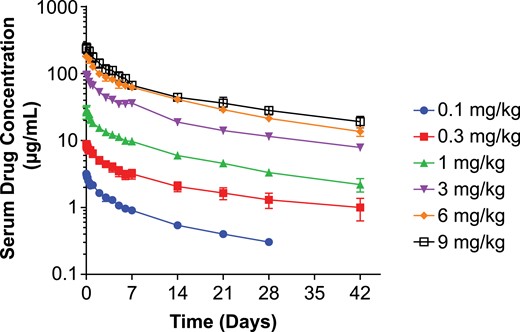
Serum X358 concentration vs time following IV administration of X358 (mean ± SEM). Depicted is the plot of log mean (±SEM) serum drug levels (μg/mL) vs linear time (days) following IV infusion for each dose cohort according to the legend. SEM, standard error of the mean.
PD
The primary PD endpoints monitored were fasting glucose and insulin levels. Analyses of C-peptide and limited ketone and glucagon levels were additionally performed. The 2-hour after dinner change in glucose and insulin levels was informative as a postprandial measure across the study period. The ITTs represented a stringent PD test of subject sensitivity to insulin-induced glucose disposal.
Morning fasting glucose, insulin, and C-peptide levels were monitored throughout the study week. Detailed data are depicted for baseline (day –1) and days 1 to 3 and 6 (days 4 and 5 differed minimally from days 3 or 6 across all biomarkers). Morning fasting glucose levels are shown in Table 2 at the same time each morning, equivalent to ∼1 hour after infusion on day 1 (and non-ITT days), or equivalent to the time point right before insulin infusion on ITT days. On day 1, shortly after X358 infusion, glucose levels were transiently increased in a roughly dose-related manner and significantly so in the 3-, 6-, and 9-mg/kg dose cohorts. Thereafter, morning fasting glucose levels were largely unchanged from baseline or placebo at dose levels below 3 mg/kg. Following the Day 1 trend for elevated glucose levels at 3, 6, and 9 mg/kg, the morning fasting Day 2 glucose values were actually transiently lowered midweek in these dose groups and then returned to levels at or above baseline for the remainder of the week.
Fasting Glucose Levels (Mean ± SEM)
| Group | Day –1 | Day 1 | Day 2 | Day 3 | Day 6 |
|---|---|---|---|---|---|
| Placebo (N = 7) | 92.5 (1.7) | 93.0 (1.5) | 91.4 (1.7) | 91.0 (1.1) | 84.9 (2.9) |
| 0.1 mg/kg (N = 4) | 88.1 (2.9) | 91.5 (1.2) | 85.0 (1.4) | 80.4 (3.0) | 77.6 (3.8) |
| 0.3 mg/kg (N = 3) | 92.9 (8.0) | 101.1 (5.3) | 87.2 (4.3) | 88.3 (4.1) | 86.7 (4.9) |
| 1 mg/kg (N = 3) | 92.1 (3.5) | 101.2 (5.4) | 85.5 (4.4) | 84.5 (1.6) | 81.9 (2.3) |
| 3 mg/kg (N = 4) | 88.6 (1.2) | 108.2b (3.3) | 80.1c (2.1) | 83.0 (2.8) | 85.7 (2.8) |
| 6 mg/kg (N = 5) | 84.7a (2.2) | 106.8b (4.0) | 75.2c (3.3) | 90.0 (3.3) | 89.8 (2.9) |
| 9 mg/kg (N = 3) | 93.2a (5.3) | 130.0b (9.3) | 84.0c (3.0) | 95.7 (3.2) | 89.3 (7.1) |
Data shown in mg/dL.
SEM, standard error of the mean.
Combined days –2 and –1. The two part 2 placebo subjects were likewise averaged for those days.
P < 0.05 vs day –1 and placebo.
P < 0.05 vs placebo.
The morning fasting insulin levels are shown in Table 3. On Day 1, shortly after X358 infusion, insulin levels were increased in a dose-dependent manner up to ninefold over baseline. Significantly elevated insulin levels generally persisted throughout the week in the 3-, 6-, and 9-mg/kg dose treatment groups.
Fasting Insulin Levels (Mean ± SEM)
| Group | Day –1 | Day 1 | Day 2 | Day 3 | Day 6 |
|---|---|---|---|---|---|
| Placebo (N = 7) | 7.0 (0.6) | 7.5 (1.2) | 7.0 (0.9) | 8.5 (0.9) | 6.2 (2.6) |
| 0.1 mg/kg (N = 4) | 4.6 (1.0) | 13.7 (2.8) | 7.9 (1.0) | 9.1c (0.9) | 7.6 (1.9) |
| 0.3 mg/kg (N = 3) | 6.0 (2.8) | 21.7 (7.7) | 21.2 (8.1) | 18.8 (10.0) | 8.1 (2.1) |
| 1 mg/kg (N = 3) | 8.4 (3.1) | 36.0 (25.7) | 15.5 (5.6) | 27.4 (13.8) | 16.9 (6.5) |
| 3 mg/kg (N = 4) | 6.2 (0.9) | 40.5b (7.2) | 15.1b (2.1) | 23.8b (5.4) | 26.2b (3.7) |
| 6 mg/kg (N = 5) | 5.0a (0.7) | 56.3b (11.2) | 27.1b (5.6) | 73.2b (22.5) | 63.7b (12.9) |
| 9 mg/kg (N = 3) | 9.0a (2.2) | 84.0b (16.5) | 56.4b (6.6) | 106.1b (11.4) | 66.9b (11.9) |
Data shown in uIU/mL.
SEM, standard error of the mean.
Combined days –2 and –1. The two part 2 placebo subjects were likewise averaged for those days.
P < 0.05 vs day –1 and placebo.
P < 0.05 vs day –1.
Morning fasting C-peptide levels were monitored throughout the study week and are depicted in Table 4. The time points and days depicted are consistent with the fasting glucose and insulin data shown in Tables 2 and 3. In contrast to insulin changes, the only apparent treatment-related change was on Day 1, shortly after X358 infusion, wherein ∼1.5-fold elevations from baseline were observed in the 3-, 6-, and 9-mg/kg dose groups. This transient elevation coincided with the transient glucose elevation in the high-dose cohort. On other days and dose groups, serum C-peptide levels were comparable to baseline and placebo. C-peptide lowering on day 2 for some of the higher dose groups correlated with some glucose lowering in those groups on that morning. Hence, fasting C-peptide changes tended to mirror fasting glucose changes. Elevations in insulin levels did not correlate with C-peptide increases. In fact, C-peptide/insulin ratios dose-dependently decreased with increasing X358 dose. For example, 24-hour areas under the curve (AUCs) on day 1 yielded a C-peptide/insulin ratio = 0.19 ± 0.03 [mean ± standard error of the mean (SEM)] for the placebo group vs 0.09 ± 0.02 at 0.3 mg/kg and 0.05 ± 0.01 (P < 0.05) at 3 mg/kg.
Fasting C-Peptide Levels (Mean ± SEM)
| Group | Day –1 | Day 1 | Day 2 | Day 3 | Day 6 |
|---|---|---|---|---|---|
| Placebo (N = 7) | 1.7 (0.2) | 1.7 (0.2) | 1.7 (0.3) | 1.7 (0.3) | 1.6 (0.3) |
| 0.1 mg/kg (N = 4) | 1.5 (0.4) | 1.7 (0.2) | 1.3 (0.2) | 1.4 (0.2) | 1.4 (0.2) |
| 0.3 mg/kg (N = 3) | 1.9 (0.5) | 2.4 (0.5) | 2.4 (0.5) | 1.5 (0.4) | 1.4 (0.3) |
| 1 mg/kg (N = 3) | 1.9 (0.5) | 1.7 (0.2) | 1.1 (0.2) | 1.9 (0.6) | 1.2 (0.3) |
| 3 mg/kg (N = 4) | 1.6 (0.3) | 2.2 (0.5) | 1.1 (0.2) | 1.4 (0.2) | 1.5 (0.2) |
| 6 mg/kg (N = 5) | 0.9 (0.1) | 1.5 (0.3) | 0.6b (0.2) | 1.2 (0.3) | 1.3 (0.2) |
| 9 mg/kg (N = 3) | 1.3 (0.1) | 2.6c (0.4) | 1.0 (0.3) | 1.9 (0.5) | 1.7 (0.3) |
Data shown in ng/mL.
SEM, standard error of the mean.
Combined days –2 and –1. The two part 2 placebo subjects were likewise averaged for those days.
P < 0.05 vs placebo.
P < 0.05 vs day –1.
Analysis of lipid-related or counter-regulatory factors was limited to analyses of morning fasting ketones (β-hydroxybutyrate) in placebo and 0.1- to 3-mg/kg dose recipients, and morning fasting serum glucagon levels on days –1, 1, and 6 in placebo and 6- to 9-mg/kg dose recipients. As shown in Supplemental Table 2, there were no notable changes following X358 treatment (0.1 through 3 mg/kg) on ketone levels aside from a transient increase on day 2 postdose in the 3-mg/kg dose group. Glucagon levels in the placebo, 6-, and 9-mg/kg dose volunteers ranged from 6 to 19 pg/mL on day –1 and did not notably change in a time- nor dose-related manner after X358 (data not shown).
Postprandial changes in glucose and insulin levels were selected on day 3 for analysis 2 hours after standard dinner meals as a stable, representative study day (Supplemental Table 3). X358 treatment led to increased postprandial glucose (PPG) levels relative to placebo in a dose-related manner between 0.3- to 9-mg/kg dose levels and significantly so at 3, 6, and 9 mg/kg. The magnitude of elevated PPG appeared to plateau at 3 mg/kg. Postprandial insulin levels were elevated up to approximately 10-fold placebo levels in the 6- and 9-mg/kg dose treatment groups. And the elevated postprandial insulin levels appear to be approaching a plateau at 6 to 9 mg/kg.
The potential for X358 infusion to impart insulin resistance in test subjects was addressed indirectly via analysis of fasting glucose and insulin levels for homeostatic model assessment of insulin resistance (HOMA-IR) and directly via short ITT procedures in the 3-mg/kg dose test group. As shown in Supplemental Table 4, relative to baseline or to placebo controls, X358 infusion resulted in dose-dependent increases in HOMA-IR that were most profound shortly postinfusion: day 1 HOMA-IR values were dose-dependently increased and ranged from moderate (at 0.1 mg/kg) to severe (at all other dose levels) and essentially peaked at the 9-mg/kg dose. These measures of moderate to severe insulin resistance tended to persist throughout the week and gradually diminished in a dose-related manner.
With indications of X358 dose-related biological activity including the noted changes in insulin and PPG levels in the 0.1-, 0.3-, and 1-mg/kg dose cohorts, an ITT was incorporated into test procedures, per protocol, for the 3-, 6-, and 9-mg/kg dose cohorts. The procedure was based upon that originally published by Bonora et al. (20) and involved a bolus IV injection of 0.1 U/kg insulin (Humulin-R®) with the baseline performed on day –1 and postadministration tests on various days after X358 infusion. Addition of later test days was amended into the study following the observed responses at 3 mg/kg.
The ITT results for the 3-mg/kg dose cohort are shown in Fig. 2, wherein all subjects and test days could be combined with glucose changes expressed as % change from day 1 baselines. Importantly, the slope of insulin-induced glucose lowering was lowered after X358 infusion vs baseline controls in each treated subject, and this shift—reflecting attenuated insulin action—was similar on days 2, 3, and 5. Indeed, the deduced rate constants for plasma glucose elimination (KITT), shown for all ITT tests in Supplemental Table 5, were significantly altered on all post-X358 test days relative to the baseline average (3.3) or placebo subject average (2.9). The reduced glucose disposal effect of X358 treatment was therefore clearly apparent by day 2 at 3 mg/kg, largely unchanged through day 5, and was not tested at any later time points. Interestingly, a similar magnitude of KITT change (i.e., imparted insulin resistance) was observed in the 6- and 9-mg/kg dose treatment groups, but the duration for KITT lowering was dose related extending through day 11 at 6 mg/kg and day 22 at 9 mg/kg (Supplemental Table 5). An estimation of altered insulin clearance dynamics following X358 treatment could be obtained by analyzing the very early serum insulin changes following IV insulin administration in the ITTs before and after 358. For example, the AUC 0 to 14 minutes for the 3-mg/kg dose cohort on day –1 was 4.98 ± 1.01 (mean ± SEM) vs 8.55 ± 0.47 (P < 0.05) on day 3 (after X358). Hence, insulin clearance (dose/AUC) was reduced nearly twofold. And yet X358 inhibited the action of even the increased insulin AUC based on the post-X358 elevated ITT glucose levels.
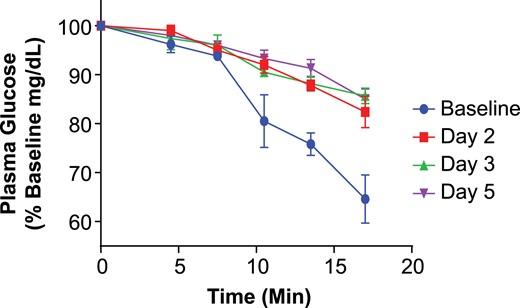
Change in plasma glucose vs time during ITTs for the cohort at baseline and following 3 mg/kg X358 administration. Depicted are the results from the short ITT wherein plasma glucose levels were monitored every 3 to 4 minutes for over 17 minutes following 0.1 U/kg IV insulin administration. Plasma glucose values (mean ± SEM) are expressed as percentage of preinsulin control levels at baseline (blue) vs days 2, 3, and 5 per legend.
Discussion
The results of the healthy volunteer study described herein represent the first report for a fully human mAb drug candidate targeting the InsR. X358, a selective negative allosteric modulator, was administered intravenously at single, ascending doses. In this study group, it was safe and well tolerated, exhibited a long half-life, and imparted insulin resistance lasting at least several days postinfusion.
For many patients with persistent HH including CHI, postgastric bypass hypoglycemia (PGBH), and malignant insulinomas, pharmacotherapy to prevent hypoglycemic episodes is a mainstay of medical management (3, 4, 11, 12, 14, 21). At the same time, few drugs are actually approved for such conditions and new options that are both effective and well tolerated are needed (14, 22, 23). Diazoxide acts at the pancreatic KATP channel to reduce insulin secretion, is indicated for hypoglycemia due to hyperinsulinism, and is first-line in CHI, but is not effective in the ∼50% of patients with KATP channel mutations (3, 4). Variable efficacy is apparent in PGBH (13). Side effects of diazoxide include fluid retention, edema, hypertrichosis, and hirsutism resulting in abnormal facial features in children (24). The somatostatin analog, octreotide, and the longer-acting variant, lanreotide, have been used off-label with mixed success in HH (3, 13, 22, 25). These somatostatin analogs can stunt growth in children and incidents of cholestasis and necrotizing enterocolitis have also been reported (26). Glucagon is short acting and has GI side effects. In serious cases of HH often unresponsive to other medications, glucocorticoids may be administered chronically, but is associated with edema and protein catabolism with the features of Cushing’s syndrome. α-Glucosidase inhibitors (e.g., acarbose) and calcium channel blockers (e.g., verapamil)—alone or in combination—have shown some utility in PGBH (13). Side effects include gastrointestinal distress (acarbose) or hypotension and edema (verapamil). The only novel drug candidate in development for HH, to our knowledge, is the peptide GLP-1 antagonist Exendin(9–39), which has been tested with continuous IV infusions and has attenuated fasting- or meal-induced blood glucose declines in CHI (23) and PGBH (27), respectively.
Since the 1990s, antibodies to the InsR have been reported that block insulin signaling and may even induce hyperglycemia (16). Hence, therapeutic antibodies that inhibit InsR signaling could be used as a treatment for diseases of HH. X358 is a fully human, allosteric mAb that binds with nanomolar affinity to human InsR isoforms A and B, has similar binding properties between multiple species, and appears quite selective including little or no interaction with the insulin-like growth factor-1 receptor (17, 18). In cultured cells, X358 markedly inhibits downstream insulin signaling and only weakly affects the binding of insulin to its receptor. Injection of the mAb into hyperinsulinemic hypoglycemic mice, normalizes their fasting glucose levels in a dose-dependent fashion (17, 18). Moreover, X358 was studied in an animal model of CHI, the SUR-1−/− mice, and mAb administration was shown to normalized fasting glucose levels (D. DeLeon, personal communication). To our knowledge, X358 is the first fully human monoclonal anti-InsR antibody to be advanced into clinical testing.
In this healthy volunteer population, X358 administration appeared generally safe and well tolerated throughout the ascending dose cohorts. The PKs were dose proportional with low intersubject variability and with serum drug concentrations and elimination half-lives greater than anticipated from rat and monkey studies and yet comparable to other human immunoglobulin G mAbs administered IV to humans (28, 29). The average calculated half-life was 21 days (range = 17 to 25) and did not appear to vary across the dose levels.
Dose-dependent pharmacological activity of X358 was clearly evident from glucose and insulin measurements under various normal daily conditions as well as during specific insulin sensitivity testing. Preclinical studies suggested that two of the more sensitive PD changes following X358 treatment might include elevations of PPG levels and increases in circulating insulin under fasting and postprandial conditions. Indeed, as indicated in Table 3, and Supplemental Table 3, increases in fasting insulin and both PPG and insulin levels relative to predose controls and/or placebo were evident even at 0.3 mg/kg and extended through day 6, depending on the dose. X358-dependent fasting or postprandial insulin elevations were apparent within a few hours of dosing on day 1. Clearly, despite substantial X358-related increases in insulin levels, PPG levels were still increased following treatment, thus implying marked inhibition of insulin activity.
Importantly, C-peptide changes followed, in a normal physiological manner, glucose changes in terms of timing and relative magnitude vs insulin changes following X358 administration. Prior analyses and the sets of data herein suggest that post-X358, elevated insulin levels are related predominantly to reduced InsR-mediated insulin clearance vs beta-cell hypersecretion or displacement of insulin binding to receptors. We have previously reported on the allosteric nature of the mAb and limited effect on displacement of insulin binding (17, 18). Supportive data for X358-attenuated insulin clearance noted in the Results section includes the following: (1) sustained periods of C-peptide levels at or below pre-X358 levels wherein insulin levels are elevated, (2) 24-hour C-peptide/insulin ratios that dose-dependently decrease at a magnitude comparable to that for the insulin increase, and (3) the deduced reduction of serum insulin clearance in a very early period (first 14 minutes) in the ITT on day 3 post-358 vs baseline. Indeed, precedence for altered insulin disposal following receptor modulation includes humans with an InsR mutation that compromises receptor-mediated insulin internalization resulting in reduced insulin clearance and elevated circulating insulin levels (30).
Unlike PPG, fasting glucose levels were not substantially affected following X358 administration aside from a transient elevation shortly postdosing at the higher X358 dose levels. Fasting insulin levels were significantly elevated in a dose incremental manner and duration of such was likewise dose related. As noted previously, these results strongly implicate insulin resistance following X358 administration. Accordingly, a classic HOMA-IR data analysis supported this interpretation with postdose values consistent with severe insulin resistance apparent even on day 1 and lasting at least through day 6 at the 3- to 9-mg/kg dose levels. A PK–PD relationship is apparent as lowering serum drug levels generally correlated with a reduction in HOMA-IR values across the test period. Ketone levels analyzed were generally unaltered with the exception of the 3-mg/kg dose cohort, wherein a transient elevation was observed on days 2 to 3 and may have reflected X358-mediated attenuation of insulin action at the liver.
A short ITT was included in the prospective study design to stringently test insulin resistance in the higher dose cohorts. Indeed, on days 2, 3, and 5 following X358 infusion at 3 mg/kg, the slope of the serum insulin elimination curves was significantly reduced after X358 treatment relative to baseline or placebo results. The blunting of insulin-induced glucose lowering by drug administration was evident in all the drug recipients and this hallmark of in vivo insulin resistance appeared as good at day 5 as at any earlier time point. Similar KITT changes were observed in the 6- and 9-mg/kg dose X358-treated subjects and with the imparted insulin resistance apparent in the 9-mg/kg dose treatment group 3 weeks postdose.
A working model accounting for certain postdose changes in glucose, insulin, and C-peptide is as follows: intravenously-administered X358 may first impact hepatic InsR action such that at least insulin clearance is reduced and receptor activity is attenuated within ∼1 hour of dosing. Insulin levels are promptly and significantly elevated, and glucose levels transiently and modestly rise under fasting conditions. The partitioning of the mAb into the muscle and adipose takes longer and is proportionally less than liver, like other mAbs (19, 31, data not shown). The trend for some transient glucose lowering ∼24 hours post-X358 infusion (morning fasting day 2) could be consistent with incomplete partitioning of mAb into muscle, wherein the X358-elevated insulin levels are not yet fully inhibited as is evident by the morning of day 3 and later where glucose values are at or above control. A more steady-state effect is evident by day 3 wherein X358-imparted insulin resistance is clearly evident as fasting and postprandial insulin levels are substantially elevated, and yet glucose levels are minimally affected (fasting conditions) or are significantly elevated postmeal wherein the liver probably plays a greater role in insulin-mediated glucose disposal and wherein X358 inhibitory potential may be greatest. Regardless, attenuation of both liver and muscle InsR activity must be well engaged because of the impact of X358 on IV insulin in the ITTs on days 2+ and clamp studies have indicated muscle participation in glucose disposal in these tests (19).
Although the current study supports the concept of X358 utility in inhibiting insulin action in vivo (with potential pharmacologic utility in certain conditions of HH), some limitations are notable. This was a study only in males and with a relatively low number of healthy volunteers in each cohort. Moreover, the dynamics of insulin and glucose changes were followed only after single administration vs more steady state drug level conditions. Lastly, more quantitative metabolism analyses that may improve an understanding of drug action, such as clamping studies, were not performed. For translation to disease conditions, dose response and PD changes must be carefully studied in patient populations wherein glucose-regulating processes are aberrant. Nonetheless, these preliminary results establishing initial safety/tolerability, PK, and PD parameters for X358 support its continued development as a first-in-class modulator of insulin action.
Abbreviations:
- AE
adverse event
- AUC
area under the curve
- BMI
body mass index
- CFR
Code of Federal Regulations
- CHI
congenital hyperinsulinism
- ECG
electrocardiogram
- HH
hyperinsulinemic hypoglycemia
- HOMA-IR
homeostatic model assessment of insulin resistance
- InsR
insulin receptor
- ITT
insulin tolerance test
- IV
intravenous
- mAb
monoclonal antibody
- PD
pharmacodynamic
- PGBH
postgastric bypass hypoglycemia
- PK
pharmacokinetic
- PPG
postprandial glucose
- SEM
standard error of the mean
- X358
XOMA 358.
Acknowledgments
A number of XOMA scientists contributed to the clinical advancement of X358, including Rajneesh Nath, Ken Der, Al Dadson, Joel Freeberg, Ago Ahene, Liching Cao, Jim Neal, and Pat Scannon. Celerion and Parexel staff at the Phase 1 units (Phoenix, Arizona, and Baltimore, Maryland, respectively) capably implemented the study.
Current affiliation: J. Roessig’s current affiliation is Genentech, Inc., South San Francisco, California 94080. P. Rubin’s current affiliation is Miragen Therapeutics, Inc., Boulder, Colorado 80301. I. Goldfine’s current affiliation is as an independent consultant.
This study was funded by XOMA Corporation.
Author contributions: All authors were involved in the study design and/or implementation. K.W.J. led the analyses and manuscript drafting. I.G. was a primary editor.
Disclosure Summary: All authors were XOMA-paid employees during the study, some with stock equity.
References
Author notes
Correspondence: Kirk W. Johnson, PhD, XOMA Corporation, 2910 Seventh Street, Berkeley, California 94710. E-mail: kirkjohnson@comcast.net.
