


Abstract
Pancreatic steatosis may contribute to β-cell dysfunction in type 2 diabetes (T2D), but data are controversial. Women who had gestational diabetes mellitus (GDM) are at high risk for developing T2D.
To examine the association of pancreatic fat content with early/first-phase insulin secretion (as markers of β-cell function).
Cross-sectional analysis of a subcohort of the monocentric, prospective cohort study titled Prediction, Prevention, and Subclassification of Type 2 Diabetes.
Ludwig Maximilians University Hospital, Munich, Germany.
Ninety-seven women, 3 to 16 months after pregnancy [41 normoglycemic women post-GDM, 19 women post-GDM with pathological glucose metabolism, and 37 normoglycemic women after a normoglycemic pregnancy (controls)].
Correlation of MRI-measured pancreatic fat content with early insulin release in an oral glucose tolerance test (OGGT) [insulin increment within the first 30 minutes of the OGTT (IR30)] and first-phase insulin response (FPIR) in an intravenous glucose tolerance test (n = 65), both adjusted for insulin sensitivity index (ISI).
Pancreatic fat content did not correlate with IR30 and FPIR adjusted for ISI. It correlated positively with body mass index, waist circumference, liver fat, and intraabdominal fat volume.
Pancreatic fat content does not correlate with β-cell function in a cohort of young women with different degrees of T2D risk.
In combination with a progressive decrease in β-cell function (1), insulin resistance characterizes type 2 diabetes (T2D). Sharing pathophysiologic mechanisms with T2D (2), gestational diabetes mellitus (GDM) is a transient disturbance of glucose metabolism during pregnancy. Consequently, GDM indicates a high risk of subsequent, permanent T2D. Twenty or more percent of women with GDM develop overt T2D within 10 years after the index pregnancy (3).
The hallmark of β-cell dysfunction in T2D is reduced first-phase insulin secretion (4). Various factors have been implicated in the development of this dysfunction, in particular genetic risk, increased age, obesity, physical inactivity, glucotoxicity, and lipotoxicity (5). The last factor, lipotoxicity, has been linked to intrapancreatic fat deposition (6). Nonadipose tissues, such as liver, skeletal muscle, heart, and also the pancreas, can accumulate triglycerides and other lipids, a process seen in many obese individuals (6). This intraorgan fat contributes to insulin resistance, particularly of the liver, and can lead to organ inflammation and damage, exemplified by nonalcoholic fatty liver disease (7).
The role of pancreatic lipid accumulation in the development of β-cell dysfunction continues to be debated. In Zucker diabetic fatty rats, triglyceride overload in the pancreatic islets fosters hyperglycemia and β-cell loss (8). In humans, pancreatic fat content correlates negatively with β-cell function in several cohorts (9–11), and fat deposition in the pancreas was associated with diabetes (12–15) and prediabetes (14) in some studies. However, others have found neither a negative correlation of pancreatic fat content with β-cell function (10, 16–18) nor the association of pancreatic fat with glycemic state (19, 20).
These divergent findings may in part be the result of difficulties to accurately quantify intrapancreatic fat. The pancreas is not generally accessible to biopsy and the standard noninvasive imaging techniques (abdominal ultrasonography, computed tomography, and routine MRI) lack sensitivity and accuracy (21). Single-voxel (1H) magnetic resonance spectroscopy (MRS) has been used as an alternative in most human studies to date, but it is susceptible to errors due to the small size of the organ and its surrounding fat tissue. Breathing artifacts can be a particular problem with this technique (21). Newer techniques, such as modified Dixon-based MRI, offer significant advantages over MRS: shorter acquisition and postprocessing times, as well as no need of high-level operator expertise in voxel placement. These methods are also sufficiently sensitive and avoid motion artifacts by a single breath-hold technique and manual segmentation (15, 22, 23).
In this study, we applied a modified two-point Dixon MRI technique to quantify pancreatic fat content in a cohort of young women after a recent pregnancy with and without gestational diabetes. We examined whether pancreatic fat correlated with early/first-phase insulin release as markers of adequate β-cell function.
Materials and Methods
Study design
This study was performed as a cross-sectional analysis in the course of the prospective, monocenter observational study titled Prediction, Prevention, and Subclassification of Type 2 Diabetes (PPS-Diab) (24). The study population consisted of women 3 to 16 months after a pregnancy complicated by GDM [post-GDM (pGDM)] or after a normoglycemic pregnancy (control subjects) at a ratio of ∼2:1. The participants were recruited consecutively at the Diabetes Center and the obstetrics department of the University Hospital (Klinikum der Universitaet Muenchen) in Munich, Germany. All participants provided written informed consent and the study protocol was approved by the Ethics Committee of the Ludwig Maximilians University (Munich, Germany).
Participants
The diagnosis of GDM was based on a 75-g oral glucose tolerance test (OGTT) during pregnancy. The cutoff values for GDM were 92/180/153 mg/dL plasma glucose following the International Association of the Diabetes and Pregnancy Study recommendations (25). Women could participate as control subjects when they had no history of GDM in any previous pregnancy and either a normal 75-g OGTT or a normal 50-g screening OGTT (<135 mg/dL plasma glucose, n = 3) after the 23rd week of gestation. All data used in this analysis were collected at the baseline visit of the PPS-Diab study that occurred 3 to 16 months after the index pregnancy. A postpartum visit with a 75-g OGTT is recommended for all women with GDM in Germany.
Anthropometrical and clinical measurements
Anthropometrics, clinical, and clinical chemistry data were obtained as described previously (24). We used the definitions of the American Diabetes Association (26) to distinguish between participants with normal glucose tolerance (NGT) and those with pathological glucose tolerance (PGT); that is, impaired fasting glucose, impaired glucose tolerance, or newly diagnosed T2D (during the study visit).
Fat fraction measurements with MRI
In addition to the basic examination, all study participants were invited for a whole-body MRI study (3 Tesla system, Ingenia or Achieva; Philips Health Care, Best, Netherlands). Liver and pancreatic fat content were derived from fat-fraction maps based on fat/water images of a single breath-hold modified two-point Dixon sequence (repetition time 4.1 ms, first echo time 1.5 ms, second echo time 2.7 ms, flip angle 5°, slice thickness 5 mm, 184 × 170 matrix, 320 × 300 × 200 field of view, breath-hold time ∼12 seconds). In the pancreas, three regions of interest (ROIs) with sizes of ∼70 to 90 mm2 each were placed in each of the three anatomic parts of the organ, that is, caput, corpus, and cauda, so that a total number of nine measurements resulted. Care was taken to avoid the surrounding visceral fat, greater regions of intrapancreatic adipose tissue infiltration, as well as visible vascular and ductal structures. Medians and means for the whole pancreas were calculated. ROIs with sizes of ∼120 to 150 mm2 each were placed in three different sites of segment VII in the right liver lobe, avoiding visible vascular structures, and the median was calculated. Three-dimensional mDixon whole-body sequences were obtained and postprocessed with the software SliceOmatic 4.3 rev. 11 (TomoVision, Magog, QC, Canada) to quantify subcutaneous and visceral adipose tissue volume as described in more detail previously (24)].
OGTT
All study subjects received a 75-g OGTT. The Matsuda insulin sensitivity index (ISI) was calculated as described previously (27) and validated against hyperinsulinemic/euglycemic clamps (24) in a subgroup of participants. The insulin increment within the first 30 minutes of the OGTT (IR30) was used as an approximation of first-phase insulin secretion in the OGTT. This was previously validated with intravenous glucose tolerance tests (IVGTTs) in a subgroup of study participants and yielded a better correlation did the insulinogenic index (24). The disposition index (DI) was calculated as IR30 × ISI (28).
IVGTT
We invited all participants to also return for an IVGTT on a separate day. This was executed as described previously (24). First-phase insulin response (FPIR) was calculated as the incremental area under the insulin curve during the first 10 minutes after glucose injection. An intravenous DI (ivDI) was calculated as FPIR × ISI.
Statistical analyses
The primary outcome measures were the correlations of pancreatic fat content with early insulin release in an OGTT (IR30) and first-phase insulin response in an IVGTT (FPIR; n = 65), both adjusted for ISI.
All metric and normally distributed variables are reported as mean ± SD; nonnormally distributed variables are reported as median (first quartile to third quartile), and categorical variables are reported as frequency (percentage). To compare groups, the Kruskal–Wallis test and a Dunn post hoc test were used for metric variables and the χ2 or Fisher exact test was used for categorical variables. P values of <0.05 were considered statistically significant. Spearman correlation coefficients (ρ) and partial correlation coefficients were calculated for the correlation analyses. All statistical calculations were performed using SAS (version 9.3; SAS Institute) or R (version 3.1.3; www.R-project.org).
Results
Baseline characteristics
Complete pancreatic fat measurements were obtained from 102 women. We excluded five participants, two because of a diagnosis of type 1 diabetes, one because of overt hyperthyroidism at the time of the study visit, and two because of an abnormal OGTT at the study visit despite a history of a normoglycemic pregnancy. The final cohort consisted of 97 women, 41 normoglycemic women pGDM (pGDM/NGT), 19 women pGDM with pathological glucose metabolism (pGDM/PGT), and 37 normoglycemic women after a normoglycemic pregnancy (controls). The mean age was 35.5 ± 4 years and subjects were examined at an average of 9.6 ± 2.9 months after delivery. Compared with controls, women pGDM/PGT had a higher body mass index (BMI), waist circumference, systolic blood pressure, high-sensitive C-reactive protein, γ-glutamyltransferase, and triglycerides, as well as a lower high-density lipoprotein cholesterol, ISI, DI, and ivDI. pGDM/NGT had higher systolic blood pressure, 2-hour plasma glucose, and lower ISI, DI, and ivDI than did controls. All baseline characteristics are shown in Table 1.
Baseline Characteristics
| Total | Control | pGDM/NGT | pGDM/PGT | P Value | Post Hoc Test | |
|---|---|---|---|---|---|---|
| Clinical characteristics | ||||||
| N | 97 | 37 | 41 | 19 | ||
| Age, y (mean ± SD) | 35.5 ± 3.9 | 35.9 ± 4.1 | 35.0 ± 3.3 | 35.7 ± 4.5 | 0.5383 | — |
| Time since delivery, mo (mean ± SD) | 9.6 ± 2.9 | 9.3 ± 2.6 | 9.8 ± 3.1 | 9.9 ± 3.0 | 0.7855 | — |
| BMI, kg/m2 (mean ± SD) | 24.9 ± 5.2 | 22.8 ± 3.3 | 24.8 ± 4.6 | 29.0 ± 6.8 | 0.0015 | Control vs PGT |
| BMI <25 | 60 (61.9%) | 27 (73.0%) | 27 (65.9%) | 6 (31.6%) | 0.0061 | |
| BMI ≥25 to <30 | 19 (19.6%) | 8 (21.6%) | 6 (14.6%) | 5 (26.3%) | ||
| BMI ≥30 | 18 (18.6%) | 2 (5.4%) | 8 (19.5%) | 8 (42.1%) | ||
| Waist circumference, cm (mean ± SD) | 80.2 ± 11.1 | 76.3 ± 9.0 | 80.0 ± 11.2 | 88.3 ± 11.0 | 0.0007 | Control vs PGT, NGT vs PGT |
| Systolic blood pressure, mm Hg (mean ± SD) | 115.7 ± 10.3 | 111.5 ± 10.0 | 117.4 ± 9.3 | 120.1 ± 10.6 | 0.0013 | Control vs PGT, NGT vs control |
| Diastolic blood pressure, mm Hg (mean ± SD) | 72.1 ± 9.1 | 69.0 ± 8.2 | 73.1 ± 7.3 | 76.1 ± 12.3 | 0.0151 | No |
| IFG, n (%) | 8 (8.3) | — | — | 8 (42.1) | — | |
| IGT, n (%) | 7 (7.2) | — | — | 7 (36.8) | ||
| IFG + IGT, n (%) | 1 (1.0) | — | — | 1 (5.3) | ||
| T2D, n (%) | 3 (3.1) | — | — | 3 (15.8) | ||
| MRI | ||||||
| Pancreatic fat, % [median (Q1–Q3)] | 2.7 (1.8–4.8) | 2.2 (1.9–3.4) | 3.2 (1.7–5.6) | 2.8 (1.9–6.9) | 0.0983 | — |
| Liver fat, % [median (Q1–Q3)] | 0.5 (0.03–1.3) | 0.2 (0.0–0.5) | 0.5 (0.1–1.3) | 2.1 (0.3–5.3) | 0.0010 | Control vs PGT |
| Intraabdominal fat, L [median (Q1–Q3)] | 1.6 (1.1–2.7) | 1.3 (0.8–1.9) | 1.7 (1.1–2.8) | 2.5 (1.3–3.3) | 0.0091 | Control vs PGT |
| Clinical chemistry | ||||||
| Triglycerides, mg/dL [median (Q1–Q3)] | 64.0 (53.0–91.0) | 59.0 (52.0–75.0) | 66.0 (49.0–92.0) | 95.0 (64.0–130.0) | 0.0061 | Control vs PGT, NGT vs PGT |
| LDL cholesterol, mg/dL [median (Q1–Q3)] | 104.0 (88.0–119.0) | 104.0 (85.0–116.0) | 103.0 (89.0–120.0) | 112.0 (88.0–126.0) | 0.6285 | — |
| HDL cholesterol, mg/dL [median (Q1–Q3)] | 61.0 (50.0–73.0) | 64.0 (58.0–75.0) | 64.0 (49.0–73.0) | 49.0 (42.0–59.0) | 0.0006 | Control vs PGT, NGT vs PGT |
| hsCRP [median (Q1–Q3)] | 0.0 (0.0–0.1) | 0.0 (0.0–0.1) | 0.0 (0.0–0.1) | 0.1 (0.0–0.3) | 0.0018 | Control vs PGT |
| γ-Glutamyltransferase, U/L [median (Q1–Q3)] | 14.0 (11.0–20.0) | 13.0 (10.0–17.0) | 14.0 (11.0–18.0) | 22.0 (15.0–29.0) | <0.0001 | Control vs PGT, NGT vs PGT |
| OGTT | ||||||
| Fasting plasma glucose, mg/dL [median (Q1–Q3)] | 91.0 (88.0–96.0) | 90.0 (84.0–92.0) | 91.0 (88.0–94.0) | 103.0 (97.0–107.0) | <0.0001 | Control vs PGT, NGT vs PGT |
| Plasma glucose (2 h), mg/dL [median (Q1–Q3)] | 104.0 (87.0–121.0) | 87.0 (78.0–108.0) | 109.0 (100.0–121.0) | 146.0 (113.0–169.0) | <0.0001 | All |
| ISI [median (Q1–Q3)] | 5.5 (3.6–8.1) | 7.8 (5.5–9.5) | 5.4 (4.0–7.5) | 3.0 (2.3–4.0) | <0.0001 | All |
| IR30 [median (Q1–Q3)] | 40.8 (30.7–58.3) | 40.2 (31.7–61.8) | 41.1 (28.7–56.4) | 40.8 (33.4–60.0) | 0.8272 | — |
| DI [median (Q1–Q3)] | 232.7 (162.5–321.7) | 321.7 (250.6–392.0) | 194.4 (163.7–294.4) | 129.5 (100.5–173.4) | <0.0001 | All |
| IVGTT | ||||||
| FPIR [median (Q1–Q3)] (n = 65) | 2.1 (1.3–3.2) | 2.1 (1.2–2.8) | 1.9 (1.3–2.9) | 2.2 (1.4–3.4) | 0.7590 | — |
| ivDI [median (Q1–Q3)] (n = 65) | 11.1 (8.0–18.3) | 16.8 (11.1–22.9) | 9.9 (8.7–15.3) | 6.7 (5.8–10.2) | <0.0001 | All |
Abbreviations: IFG, impaired fasting glucose; LDL, low-density lipoprotein; HDL, high-density lipoprotein.
Pancreatic fat content in the different groups of study participants
We measured pancreatic fat content in nine ROIs covering the whole organ (Fig. 1; Supplemental Fig. 1). Median pancreatic fat content ranged from 0% to 23.7% and was not significantly different between the three groups of women (Table 1). One woman had a pancreatic fat content that was considerably higher than that of the rest of the cohort. This woman had no history of pancreatic disease, normal serum lipase, and no abnormalities of the pancreas in noncontrast MRI. We therefore left this case in our main analyses but also repeated these after excluding this woman (Supplemental Tables 1 and 2). This did not change any of our results significantly.
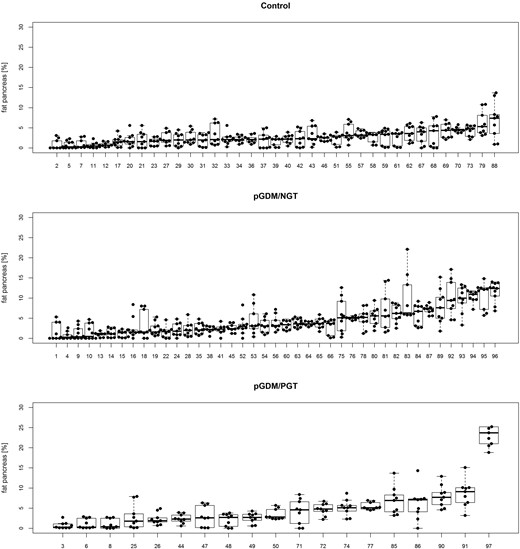
Pancreatic fat content of all study participants, sorted by group and, second, by median pancreatic fat content. Nine ROIs per participant (dots), including median and distribution, are shown. Numbers indicate rank of median pancreatic fat content in the whole cohort.
Correlations of pancreatic fat with insulin release, insulin sensitivity, and other fat compartment parameters
Median pancreatic fat content did not correlate with IR30 from the OGTT (ρ = 0.09; P = 0.47) and FPIR from the IVGTT (ρ = 0.17; P = 0.17), both adjusted for ISI (Fig. 2; Table 2; unadjusted results also in Supplemental Fig. 2). Additionally, median pancreatic fat did not correlate with DI and ivDI. However, it correlated positively with BMI, waist circumference, liver fat content, and intraabdominal fat volume (Fig. 2; Table 2). Median pancreatic fat correlated inversely with ISI, but this correlation was lost after adjustment for BMI (Table 2). The results were similar when we used mean or minimum pancreatic fat content instead of the median (Supplemental Table 2).
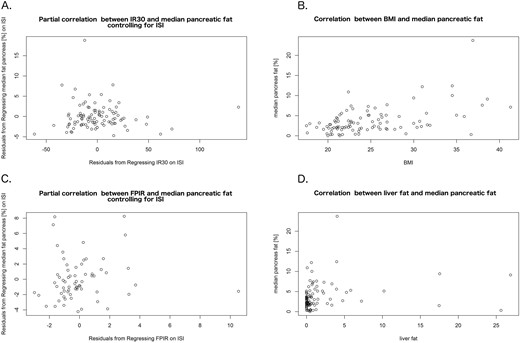
Correlations of pancreatic fat with main outcome measures and adiposity markers. We observed no correlation of median pancreatic fat content with (A) IR30 from the OGTT and (C) FPIR from the IVGTT, both adjusted for ISI. Significant positive correlations were seen between median pancreatic fat and markers of general and visceral adiposity, illustrated here by (B) BMI and (D) liver fat content.
(Partial) Spearman Correlation Coefficients With Median Pancreatic Fat Content
| IR30 | 0.16 (0.110) |
| IR30 adjusted for ISI | 0.09 (0.471) |
| FPIR | 0.24 (0.052) |
| FPIR adjusted for ISI | 0.17 (0.172) |
| DI | −0.18 (0.082) |
| ivDI | 0.04 (0.728) |
| BMI | 0.41 (<0.001) |
| Waist circumference, cm | 0.29 (0.004) |
| Liver fat, % | 0.28 (0.006) |
| Intraabdominal fat, L | 0.38 (<0.001) |
| ISI | −0.27 (0.008) |
| ISI adjusted for BMI | 0.01 (0.903) |
P values are shown in parentheses; when <0.05 they were considered statistically significant and are shown in bold.
Discussion
We examined pancreatic fat content in young women with different degrees of T2D risk. Our primary finding was that pancreatic fat content did not correlate with β-cell function. However, pancreatic fat content correlated positively with BMI as well as visceral and hepatic fat content.
To our knowledge, pancreatic fat content has not been examined previously in young women with and without recent GDM. It has been studied in individuals with prediabetes (impaired fasting glucose and/or IGT) and T2D. Most of these studies agree that pancreatic fat is higher in prediabetes and T2D compared with healthy control subjects (10, 12, 15, 16, 18, 20, 29, 30). However, this does not seem to be a specific feature of the pancreas but is linked to high liver fat content and visceral adiposity in general (11, 17, 20, 22, 31). In our study, intraabdominal fat and liver fat content were also correlated with pancreatic fat and were highest in the women pGDM/PGT, reflecting this group’s overall metabolic risk.
Early insulin release in the OGTT and first-phase insulin release in the IVGTT (both with adjustment for insulin sensitivity), as well as the DI, are generally used to quantify β-cell function in human studies. However, none of these parameters correlated negatively with pancreatic fat content in our study.
This finding contrasts with several in vitro and animal experiments that provide a potential pathophysiologic background by which pancreatic lipids could impair β-cell function (8, 32–34). However, preclinical models of the phenomenon are often artificial, for example, because of very high pancreatic fat content and free fatty acid level. Early human studies also found a negative association between pancreatic fat and β-cell function (9–11), but more recent work, similar to our study, could not confirm these findings (10, 16–18) (Table 2). Uncorrected insulin secretion is often even increased with higher pancreatic fat (16, 17), likely as a result of compensation for the insulin resistance associated with ectopic fat.
Based on our experience during this study, we became skeptical of results based on an MRS of the pancreas. This technique requires voxel placement based on a previous image and “blind” data acquisition. With the pancreas being small, often surrounded by adipose tissue, and mobile with respiration despite its retroperitoneal location, we found this method to be unreliable (data not shown). MRI fat fraction maps provided a better alternative and should be considered the current standard of reference.
One limitation of our study is that we were unable to discriminate between fat stored in infiltrating adipocytes or exocrine or endocrine pancreatic cells, because the measurement simply represented the mean fat content in the ROI. We therefore may have missed effects of different fat distributions among the various cell types, in particular intraislet lipotoxicity. Another limitation of the study is its cross-sectional design, which precludes the study of causal relationships. Although the sample size of our study was large for a cohort with detailed pancreatic fat measurements, it remains small from a biostatistics perspective. This may have limited our ability to detect additional differences in the cohort. We also cannot exclude that our findings may have been different without a preceding pregnancy.
Particular strengths of our work are its deeply phenotyped cohort homogeneous for age and sex but including individuals with different degrees of T2D risk, and a detailed measurement of the fat content in all anatomic regions of the pancreas.
We conclude that, in the population we studied, high pancreatic fat is not linked to impaired β-cell function.
Abbreviations:
- BMI
body mass index
- DI
disposition index
- FPIR
first-phase insulin response
- GDM
gestational diabetes mellitus
- IR30
insulin increment within the first 30 minutes of the oral glucose tolerance test
- ISI
insulin sensitivity index
- ivDI
intravenous disposition index
- IVGTT
intravenous glucose tolerance test
- MRS
magnetic resonance spectroscopy
- NGT
normal glucose tolerance
- OGTT
oral glucose tolerance test
- pGDM
post–gestational diabetes mellitus
- PGT
pathological glucose tolerance
- PPS-Diab study
Prediction, Prevention, and Subclassification of Type 2 Diabetes study
- ROI
region of interest
- T2D
type 2 diabetes
Acknowledgments
We are thankful to all participants of the PPS-Diab study and to the diabetes care team of the Medizinische Klinik 4. We also thank Vanessa Sacco, Carmen Wichmann, and Mandy Meisel for expert technical assistance.
Financial Support: This work was supported by the Helmholtz Zentrum München, Klinikum der Universität München, and the German Center for Diabetes Research.
Disclosure Summary: The authors have nothing to disclose.
References
Author notes
These authors contributed equally to this study and share last authorship.
