


Abstract
The question of whether there is daytime time variation in diet-induced thermogenesis (DIT) has not been clearly answered. Moreover, it is unclear whether a potential diurnal variation in DIT is preserved during hypocaloric nutrition.
We hypothesized that DIT varies depending on the time of day and explored whether this physiological regulation is preserved after low-calorie compared with high-calorie intake.
Under blinded conditions, 16 normal-weight men twice underwent a 3-day in-laboratory, randomized, crossover study. Volunteers consumed a predetermined low-calorie breakfast (11% of individual daily kilocalorie requirement) and high-calorie dinner (69%) in one condition and vice versa in the other. DIT was measured by indirect calorimetry, parameters of glucose metabolism were determined, and hunger and appetite for sweets were rated on a scale.
Identical calorie consumption led to a 2.5-times higher DIT increase in the morning than in the evening after high-calorie and low-calorie meals (P < .001). The food-induced increase of blood glucose and insulin concentrations was diminished after breakfast compared with dinner (P < .001). Low-calorie breakfast increased feelings of hunger (P < .001), specifically appetite for sweets (P = .007), in the course of the day.
DIT is clearly higher in the morning than in the evening, irrespective of the consumed calorie amount; that is, this physiological rhythmicity is preserved during hypocaloric nutrition. Extensive breakfasting should therefore be preferred over large dinner meals to prevent obesity and high blood glucose peaks even under conditions of a hypocaloric diet.
Obese people, who frequently struggle with type 2 diabetes as a consequence (1), often try to lose body weight or at least stop gaining some more by eating little in the morning or skipping breakfast entirely. The success of this strategy is controversial because reduced calorie intake in the first half of the day is mostly compensated by consumption of increased amounts of calories toward the end of the day (2) and the goal of weight loss is not achieved. Diurnal variation in energy turnover apparently plays a key role in this context. Some studies have shown that energy expenditure after a meal does not vary during the day (3, 4) and, hence, diurnal variation in food intake makes no difference. One even reported a higher energy expenditure at night than during the day (5). However, these studies display some weaknesses because they lack standardized laboratory conditions (3) and are biased by the influence of physical activity during the measurements (4). Other studies support the hypothesis that postprandial energy expenditure is higher in the morning than in the evening (6-9), and therefore, a large dinner meal instead of an extensive breakfast may promote obesity. However, the well-known circadian variation in a number of factors influencing energy turnover such as stress axis activity and glucose tolerance (7, 10, 11) indicate that energy metabolism is subject to a diurnal rhythmicity and thereby diet-induced thermogenesis (DIT) is also.
Moreover, in the context of numerous efforts to reduce body weight with low-calorie diets, the question arises whether potential diurnal differences in DIT are preserved after low-calorie meals. It appears conceivable that low-calorie consumption may diminish or even abolish any diurnal variation in DIT because energetic undersupply from a diet meal could induce some kind of energy-saving mechanism. Answering this question would be relevant to the efficiency of calorie-reduced diets for weight loss. Should the focus be on breakfast or is the time of day negligible?
To address this issue, our study investigated the hypothesis that DIT on an identical meal is higher in the morning than in the evening. We further assumed that this is also valid after low-calorie meals. In addition, we hypothesized that even after low-calorie meals the same circadian variations in glucose metabolism can be found as after high-calorie meals.
Participants and Methods
Participants
We examined a group of 16 healthy young men (age 23.6 ± 2.3 years) with a normal body mass index (22.5 ± 1.1 kg/m2). All participants had a self-reported regular sleep-wake cycle during the 6 weeks before the experiments. Exclusion criteria were any kind of medication, dieting in the last 6 months, and acute and chronic internal, neurologic, or psychiatric diseases. We also excluded people with type 2 diabetes mellitus in first-degree family members, alcohol or drug abuse, smoking, shift workers, competitive athletes, and individuals under extraordinary mental or physical strain. Each volunteer gave written informed consent. The study has been approved by the ethics committee of the University of Luebeck and carried out in accordance with the Declaration of Helsinki (2013) of the World Medical Association. This trial was registered at DRKS as DRKS00009851.
Experimental design and intervention
The study was performed according to a single-blind, randomized, crossover design. Each individual participated in 2 blinded conditions and stayed in our laboratory for 3 days, respectively. Conditions were separated by a minimum of 2 weeks. The order of the 2 conditions was randomized by simple randomization using random numbers in Microsoft Excel 2010. The day before experimental testing, participants arrived at 5:30 pm at our human laboratory and the participants’ body weight was measured by a medically approved scale (MPS-M, KERN & SOHN GmbH). Bioelectrical impedance analyses (Nutribox, Data Input) were performed to determine body composition. Volunteers were asked to conform to fixed sleep schedules (11:30 pm to 7 am) for the duration of the experiments and to avoid physical exertion and emotional drain. Participants were allowed to read, draw, watch television, play games, listen to music, and spend time at the computer in a sitting or lying position. To exclude any bias on the following morning’s glucose tolerance and to adapt participants to the laboratory environment, the volunteers received a standardized meal in terms of composition, quantity, and calorie content and spent one habituation night in the laboratory before starting the experiments.
On experimental days, baseline indirect calorimetric measurements were performed 45 minutes before breakfast and dinner, respectively, and blood samples were drawn 15 minutes before meal consumption (Fig. 1). Volunteers had breakfast at 9 am, lunch at 2 pm, dinner at 7 pm, and were instructed to finish the whole meal within 30 minutes. Postprandial measurements of indirect calorimetry were performed 0.5, 1.5, 2.5 and 3.5 hours after the beginning of breakfast and dinner, respectively. Postprandial blood sampling was executed 1, 2, and 4 hours after breakfast and dinner, as well as 1 and 3 hours after lunch. Hunger and appetite for sweets were assessed using 10 cm visual analog scales (0: not at all hungry/no appetite for sweets at all; 10: very hungry/great appetite for sweets) at 8:45 am, 1:45 pm, 6:45 pm, and 11:15 pm. Sleep architecture was monitored by standard electroencephalography to exclude any bias of disturbed sleep on the study outcome.
![Study protocol on the experimental days. Participants had breakfast at 9 am, lunch at 2 pm and dinner at 7 pm. Each individual participated in 2 blinded conditions: 1) high-calorie breakfast (69% of total energy expenditure [TEE]) and low-calorie dinner (11% of TEE), and 2) low-calorie breakfast (11% of TEE) and high-calorie dinner (69% of TEE). Lunch was identical in both conditions (20% of TEE).](https://oup.silverchair-cdn.com/oup/backfile/Content_public/Journal/jcem/105/3/10.1210_clinem_dgz311/4/m_jcem_105_3_e211_f1.jpeg?Expires=1716316924&Signature=GOQy5SE2XxmZQhcVTLtSdlCYzln7PT8rTyOZsU42lLbuSeBWUecObQneo0xiM8gmkiej~nckmKzFrcj1qe21F1dolup5ljWl2-b0sL79d4XUQOQ~NCbF3eNgllqCJnTpgyN~6SecuuTKktccvb0ljpHN5xd5vc5Q4UUC1rHkfvX~4Sm9GPsy75~T6Ljesa0T~VhryyNbeTGGJpqmf8ItlKx-BcM6eUWoUaDLca3FjLdS1-PcxaIineKmt4wyRVtkH22PDaHZR6lTbvSlatu4gb0NdvTOtkhzTECOksyMSuiHiYlM9~ACBNjeAP7466ORFNmK9S1FC3y5GsPsiRIk~g__&Key-Pair-Id=APKAIE5G5CRDK6RD3PGA)
Study protocol on the experimental days. Participants had breakfast at 9 am, lunch at 2 pm and dinner at 7 pm. Each individual participated in 2 blinded conditions: 1) high-calorie breakfast (69% of total energy expenditure [TEE]) and low-calorie dinner (11% of TEE), and 2) low-calorie breakfast (11% of TEE) and high-calorie dinner (69% of TEE). Lunch was identical in both conditions (20% of TEE).
Blinding and total energy expenditure–related individual energy content of the meals
To determine the individual total energy expenditure (TEE) of each participant, the basal metabolic rate was multiplied by the physical activity level. Basal metabolic rate was calculated by the Harris-Benedict equation (12) based on body weight, body height, and age. The physical activity level was set at 1.2 for seated and reclined activity in all conditions. The meals of the 2 conditions were 1) a high-calorie breakfast and low-calorie dinner and, vice versa, 2) a low-calorie breakfast and a high-calorie dinner. Basic meals before adaption to individual energy requirements contained 4171 kJ (49% carbohydrates, 10% protein, 41% fat) in the high-calorie and 1046 kJ (49% carbohydrates, 19% protein, 32% fat) in the low-calorie meals. In the case of higher energy requirements, meals were enriched with maltodextrin (15.9 kJ/g) to fulfil the calculated energy content for each subject. Finally, high-calorie meals covered 69% and low-calorie meals 11% of the participants’ individual TEE, and both conditions were identical in terms of overall percentage distribution of the macronutrient composition (46% carbohydrates, 18% proteins, and 36% fat). Additionally, the high- and low-calorie meal conditions were blinded. Lunch with an energy content of 20% (37% carbohydrates, 34% proteins, and 29% fat) was identical in both conditions.
Indirect calorimetry
Energy expenditure was measured for 30 minutes by indirect calorimetry (Vmax Encore 29n, CareFusion). By measuring rates of oxygen consumption and carbon dioxide production in the respiratory gases over a certain period of time, heat production, that is, total energy expenditure, can be calculated. Calibration of the oxygen and carbon dioxide analyzers was performed daily before the first measurement by using a reference gas (4% CO2, 16% O2, balance N2, and 26% O2 and balance N2; CalGas1, Scott Medical Products). Volunteers rested on a bed in a supine position and relaxed for 15 minutes before measurement. The quiet room had a temperature of 22°C to 24°C. Participants were not allowed to speak during the measurements and were regularly prompted (every 5 minutes) to move a finger to stay awake. A transparent ventilated hood was positioned over the individual’s head and carefully checked to prevent air leakage. Collins tubing was connected between the hood and the device to continuously collect the expired gases. Inspired and expired air, which was analyzed for oxygen and carbon dioxide every minute and collected with a personal computer, was used to reflect nutrient metabolism (6, 13). Respiratory quotient and substrate oxidation were calculated using oxygen consumption and carbon dioxide production. The DIT, the thermic effect of food, was calculated as the difference between postprandial resting energy expenditure (REE) and the basal REE prior to each meal.
Hormone analyses
All blood samples were immediately centrifuged and the supernatants stored at –85°C until assay. Serum insulin, cortisol, and ACTH concentrations were measured by immunoassay (Immulite, DPC); insulin: interassay coefficient of variation (CV) < 6.1%, intraassay CV < 5.2%; cortisol: interassay CV < 6.3%, intraassay CV < 5.8%; ACTH: interassay CV < 9.4%, intraassay CV < 6.1%. Plasma glucose concentrations were measured by the hexokinase method (Nichols Institute Diagnostics) with interassay and intraassay coefficients of variation both smaller than 4.2%.
Statistical analyses
Sample size was calculated for a paired 2-sided t test by using the free software R (version 2.15.0 [14]). Based on previous studies (3, 13), we assumed a value of 0.20 with an SD of 0.25 for the smallest difference in DIT to be detected, and a power of 0.8 for an α-error probability of .05. This calculation resulted in a minimum sample size of 14 participants.
Data are presented as mean values ± SEM. Because the participants stayed in the laboratory for 2 days in each condition, the values for both days were averaged in the respective condition. Statistical analysis by Superior Performing Software Systems 22.0 (SPSS, SPSS Inc) was based on analysis of variance for repeated measurements (ANOVA) including the factors calorie (high- vs low-calorie meals), daytime (breakfast vs dinner), and time (time points of data collection before and after each meal), as well as the interaction effects between these factors. The suitability of ANOVA was determined by Mauchly’s sphericity test. In the case of a violation of the sphericity conjecture, Greenhouse-Geisser correction was applied. P values for multiple comparisons were adjusted according to Bonferroni. For pairwise comparisons, a paired Student t test was used. A P value less than .05 was considered significant. Effect sizes for statistically significant differences are reported as Cohen’s d (d) for t tests or as partial eta squared () for ANOVA.
Results
Sleep monitoring
As determined by standard electroencephalography, there were no disturbances of sleep architecture that could have affected the study outcome. Total sleep time, wakefulness after sleep onset, rapid eye movement sleep, as well as slow-wave sleep duration did not differ between both conditions (P > .409 for all).
Indirect calorimetry—thermogenesis
Baseline measurements before breakfast and dinner did not reveal any differences in terms of REE between low- and high-calorie meal conditions (P > .725 for both, Fig. 2). As expected, there was an increase in REE on food intake (P < .001 for all, > 0.741 for all, time effect) and a decrease in REE within 3.5 hours after meal consumption (P < .020 for all, > 0.196 for all, time effect; Fig. 2). High-calorie food intake yielded higher postprandial REE values compared with low-calorie meals (P < .001, = 0.980, calorie effect, Fig. 2).
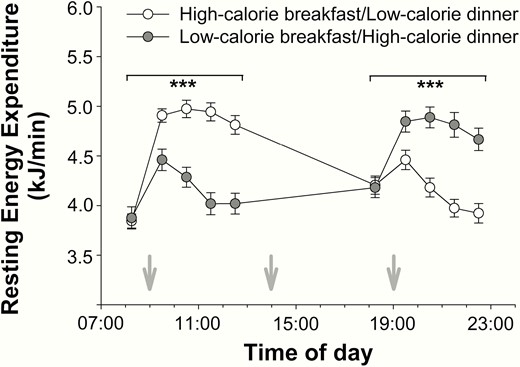
Effects of high- and low-calorie meal intake at breakfast and dinner on resting energy expenditure (mean ± SEM) in normal-weight men (n = 16). White circles: high-calorie breakfast combined with low-calorie dinner. Gray circles: low-calorie breakfast combined with high-calorie dinner. Gray arrows: start of food intake. ***P < .001.
To determine DIT, the difference between preprandial and postprandial REE was calculated. Average values of merged high- and low-calorie meals show that DIT after breakfast was generally 2.5 times higher than the average DIT after dinner (P < .001, = 0.833, daytime effect, Fig. 3A). When differentiating between high- and low-calorie meals, this daytime effect persisted under both conditions (P < .001 for both, > 0.696 for both, daytime effect for high- and low-calorie meals, respectively, P = .434 for the interaction effect daytime*calorie, Fig. 3B). Differential comparisons of each single time point of measurements revealed that DIT was generally higher in the morning than in the evening irrespective of the high- or low-calorie conditions (P < .001 for all t test comparisons, d > 1.548 for all, Fig. 3C and 3D) After the low-calorie dinner, DIT reached negative values because postmeal REE 2.5 and 3.5 hours after food intake was lower than preprandial REE (P < .001, d > 0.645, t test comparisons for both time points, Fig. 3D).
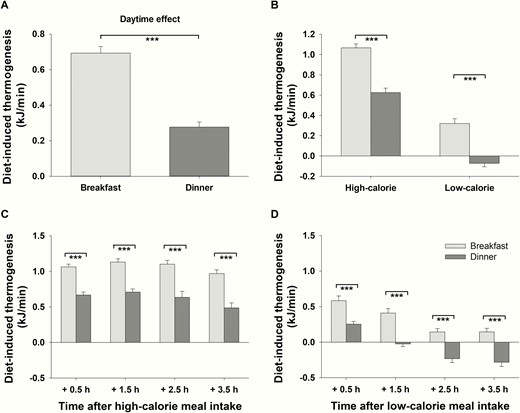
Diet-induced thermogenesis (DIT) (mean ± SEM) in normal-weight men (n = 16) after breakfast (light-gray bars) and dinner (dark-gray bars). A, Daytime effect: Average DIT (including all time points of measurement as well as high- and low-calorie meals) after breakfast vs average DIT (including all time points of measurement as well as high- and low-calorie meals) after dinner. B, Interaction effect daytime*calorie: Difference between average DIT (including all time points of measurement) after breakfast and dinner depending on the amount of calories consumed. C, DIT at single time points of measurement after high-calorie breakfast and dinner. D, DIT at single time points of measurement after low-calorie breakfast and dinner. ***P < .001.
Systemic glucose metabolism
Plasma glucose.
All baseline plasma glucose concentrations before breakfast and dinner were in accordance with fasting values (all < 5.08 mmol/l). On average, plasma glucose concentrations were lower after breakfast than after dinner when both caloric conditions were merged (P < .001, = 0.923, daytime effect, Fig. 4A). This time of day–dependent difference was more pronounced after high- compared with low-calorie meals (P < .001, = 0.799, interaction effect daytime*calorie, Fig. 4B). Glucose concentrations were 17% higher after low-calorie dinner compared with low-calorie breakfast (P < .001, = 0.875, daytime effect for low-calorie meals, Fig. 4B). In terms of high-calorie meals, this difference was 44% (P < .001, = 0.897, daytime effect for high-calorie meals, Fig. 4B). Separate analyses of single measurements revealed that plasma glucose concentrations were higher in the evening than in the morning at all time points after food intake both after high-calorie and after low-calorie meals (P < .001, d > 1.100, for all t test comparisons, Fig. 4C and 4D).
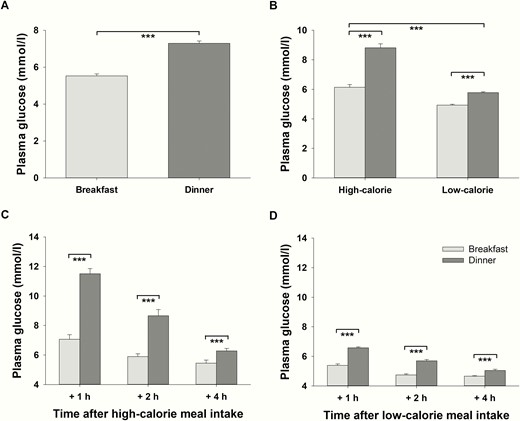
Postprandial plasma glucose concentrations (mean values ± SEM) in normal-weight men (n = 16) after breakfast (light-gray bars) and dinner (dark-gray bars). A, Daytime effect: Average plasma glucose concentrations (including all time points of measurement as well as high- and low-calorie meals) after breakfast vs. average plasma glucose concentrations (including all time points of measurement as well as high- and low-calorie meals) after dinner. B, Interaction effect daytime*calorie: Difference between average plasma glucose concentrations (including all time points of measurement) after breakfast and dinner depending on the amount of calories consumed. C, Plasma glucose concentrations at single time points of measurement after high-calorie breakfast and dinner. D, Plasma glucose concentrations at single time points of measurement after low-calorie breakfast and dinner. ***P < .001.
Serum insulin.
Fasting serum insulin concentrations did not show any significant differences between conditions before breakfast and dinner (P > .177, t tests). On average, serum insulin concentrations including all measurements were lower in the morning than in the evening (P < .001, = 0.559, daytime effect, Fig. 5A). The magnitude of this effect varied depending on the calorie content of the meals (P = .002, = 0.488, interaction effect daytime*calorie, Fig. 5B). After high-calorie dinner, average insulin concentrations were 40% higher compared with insulin concentrations after high-calorie breakfast (P = .001, = 0.525, daytime effect for high-calorie meals, Fig. 5B). After low-calorie meals, this difference in serum insulin concentrations between breakfast and dinner was also significant but only 15% (P = .023, = 0.299, daytime effect for low-calorie meals, Fig. 5B).
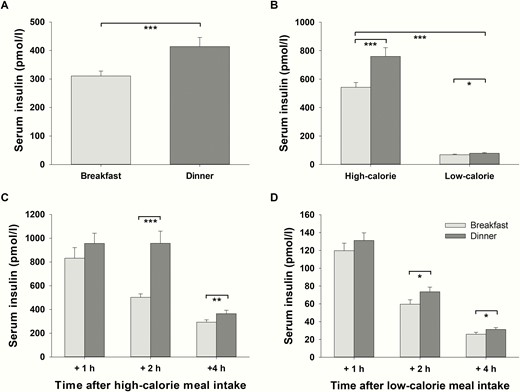
Postprandial serum insulin concentrations (mean values ± SEM) in normal-weight men (n = 16) after breakfast (light-gray bars) and dinner (dark-gray bars). A, Daytime effect: Average serum insulin concentrations (including all time points of measurement as well as high- and low-calorie meals) after breakfast vs average serum insulin concentrations (including all time points of measurement as well as high- and low-calorie meals) after dinner. B, Interaction effect daytime*calorie: The difference between average serum insulin concentrations (including all time points of measurement) after breakfast and dinner depending on the amount of calories consumed. C, Serum insulin concentrations at single time points of measurement after high-calorie breakfast and dinner. D, Serum insulin concentrations at single time points of measurement after low-calorie breakfast and dinner. *P < .05; **P < .01; ***P < .001.
Interestingly, serum insulin concentrations did not significantly differ immediately, that is after 1 hour, between breakfast and dinner in the high- (P = .140, t test, Fig. 5C) or in the low-calorie condition (P = .206, t test, Fig. 5D). However, lower values after breakfast compared with dinner were significant 2 and 4 hours after meals irrespective of the caloric content (P < .015, d > 0.641, for all t tests, Fig. 5C and 5D).
Hypothalamic–pituitary–adrenal axis activity
Baseline cortisol and ACTH concentrations did not differ between high- and low-calorie meals before breakfast or before dinner (cortisol: P > .708 for both, Fig. 6; ACTH: P > .883 for both).
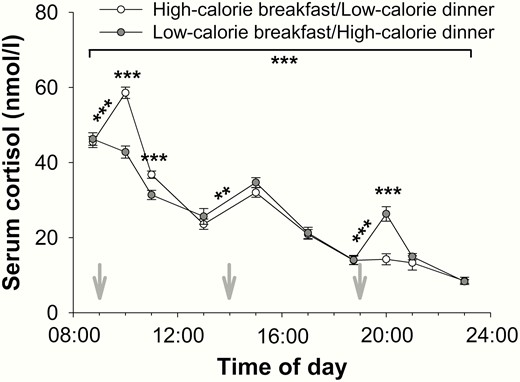
Effects of high- and low-calorie meal intake at breakfast and dinner on blood cortisol concentrations (mean values ± SEM) in normal-weight men (n = 16). White circles: high-calorie breakfast combined with low-calorie dinner. Gray circles: low-calorie breakfast combined with high-calorie dinner. Gray arrows: start of food intake. **P < .01; ***P < .001.
Owing to the known circadian variation, serum cortisol concentrations were generally higher in the morning than in the evening (P < .001, > 0.709, time effect for both, Fig. 6), irrespective of the calorie content of the meals (P = .360, interaction effect daytime*calorie). However, within the first hour after high-calorie meals, cortisol concentrations increased (P < .001, d > 1.335 for both, t tests, Fig. 6) and were higher compared with the corresponding cortisol concentrations after low-calorie meals (P < .001, d > 1.242 for both, t tests, Fig. 6). In contrast, cortisol concentrations remained stable within the first hour after low-calorie meals (P > .060 for both, t tests). In both conditions, there was a comparable increase in cortisol concentrations after lunch (P < .002, d > 0.914 for both, t tests, Fig. 6) with no differences between the conditions (P = .103, t test).
Similarly, average concentrations of ACTH were higher in the morning than in the evening (P < .001, > 0.484, time effect for both) independent of the calorie content of the meals (P = .471, interaction effect daytime*calorie). Within the first hour after breakfast, there was a decrease in ACTH concentrations in the low-calorie condition (P = .026, d = 0.753, t test), whereas ACTH concentrations remained at the same level in the high-calorie condition (P = .754, t test). In contrast, 1 hour after dinner, there was an increase in ACTH concentrations after the high-calorie dinner (P = .020, d = 0.650, t test) but no change in ACTH values after the low-calorie dinner (P = .517, t test).
Ratings of hunger and appetite
There were no differences in hunger ratings before high- and low-calorie breakfast (P = .378, t test, Fig. 7A). Average hunger was higher before dinner than before breakfast (P = .043, = 0.246, daytime effect before meals). In contrast, average postprandial hunger ratings showed that dinner had a generally more satiating effect than breakfast (P < .001, = 0.890, daytime effect after meals), which was independent of the calorie content of the meals (P = .850, interaction effect daytime*calorie, Fig. 7B). After high-calorie breakfast, hunger decreased (P = .007, d = 0.545, t test comparing hunger ratings before and 5 hours after high-calorie breakfast, Fig. 7A), whereas after low-calorie breakfast, hunger increased (P < .001, d = 0.783, t test, Fig. 7A). In the high-calorie breakfast condition, there was an increase in hunger ratings in the afternoon (P = .016, d = 0.502, t test comparing hunger ratings 5 hours after high-calorie breakfast and before low-calorie dinner, Fig. 7A). However, before dinner, hunger was higher in the low-calorie breakfast condition compared with the high-calorie one (P = .034, d = 0.421, t test, Fig. 7A). Both after high- and after low-calorie dinner, hunger decreased (P < .001, d > 1.152 for both; t tests comparing hunger ratings before and 4.5 hours after low- and after high-calorie dinner, respectively; Fig. 7A), with the high-calorie dinner having a more satiating effect than the low-calorie one (P < .001, = 0.705, for the interaction).
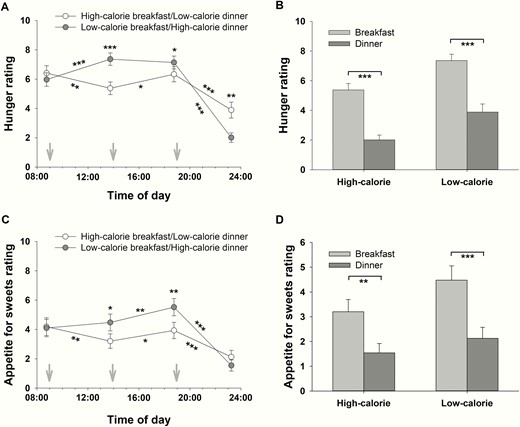
Hunger and appetite for sweets rating (mean ± SEM) on a visual analog scale (0: not at all hungry/no appetite for sweets at all; 10: very hungry/great appetite for sweets) by normal-weight men (n = 16). A, Effects of high- and low-calorie meal intake at breakfast and dinner on hunger rating. White circles: high-calorie breakfast combined with low-calorie dinner. Gray circles: low-calorie breakfast combined with high-calorie dinner. B, Interaction effect daytime*calorie: The difference between hunger rating 5 hours after breakfast and 4.5 hours after dinner depending on amount of calories consumed. C, Effects of high- and low-calorie meal intake at breakfast and dinner on appetite for sweets rating. White circles: high-calorie breakfast combined with low-calorie dinner. Gray circles: low-calorie breakfast combined with high-calorie dinner. D, Interaction effect daytime*calorie: The difference between the rating of appetite for sweets 5 hours after breakfast and 4.5 hours after dinner depending on amount of calories consumed. Gray arrows: start of food intake. *P < .05; **P < .01; ***P < .001.
Similarly, there were no differences in the ratings of appetite for sweets before high- and low-calorie breakfast (P = .844, t test, Fig. 7C). There was no daytime difference in the average rating of appetite for sweets before meals (P = .076, daytime effect before meals). However, average postprandial ratings of appetite for sweets were higher after breakfast than after dinner (P < .001, = 0.778, daytime effect after meals), which was independent of the calorie content of the meals (P = .362, interaction effect daytime*calorie, Fig. 7D). After the high-calorie breakfast, appetite for sweets decreased (P = .003, d = 0.447, t test comparing ratings of appetite for sweets before and 5 hours after high-calorie breakfast, Fig. 7C), whereas there was no change in the appetite for sweets after low-calorie breakfast (P = .337, t test, Fig. 7C). In both conditions, there was an increase in the appetite for sweets in the afternoon (P = .049, d = 0.348, high-calorie breakfast condition; P = .007, d = 0.447, low-calorie breakfast condition, t tests, Fig. 7C). Despite the isocaloric lunch, the appetite for sweets before dinner was significantly higher in the low-calorie breakfast condition compared with the high-calorie one (P = .002, d = 0.691, t test, Fig. 7C). In contrast, appetite for sweets decreased both after the high- and after the low-calorie dinner (P < .001, d > 0.894 for both; t tests, Fig. 7C).
Discussion
Our data show that the time of day of food intake makes a difference in humans’ energy expenditure and metabolic responses to meals. These in-laboratory standardized experiments, which eliminated the possible influence of sleep disturbances and carbohydrate preloads, support the thesis that in terms of DIT, breakfast has a more efficient energetic value for our body than dinner. Moreover, our study expanded this knowledge by the insight that diurnal variations in DIT persist on hypocaloric meals. Thereby, our findings may contribute to elucidate a research issue that has been intensely discussed for years.
We clearly show that DIT is 2.5 times higher after breakfast than after dinner. Looking at previous investigations, there are some studies that have addressed this issue; however, under partially deficient standardized experimental laboratory conditions. To minimize the number of possible factors influencing energy metabolism, it is important to monitor sleep because there is evidence that sleep deprivation suppresses the resting metabolic rate (15) and DIT (16). In addition, a standardized dinner in terms of nutrient composition, calorie amount, and timing preceding each experimental day is essential to exclude a bias on glucose tolerance in the following morning. In line with our findings, some previous studies found that DIT is lower in the evening than in the morning after identical meals (6, 9, 13). However, a significant influence of sleep disturbances and carbohydrate preload cannot be fully excluded in most of these investigations because these factors have not been considered as bias (6, 13). However, not all authors found a higher DIT after a morning meal (3, 5, 17). This contradiction may be explained by differing study approaches, for example, divergent time points of measurements (from 3 pm to 7 pm [3]), starving periods before measuring DIT due to missing lunch (3), examining an underweight study population (17), chronic illness of the individuals examined, or too-short measurement periods (5).
However, one main addition of this study was the preserved circadian rhythmicity in the human DIT after low-calorie meals, that is, meals with a hypocaloric content of only 1046 kJ also displayed more efficient energetic value for the human body in the morning than in the evening. Previous studies have investigated exclusively meals with a calorie content between 2276 kJ (13) and 4887 kJ (6). A comparative study between different levels of calorie content has not been performed so far. The insight that circadian rhythmicity is preserved on hypocaloric nutrition is important in terms of dieting for body weight loss. Our results indicate that the timing of food intake is also important for successful weight loss under conditions of caloric restriction.
However, the question arises as to which mechanisms may mediate this effect of reduced DIT in the evening. There are some approaches that refer to the 2 components of DIT: obligatory and facultative DIT (18). Obligatory DIT relates to the stimulation of energy-requiring processes during the postprandial period for the digestion, absorption, and processing of nutrients. A certain amount of energy gained from food is consumed for the intestinal absorption of nutrients, the initial steps of their metabolism, and the storage of the absorbed but not immediately oxidized nutrients because these processes require the hydrolysis of adenosine triphosphate (19). Because various functions of the gastrointestinal tract exhibit circadian activities (20), it seems likely that the obligatory component of the DIT is increased in the morning. Accordingly, one explanation for the higher rate of DIT in the morning may be rapid morning gastric emptying (21, 22). The absorption of macronutrients is also subject to circadian regulation (23), with evidence from rodent experiments for increased intestinal absorption of peptides (24), lipids (25), and carbohydrates (26-29) at the beginning of the active phase compared with the end of the active phase. However, whether these results are transferable to humans remains to be verified. In contrast to the obligatory component of DIT, facultative DIT is mainly stimulated by the sympathetic nervous system (18). This term was introduced by Acheson et al, who found that the thermic effects of intravenously infused glucose can be suppressed by β-adrenergic antagonists (18). It is conceivable that this component may be elevated in the morning because epinephrine, which increases the metabolic rate and the respiratory quotient (30), exhibits higher concentrations during this time of day (31). In this context, our data show a decrease in hypothalamus–pituitary–adrenal axis activity as reflected by circulating cortisol and ACTH concentrations from morning to evening, which is consistent with data in the literature (32).
With respect to a translational approach, the preserved food-induced circadian variation of the DIT under conditions of hypocaloric nutrition may be particularly meaningful. Our results show that a nutritional pattern with an extensive breakfast and few calories in the evening has a favorable effect on energy as well as glucose metabolism. Moreover, our results confirm that a large dinner has particularly negative effects on glucose tolerance, which should be considered by diabetic patients looking to avoid blood glucose peaks. However, to derive dietary recommendations from this, practical implementation should be followed. For example, this dietary pattern would be difficult to achieve if low-calorie dinners were associated with increased cravings in the evening. Therefore, we also evaluated the ratings for hunger and appetite for sweets throughout the day. Both the hunger ratings and that of appetite for sweets were greater in the first half of the day than in the second. In contrast, a previous study showed that hunger is lowest in the morning and highest in the evening, independent of the time since waking and the interval from that last meal, and independent of the calories consumed (33). However, these studies differ from ours with regard to the timing of the hunger ratings in the evening: Scheer and colleagues assessed evening feelings of hunger 10.50 and 12.33 hours after waking (33), whereas evening hunger in our study was assessed 11.75 and 16.25 hours after waking. The last rating of hunger and appetite for sweets in our study was therefore very late in the evening, just before the participants went to sleep. The lower ratings of hunger and appetite for sweets in the second half of the day in our study are therefore mainly because hunger and appetite for sweets are lowest in the late evening compared with all other time points of investigation throughout the day. Furthermore, we found that a high-calorie breakfast resulted in a reduction of hunger and appetite for sweets, whereas a low-calorie breakfast led even to an increase in hunger and a delayed increase in the ratings of appetite for sweets. This effect is supported by the results of Jakubowicz et al, who found that a high-calorie breakfast is associated with decreased hunger and increased satiety throughout the day (34). These results imply that a low-calorie breakfast increases the likelihood of snacking throughout the day, which is preserved even after lunch and lasts until dinner. It moreover seems reasonable to assume that people consume greater amounts of food at dinner due to higher hunger perception after low-calorie breakfast. We additionally found that specifically the appetite for sweets is significantly increased until dinner after a low-calorie breakfast, which suggests that the increased craving for snacks manifests itself in the higher consumption of sweets throughout the day. Interestingly, we did not observe this effect in the evening: Both the high-calorie and the low-calorie dinner resulted in a reduction of hunger and appetite for sweets. In this context, it has to be considered that the low-calorie dinner was preceded by a high-calorie breakfast, which could contribute to the satiating effect of the low-calorie dinner. To explain this, there is some evidence for possible mechanisms underlying the circadian rhythm of hunger and appetite. The complex system of appetite regulation is controlled within the hypothalamus, which receives input from peripheral signals (35). Some of these peripheral signals show diurnal variations with the highest levels in the evening (36-39) and could thus contribute to increased satiety in the evening.
However, the underlying mechanisms of appetite regulation, hypothalamus–pituitary–adrenal axis activity, glucose metabolism, and postprandial energy turnover cannot be identified by our study because of the human experimental approach. In addition, caution is required when attempting to draw conclusions from the results of this short-term study on potential long-term effects. Indeed, an intervention study showed that eating the greatest amount of calories for breakfast for 12 weeks has a beneficial effect on weight loss, glucose, and fat metabolism (34), which in turn supports our findings. As one limitation of our study, it should be mentioned that only men were included to avoid possible effects of the female hormone cycle on energy metabolism. Another limitation was the use of maltodextrin to adjust the calorie content of the meals, resulting in a disproportionate increase in the carbohydrate content of high-calorie meals. Diurnal variations depending on the calorie content, as we found in glucose metabolism, may therefore be more pronounced because of carbohydrate content rather than the calorie content of the meal itself.
Overall, the diurnal variations in DIT, independent of the calorie content of the meals, imply that the time of food intake is important not only in the prevention of obesity but also in terms of diets for weight loss. An extensive breakfast should therefore be preferred over large dinner meals to reduce the risk of metabolic diseases.
Abbreviations
- ACTH
adrenocorticotropin
- CV
coefficient of variation
- DIT
diet-induced thermogenesis
- REE
resting energy expenditure
- TEE
total energy expenditure
Acknowledgments
Financial Support: This work was supported by the German Research Foundation (SFB 654).
Clinical Trial Information: This trial was registered at DRKS as DRKS00009851 (www.drks.de).
Author Contributions: K.M.O. and N.H. designed the research. J.R., N.H., S.J., T.B., A. K., and K.M.O. conducted the research. J.R., N.H., and A.K. analyzed the data. J.R., N.H., S.J., T.B., A. K., and K.M.O. wrote the paper. J.R. and K.M.O. had primary responsibility for the final content.
Additional Information
Disclosure Summary: The authors have nothing to disclose.
Data Availability: The data sets generated during and/or analyzed during the present study are not publicly available but are available from the corresponding author on reasonable request.
References
