


Abstract
The contribution of insulin resistance vs adiposity to bone mineral density (BMD), bone turnover, and fractures in humans remains unclear.
To evaluate BMD and bone turnover markers (BTMs) in lean (n = 18) and overweight/obese individuals with (n = 17) and without (n = 34, insulin-sensitive [Obsensitive, n=15] or insulin-resistant [Obresistant, n=19] by homeostasis model assessment insulin resistance) diabetes mellitus.
Observational study.
Insulin sensitivity was assessed using the hyperinsulinemic-euglycemic clamp; whole body BMD and fat mass (FM) using dual energy X-ray absorptiometry; and by measurement of BTMs [osteocalcin (OC), procollagen type 1 N-terminal propeptide (P1NP), and collagen type 1 cross-linked C-terminal telopeptide (CTx)], with the patient fasting and during clamp hyperinsulinemia.
Fasting BTMs correlated with glucose infusion rate/fat-free mass (GIR/FFM) and adiponectin and, inversely, with fasting insulin and visceral fat (P ≤ 0.04 for all). Obsensitive, Obresistant, and diabetic individuals were matched by their FM percentage. Clamp GIR/FFM was similar in the lean and Obsensitive subjects (P = 1) and approximately twofold greater (P < 0.001) than in the Obresistant and diabetic subjects. BMD was greater in Obresistant than in Obsensitive (P = 0.04) and lean (P = 0.001) subjects. At baseline, compared with Obsensitive and lean subjects, Obresistant and diabetic individuals had lower OC, P1NP, and CTx levels. This reached statistical significance for Obresistant vs lean and Obresistant vs Obsensitive for both OC and CTx and for diabetic vs lean for CTx (P ≤ 0.04 for all). During hyperinsulinemia, lean individuals suppressed CTx more than did diabetic individuals (P = 0.03). On multiple regression analysis, visceral adiposity explained 16.7% and 19.3% of the baseline OC and CTx variability, respectively.
Increased visceral adiposity and higher fasting insulin in insulin-resistant states are associated with lower fasting OC and CTx and failure to further suppress with more insulin.
The association among obesity, type 2 diabetes, and osteoporosis is complex. Bone mineral density (BMD) is a strong predictor of fracture risk. A low body weight has been associated with low BMD (1) and a greater risk of fracture (2). Obesity has been associated with higher BMD (3–5).
Most patients with type 2 diabetes are overweight or obese. Hence, as predicted, type 2 diabetes is generally associated with higher BMD. Yet, paradoxically, both men (6) and women (7) with type 2 diabetes have a fracture risk that is greater than those without diabetes. The factors that might contribute to an increased fracture risk in patients with diabetes are insulin use (6), an increased risk of falls due to neuropathy and retinopathy (8), inflammation, glycation of collagen, use of peroxisome proliferator-activated receptor-γ agonists (8), and poor bone quality related to poor nutrition (8).
Because the fracture risk in diabetes does not appear to be related to lower BMD, it might occur at a cellular level. Bone is a dynamic tissue constantly undergoing homeostatic cycles of renewal and repair orchestrated by osteoclasts, osteoblasts, and osteocytes (9). Bone formation and resorption are usually tightly coupled, whereby osteoblasts synthesize fresh bone matrix that is subsequently mineralized in a highly coordinated process. Bone formation markers include procollagen type 1 N-terminal propeptide (P1NP), which is cleaved off the collagen tetramer at the end of its formation, and osteocalcin (OC). OC is also secreted by osteocytes, which are mature osteoblasts encased in mineralized bone (9). Bone resorption markers include cross-linked peptides released from the N- and C-terminal (CTx) of type 1 collagen (9).
Bone turnover markers (BTMs) have found to be lower in those with diabetes than in those without (7). They have been found to be lower still in those with type 2 diabetes who also have the metabolic syndrome and/or increased visceral adiposity (10). The effect might be modulated by sex (10). Bone turnover is also reportedly lower in those with type 1 diabetes who have a higher body mass index (BMI) compared with those with normal weight and type 1 diabetes (11). Importantly, low P1NP in nonobese individuals with type 2 diabetes was associated with a threefold increase in vertebral fracture and a twofold increase in the overall fracture rate compared with those without diabetes and high P1NP (7). In the same study, although those with diabetes had lower CTx levels than did those without overall, those with diabetes and high CTx levels had a 3.5-fold increase in total fracture rates. However, the increase in vertebral fracture failed to reach statistical significance compared with nondiabetic individuals with high CTx (7). The results from these studies suggest that diabetes per se and states of low bone turnover in diabetic patients might be associated with an increased fracture risk.
In humans, obesity itself is associated with suppression of bone turnover (12). Viljakainen et al. demonstrated that obese volunteers had 17% to 40% lower levels of BTMs than lean sex- and age-matched control volunteers, with less suppression after a 75-g oral glucose load (12). Because of the close association between obesity and insulin resistance, it is unclear whether increased adiposity, visceral or intra-abdominal adiposity, and/or insulin resistance or all these factors drive this finding. The effect of insulin resistance and intra-abdominal or visceral fat, a close correlate of insulin resistance, per se, on bone turnover was not reported in previous studies.
Up to 30% of obese people are insulin-sensitive [reviewed by Samocha-Bonet et al. (13)]. Studies of BTMs in obesity have not differentiated between insulin-resistant and insulin-sensitive individuals. Insulin-sensitive obese people have a lower risk of diabetes and cardiovascular disease (13) and might serve as a valuable model to study the effects of insulin resistance on BTMs, independent of obesity.
In the present report, we studied lean insulin-sensitive, overweight and obese insulin-sensitive (Obsensitive) and insulin-resistant (Obresistant) volunteers and subjects with type 2 diabetes mellitus, to determine whether insulin resistance and/or visceral adiposity alter the serum levels of OC, P1NP and CTx in humans, independent of obesity.
Methods
Participants
Volunteers responded to local advertisements. We screened 1032 individuals by telephone and, of these, 81 were included. The metabolic and muscle insulin signaling data have been previously reported (14).
The subject recruitment and screening methods have also been previously reported (14). In brief, those without known type 2 diabetes mellitus were screened according to BMI, homeostasis model assessment insulin resistance (HOMA-IR) (15), and a 75-g oral glucose tolerance test. The participants were classified into the following groups: lean insulin-sensitive controls (BMI ≤25 kg/m2, HOMA-IR <2.0, normal glucose tolerance, n = 19), Obsensitive (BMI >25 kg/m2, HOMA-IR <1.5, n = 15), Obresistant (BMI >25 kg/m2, HOMA-IR >3.0, n = 20), and those with type 2 diabetes (BMI >25 kg/m2, n = 17). The St Vincent’s Hospital Human Research Ethics Committee (Sydney, Australia) provided ethical approval, and all participants provided informed written consent.
Subjects taking bisphosphonates (n = 1) or hormone replacement therapy (n = 9), or both (n = 1), were excluded. BTM levels were not available for 1 other person, leaving 69 individuals who were included in the present study. Of the 69 participants, 4, 2, 3, and 1 pre- or perimenopausal woman were in the lean, Obsensitive, Obresistant, and type 2 diabetes groups, respectively. One person in each group was taking oral calcium (Obresistant) or cholecalciferol (Obsensitive and type 2 diabetes) supplementation, or both (lean). Volunteers with diabetes were not taking medication for diabetes, except for metformin or a sulfonylurea. Metformin was stopped 2 weeks before the study, and a sulfonylurea was added if the fasting glucose levels were consistently >7.0 mmol/L on finger prick testing (n = 2; ceased the day before the studies).
Hyperinsulinemic–euglycemic clamp
In the 48 hours before the study, the participants were asked not to exercise or consume alcohol. After an overnight fast, the participants underwent a 2.5-hour hyperinsulinemic (80 mU/m2/min)–euglycemic (5 mmol/L) clamp test. Insulin sensitivity was determined from the glucose infusion rate (GIR) during the last 30 minutes of the clamp normalized to the fat-free mass (FFM) as measured by dual energy X-ray absorptiometry (DXA) scanning.
Body fat and bone density determination
The participants underwent DXA scanning to calculate their total body and central fat, FFM, and BMD. They also underwent computed tomography at the T12–L1 level to determine the liver density (in Hounsfield units), as an indicator of liver fat (the Hounsfield units value is inversely proportional to the amount of liver fat), and computed tomography scanning at the L2-L3 and L4-L5 levels to determine the abdominal visceral and subcutaneous fat areas. The mean visceral fat areas at L2-L3 and L4-L5 and the mean subcutaneous fat areas at L2-L3 and L4-L5 were used in all the analyses.
Biochemical methods
Serum CTx, OC, and P1NP were measured using automated electrochemical luminescent immunoassays (Roche, Indianapolis, IN) in serum samples collected at the fasted and hyperinsulinemic states and were stored at −70°C. The serum CTx CrossLaps assay is a marker of bone resorption directed against the b-isomer of the cross-linked fragment C-terminal telopeptide of type I collagen [interassay coefficient of variation (CV) of 4.3%]. P1NP is directed against the amino-terminal propeptide of type I collagen cleaved by specific proteases before their incorporation into the bone matrix. It is a bone formation marker, and the assay is directed against the trimeric and monomeric degradation products that arise during this process and, thus, is a total P1NP assay (CV of 4%). Osteocalcin is a bone-specific vitamin K-dependent peptide rapidly cleaved in serum. This assay is a sandwich assay directed against epitopes on the N-terminal fragment and detects both intact and stable N-terminal fragments of the molecule (CV of 4%).
Statistical analysis
Data not normally distributed were log transformed. The data in the tables and text are reported as the mean ± SD and in the graphs as the mean ± SEM, unless stated otherwise. One-way analysis of variance (ANOVA) was used to compare the groups; post hoc comparisons were performed using the Tukey honestly significant difference test. Repeated measures ANOVA with Tukey post hoc tests were used to compare the response to hyperinsulinemia among the groups. Correlation analyses were performed using the Pearson correlation measure. Data not normally distributed were log transformed first. If data were missing (insulin measures at baseline and/or steady state for 4 subjects), the data sets were reduced. The minimum number of participants used for the individual pairwise correlation measures was 67 (fasting insulin measures were absent for 2 people). Stepwise multilinear regression was performed using a null initial model. Stepwise regression analysis was used to assess the contribution of continuous clinical and metabolic variables to baseline or the change in BTMs in response to insulin. Analyses were performed using SPSS, version 18.0 (SPSS Inc., Chicago, IL) and Prism, version 6 (GraphPad Software Inc., La Jolla, CA). Two-tailed P = 0.05 was considered statistically significant.
Results
Baseline characteristics
Sixty-nine volunteers were included in the present study (Fig. 1), and their baseline characteristics are presented in Table 1. The groups did not differ in age.
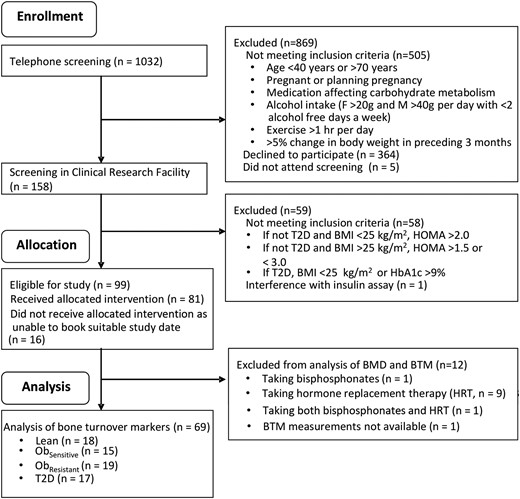
Recruitment, screening and inclusion of participants in the present study. F, female; HbA1c, hemoglobin A1c; M, male; T2D, type 2 diabetes mellitus.
Baseline Characteristics of Study Participants
| Characteristic | Lean | Overweight/Obese | P Value (One-Way ANOVA) | ||
|---|---|---|---|---|---|
| Insulin Sensitive (Obsensitive) | Insulin Resistant (Obresistant) | Type 2 Diabetes | |||
| Subjects (n) | 18 | 15 | 19 | 17 | NA |
| Female sex (n) | 10 | 10 | 7 | 8 | NA |
| Age (y) | 53.8 ± 8.1 | 58.8 ± 9.2 | 56.4 ± 8.4 | 61.1 ± 8.5 | NS |
| Weight (kg) | 63.7 ± 8.5 | 79.7 ± 15.3a,b | 101.6 ± 15.0a | 86.0 ± 15.8a,b | <0.0001 |
| Waist circumference (cm) | 80.8 ± 7.9 | 99.9 ± 12.3a,c | 111.2 ± 10.5a | 104.4 ± 11.0a | <0.0001 |
| BMI (kg/m2) | 21.8 ± 1.8 | 28.9 ± 3.4a,b | 34.3 ± 6.4a | 30.1 ± 3.3a,c | <0.0001 |
| FM (kg) | 16.2 ± 5.3 | 32.0 ± 10.3a,c | 41.3 ± 12.8a | 33.0 ± 7.2a,c | <0.0001 |
| FM (%) | 25.3 ± 7.7 | 40.0 ± 7.8a | 40.3 ± 9.5a | 38.6 ± 6.8a | <0.0001 |
| FFM (kg) | 47.5 ± 7.8 | 47.7 ± 10.8b | 60.3 ± 10.9a | 53.1 ± 12.8 | 0.0015 |
| FFM (%) | 74.7 ± 7.7 | 60.2 ± 9.5a | 59.7 ± 8.1a | 60.8 ± 7.6a | <0.0001 |
| Subcutaneous fat (cm2) | 109.3 ± 60.5 | 264.1 ± 99.7a | 328.6 ± 158.8a | 252.1 ± 78.8a | <0.0001 |
| Visceral fat (cm2) | 50.6 ± 24.7 | 124.2 ± 108.7a | 223.8 ± 67.6a | 164.1 ± 58.8a | <0.0001 |
| Liver density (HU) | 61.7 ± 4.5 | 59.1 ± 5.8 | 38.7 ± 15.4a | 41.2 ± 16.9a | 0.0001 |
| HOMA-IR | 1.16 ± 0.34 | 1.18 ± 0.34c | 4.34 ± 1.02a | 2.97 ± 0.60 | <0.0001 |
| GIR/FFM (µmol/min/kg FFM) | 88.5 ± 23.8 | 88.1 ± 35.8i | 57.8 ± 19.7a | 41.3 ± 11.4a,d | <0.0001 |
| Fasting blood glucose (mmol/L) | 4.6 ± 0.3 | 4.8 ± 0.4 | 5.3 ± 0.5 | 6.5 ± 1.3a,b,d | <0.0001 |
| Fasting serum insulin (mU/L) | 11.9 ± 2.7 | 12.0 ± 3.9b | 24.0 ± 8.4a | 23.7 ± 9.9a,d | <0.0001 |
| Steady state insulin (mU/L) | 270 ± 50.0 | 323.7 ± 105.5 | 332 ± 96.6 | 364.2 ± 119.3e | 0.050 |
| Fasting serum adiponectin (µg/mL) | 23.4 ± 13.6 | 22.4 ± 10.3 | 13.7 ± 7.7e | 12.2 ± 5.0a,f | 0.001 |
Abbreviations: HU, Hounsfield units; NA, not applicable; NS, not significant.
P ≤ 0.01 vs lean.
P ≤ 0.01 vs Obresistant.
P ≤ 0.05 vs Obresistant.
P ≤ 0.01 vs Obsensitive.
P ≤ 0.05 vs lean.
P ≤ 0.05 vs Obsensitive.
As previously reported (14), the three overweight groups, segregated by HOMA-IR and glycemic status after the 75-g oral glucose tolerance test (Obsensitive, Obresistant, and type 2 diabetes) did not differ from each other in terms of body fat mass (FM) or FFM composition. A fourth group of lean individuals had a statistically significantly lower FM percentage than all three overweight groups (Table 1). As previously reported (14), the Obsensitive group was as insulin sensitive as the lean group by both HOMA-IR and hyperinsulinemic-euglycemic clamp (Table 1). The mean fasting glucose levels did not differ between the Obsensitive and Obresistant groups (Table 1). However, the level was maintained by a statistically significantly greater fasting insulin level in the Obresistant group (Table 1).
Whole body BMD was substantially greater in the Obresistant and Obsensitive groups compared with the lean group [Fig. 2(a)]. When standardized against a young 20-year-old cohort (T-score), the same pattern remained [Fig. 2(b)]. When adjusted for age and weight (Z-score), the differences between the groups were eliminated [P = 0.80; Fig. 2(c)], owing to the strong relationship between BMD and FFM in kilograms (r = 0.72, P ≤ 0.0001). Although the T-scores are reported here, the World Health Organization osteoporosis criteria do not apply to whole body T-scores.
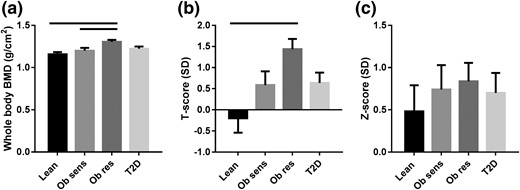
(a) Whole body BMD, as measured by DXA. (b) T-scores are BMD measurements standardized against a cohort of 20-year-old subjects and reported as standard deviations (SDs) from the 20-year-old mean. (c) Z-scores are BMD measurements adjusted for age and weight and reported as SDs from the mean of a cohort of age- and weight-matched individuals. Measurements were taken using a Lunar Prodigy machine. Solid bars above the graphs denote P < 0.05. T2D, type 2 diabetes.
At baseline, the Obsensitive and lean individuals had similar fasting levels for OC, CTx, and P1NP [Fig. 3(a–c)]. Compared with these two insulin-sensitive groups, the two insulin-resistant groups (Obresistant and type 2 diabetes) had lower OC, CTx, and P1NP levels [Fig. 3(a–c)]. This difference reached statistical significance for Obresistant vs lean for OC and CTx [P = 0.003 and P = 0.0008, one-way ANOVA, respectively; Fig. 3(a) and 3(b)], Obresistant vs Obsensitive for OC and CTx [P = 0.028 for both; Fig. 3(a) and 3(b)], and for type 2 diabetes vs lean for CTx [P = 0.037; Fig. 3(b)].
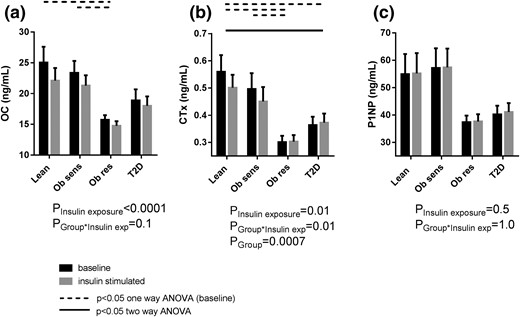
(a) OC, (b) CTx, and (c) P1NP at baseline and during clamp hyperinsulinemia. exp, exposure; T2D, type 2 diabetes.
The fasting concentrations of OC, CTx, and P1NP were inversely related to the fasting insulin levels (P ≤ 0.04 for all; data not shown) and glucose (P ≤ 0.05 for all; data not shown). Consistent with these data, OC, CTx, and P1NP correlated positively with GIR/FFM [P ≤ 0.02 for all; Fig. 4(a–c)] and adiponectin (P ≤ 0.03 for all; data not shown). All BTMs correlated negatively with the visceral fat area [P ≤ 0.2 for all; Fig. 4(d–f)], and OC and CTx correlated negatively with subcutaneous fat (P ≤ 0.02 for both; data not shown) and liver density (P ≤ 0.04 for both; data not shown).
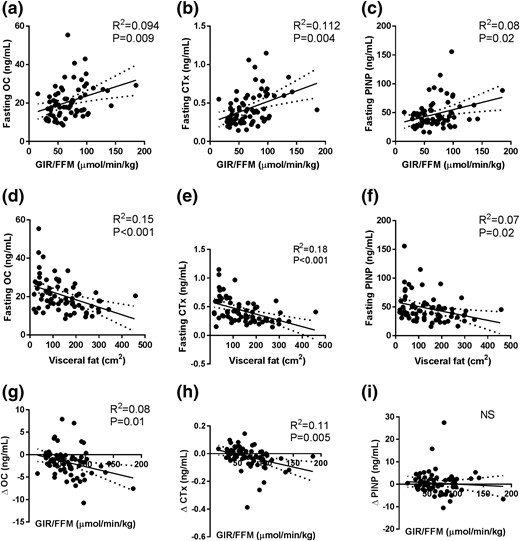
Correlations of GIR/FFM with (a) OC, (b) CTx, and (c) P1NP; visceral fat area with (d) OC, (e) CTx, and (f) P1NP; and GIR/FFM with change in (g) OC, (h) CTx, and (i) P1NP with clamp hyperinsulinemia. Linear regression, with R2 and P values reported.
During hyperinsulinemia, bone turnover was further suppressed in some, but not all, groups. Specifically, both the lean and Obsensitive groups exhibited a reduction in OC (−9% ± 16%, P = 0.003, and −5% ± 29%, P = 0.048, respectively) and CTx [−7% ± 18%, P = 0.053, and −8% ± 10%, P = 0.002, respectively; Fig. 3(a) and 3(b)]. The Obresistant and type 2 diabetes groups exhibited no substantial change in OC and CTx levels with insulin infusion [Fig. 3(a) and 3(b)]. On two-way ANOVA, the change in CTx with hyperinsulinemia was statistically significant (Pinteraction = 0.01), and post hoc analysis demonstrated a statistically significant difference between the type 2 diabetes and lean groups [Fig. 3(b)]. The P1NP levels did not change in any group with clamp hyperinsulinemia (Pinsulin exposure = 0.5). The change in CTx and OC, but not P1NP, with hyperinsulinemia correlated negatively with insulin sensitivity [P ≤ 0.01; Fig. 4(g–i)].
Multivariate regression
The contribution of fasting insulin levels and other variables to OC, CTx, and P1NP variance was tested using stepwise multiple linear regression models. The continuous variables selected were either statistically significant correlates of the BTM markers on univariate analysis or seemed biologically plausible. These were age, GIR/FFM, fasting glucose, insulin, and adiponectin levels, and visceral and subcutaneous fat areas. The fasting insulin level explained 9.4% of the variance in the fasting OC levels (P = 0.005), but it was not retained in the model when adiponectin and subcutaneous fat were entered (P = 0.005 and P = 0.29, respectively; Table 2). None of the variables were retained when visceral fat was entered (P = 0.3; Table 2).
Linear Regression Models to Explain the Variability in Baseline (Fasting) OC, CTx, and P1NP and Change in OC and CTx With Insulin Infusion
| Dependent Variable | Variables Entered and Retained in Model | Variables Entered and Not Retained in Model | ||||
|---|---|---|---|---|---|---|
| Variable | Adjusted R2 | Standardized Coefficient β | P Value | Variable | P Value | |
| Baseline OC | Fasting insulin | 0.094 | −0.326 | 0.005 | Age | 0.9 |
| Fasting glucose | 0.7 | |||||
| GIR/FFM | 0.8 | |||||
| Baseline OC | Adiponectin | 0.108 | 0.318 | 0.005 | Age | 1.0 |
| +SC fata | 0.156 | −0.247 | 0.029 | Fasting glucose | 0.9 | |
| GIR/FFM | 0.7 | |||||
| Fasting insulin | 0.7 | |||||
| Baseline OC | Visceral fatb | 0.167 | −0.423 | <0.001 | Age | 0.3 |
| SC fata | 0.3 | |||||
| GIR/FFM | 0.3 | |||||
| Fasting insulin | 0.3 | |||||
| Fasting glucose | 0.4 | |||||
| Fasting adiponectin | 0.1 | |||||
| Baseline CTx | Visceral fatb | 0.193 | −0.452 | <0.001 | Age | 0.15 |
| SC fata | 0.06 | |||||
| GIR/FFM | 0.3 | |||||
| Fasting insulin | 0.3 | |||||
| Fasting glucose | 0.4 | |||||
| Fasting adiponectin | 0.06 | |||||
| Baseline P1NP | Visceral fatb | 0.076 | −0.298 | 0.012 | Age | 0.7 |
| SC fata | 0.6 | |||||
| GIR/FFM | 0.2 | |||||
| Fasting insulin | 0.4 | |||||
| Fasting glucose | 0.2 | |||||
| Fasting adiponectin | 0.2 | |||||
| Change in OC with insulin stimulation | GIR/FFM | 0.071 | −0.290 | 0.014 | Age | 0.1 |
| SC fata | 0.3 | |||||
| Fasting insulin | 0.8 | |||||
| Fasting glucose | 0.5 | |||||
| Fasting adiponectin | 0.8 | |||||
| Visceral fatb | 0.8 | |||||
| Change in CTx with insulin stimulation | GIR/FFM | 0.101 | −0.337 | 0.004 | Age | 0.3 |
| SC fata | 0.2 | |||||
| Fasting insulin | 0.6 | |||||
| Fasting glucose | 0.2 | |||||
| Fasting adiponectin | 0.5 | |||||
| Visceral fatb | 0.4 | |||||
| Change in CTx with insulin stimulation | GIR/FFM | 0.101 | −0.327 | 0.004 | Age | 0.3 |
| +SC fata | 0.154 | 0.254 | 0.024 | Fasting insulin | 0.7 | |
| Fasting glucose | 0.5 | |||||
| Fasting adiponectin | 0.3 | |||||
| Visceral fatb | 0.8 | |||||
Abbreviations: β, β-estimate of linear regression model; R2, explained variance; SC, subcutaneous.
Subcutaneous fat area seen on computed tomography scan.
Visceral fat area seen on computed tomography scan.
On multivariate analysis, the visceral fat area explained 16.7%, 19.3%, and 7.6% of the baseline OC, CTx and P1NP levels, respectively (Table 2). Because waist circumference is a clinically accessible measure of visceral fat, the regression analysis was repeated with waist circumference in place of visceral fat area. In these analyses, 15.2%, 22.6%, and 6.7% of the baseline OC, CTx, and P1NP variability, respectively, were explained by the waist circumference (Supplemental Table 1).
The variability in the reduction in OC and CTx with clamp hyperinsulinemia was explained by the clamp insulin sensitivity (GIR/FFM explained 7.1% of the change in OC and 10.1% of the change in CTx) but not by any of the measures of adiposity. Subcutaneous fat explained a further 5.3% of the change in CTx (Table 2). P1NP did not change with clamp hyperinsulinemia and, thus, was not examined.
Discussion
Despite the increased bone density, diabetes is paradoxically associated with greater rates of fracture than those in nondiabetic individuals, in particular, cortical lower limb fracture (6). It is unclear whether this is a unique bony abnormality associated with hyperglycemia (i.e., a unique diabetic osteopathy), adiposity, or insulin resistance. The mechanism is unclear, but the pathogenesis must involve alterations in the relationship between osteoblasts and osteoclasts (i.e., bone remodeling) and, therefore, bone turnover.
To explore this paradox, we studied overweight and obese volunteers who were either insulin-resistant or insulin-sensitive and compared them with lean insulin-sensitive volunteers and volunteers with type 2 diabetes. We found that in insulin-resistant humans, bone turnover measured by OC, a marker of osteoblastic function, and CTx, a marker of osteoclastic function, were inversely related to visceral fat. Visceral adiposity or waist circumference explained 15% to 23% of the variation in baseline OC and CTx levels on multivariate analysis. The finding that fasting insulin levels were also inversely related to the OC and CTx levels and that fasting insulin was removed from the multivariate model when visceral fat or waist circumference were entered suggests that the effect of insulin on OC and CTx might be mediated, at least in part, by visceral fat.
One of the difficulties in navigating the available studies is that most have been cross-sectional and most have included mostly indirect markers that are collinear, including BMI, visceral adiposity, insulin resistance, and glucose and insulin levels. Despite this, published reports on those with diabetes, without diabetes, and those with the metabolic syndrome support our findings that insulin-related suppression of BTMs could explain the varied findings, because insulin levels would be expected to increase with insulin resistance, until the development of hyperglycemia, which is a marker of β-cell failure.
In a study of 1010 men aged 70 to 81 years, the OC levels were reported to be lower in the 153 men with diabetes than in those without (16). It correlated inversely with BMI in nondiabetic men (16), possibly because insulin levels would correlate with the BMI in this same cohort. In other studies of individuals with type 2 diabetes, undercarboxylated OC was found to correlate negatively with fasting glucose and FM and positively with adiponectin (17). Also, being in the lowest tertile of the OC level correlated with higher insulin levels on oral glucose testing (18). It is unclear which is the cause or effect in such situations. Although the investigators concluded that OC might be contributing to increased insulin secretion (18), we suggest that, in fact, the reverse could also be possible; that is, that the presence of higher insulin levels during a glucose tolerance test likely reflects a condition of chronic insulin resistance and concomitant hyperinsulinemia that might suppress OC levels. In type 1 diabetes, OC levels are inversely associated with both hemoglobin A1c and BMI (11).
In nondiabetic Spanish men, OC was associated with insulin sensitivity measured using the “minimal model.” Furthermore, OC increased with moderate weight loss (19). In another study of nondiabetic individuals, OC was inversely associated with fasting insulin levels and markers that segregate with insulin resistance (and therefore fasting insulin) (20). They also reported that higher OC levels were associated with smaller increases in fasting glucose during the 3-year prospective follow-up period (20).
Individuals with the metabolic syndrome have higher BMD and have been reported to have lower P1NP and CTx levels than their unaffected counterparts (21). The effect of the metabolic syndrome on BMD was not seen when adjusted for BMI, possibly because visceral adiposity and hyperinsulinemia correlate with the BMI. Although they report no increase in fracture risk, they were underpowered for this endpoint (n = 495 men and 1013 women) (21). Obese volunteers who had fasting insulin levels twice that of lean controls had BTM levels that were 17% to 40% lower than those of lean sex- and age-matched control volunteers (12).
In our study, OC and CTx were suppressed further with acute supraphysiological insulin exposure during a hyperinsulinemic clamp test in insulin-sensitive individuals, independent of FM. OC and CTx was not suppressed further in insulin-resistant individuals, suggesting that the concentrations were already maximally, or near maximally, suppressed in the resting or fasting state. On multivariate analysis, greater insulin sensitivity by clamp predicted for greater reductions in OC and CTx levels with hyperinsulinemia. Others have demonstrated similar, modest (approximately 10%) reductions in OC and CTx during a hyperinsulinemic-euglycemic clamp test (22).
In insulin-resistant states, the pathways controlling insulin-mediated glucose usage in skeletal muscle and adipose tissue are insulin resistant. However, as we have previously demonstrated, not all insulin-responsive pathways will be equally affected (14). Circulating insulin levels will be elevated in an attempt to maintain glucose homeostasis. This hyperinsulinemia will hyperstimulate the pathways that remain insulin sensitive. Thus, it is known that the SREBP1c pathway in hepatic de novo lipogenesis (23) and androstenedione production in ovarian theca cells (24) are affected. We propose yet another similarly affected pathway, namely suppression of OC production from osteoblasts. The most potent suppression of OC was in Obresistant patients. The effect of insulin resistance on OC was not as marked in patients with type 2 diabetes, suggesting that other factors, such as hyperglycemia, might also modulate this effect.
Because insulin receptors are present on osteoblasts (25, 26), we propose that the primary effect of visceral adiposity and hyperinsulinemia is on OC. The suppression of CTx levels in our study was likely secondary, because bone formation and resorption are tightly coupled. The lack of statistically significant differences in P1NP levels at baseline among the groups might relate to the relatively small sample size. The lack of changes in P1NP with a high-dose 2.5-hour insulin infusion most likely reflects that P1NP is cleaved from collagen at the end of an approximately month-long bone formation process (9) and might, therefore, not be altered within the short period of our intervention.
In mouse models, insulin resistance has been reported to reduce levels of undercarboxylated OC (26). This model has been extrapolated to suggest that undercarboxylated OC improves insulin secretion in mice (25). The hypothesis that OC might play a role in human glucose metabolism has not been discounted by the present study. If OC modulates insulin secretion, either directly or indirectly, via adiponectin, as has been suggested (25), a counterregulatory capacity for bone to remain sensitive to insulin in the presence of increasing insulin levels favors insulin homeostasis. Moreover, it would conform with current models of type 2 diabetes pathogenesis in which the primary causes are thought to originate in tissues other than bone.
However, analysis of the large osteoporosis interventional trials for alendronate, zoledronic acid, and denosumab have not found a change in fasting glucose levels or diabetes incidence, despite the expected decrease in bone turnover levels (27). More recently, a cohort study reported an initially increased (in the first 2.5 years) and then finally decreased risk of developing diabetes (16-year period) in 35,998 people given bisphosphonates compared with 126,459 people not given bisphosphonates (relative risk 0.52, 95% confidence interval 0.48 to 0.56) (28). The role of undercarboxylated OC in humans is unclear. It has been associated with a lower diabetes risk (along with OC, fasting P1NP, and CTx) (29) and myocardial infarction in older Australian men (30). This is consistent with our finding that a lower OC level is another surrogate marker for insulin resistance and higher baseline insulin levels.
The strengths of the present study included the careful metabolic and bone phenotyping of individuals and the inclusion of an overweight/obese insulin-sensitive group to segregate the effects of insulin resistance vs adiposity per se on BTM levels. The groups were matched for glycemia during steady state. Despite the vastly greater adiposity, the Obsensitive group was as insulin sensitive as the lean group by HOMA-IR and hyperinsulinemic-euglycemic clamp.
The present study had some limitations. Total bone density was measured; hence, data on regional bone density are lacking. Furthermore, we did not measure undercarboxylated OC. Other studies might have used other BTM assays; thus, the results might not be strictly comparable. Larger studies are necessary to discern differences between groups to explore the relatively attenuated effect of insulin resistance on BTMs in those with hyperglycemia (type 2 diabetes). Studies that maintain hyperinsulinemia for a longer period might result in larger changes in BTM levels or reveal changes in P1NP. Finally, our study did not measure other factors that might be altered by diabetes that could affect bone health (8). Our study relied on BTMs, which might not translate into fracture risk.
In conclusion, we have shown that BTMs are suppressed in insulin resistance, independent of obesity and FM. This association might be driven by visceral adiposity. Our findings have implications for diabetes treatment choice, because insulin (6, 31–35) and insulin secretagogues increase fracture risk. Sulphonylureas have been associated with lower bone turnover (36) and higher fracture rates in some, but not all, studies (36). In contrast, the insulin sensitizer, metformin, is associated with lower or neutral fracture risk (33–36). In the present study, those with diabetes were treated with metformin or a sulfonylurea, with metformin stopped 2 weeks before and sulfonylurea the day before, allowing these medications to wash out, minimizing their effect on bone turnover. The effect of the newer diabetes agents on bone remains uncertain. Dipeptidyl peptidase IV inhibitors are associated with a neutral fracture risk in mice (37). The long-acting glucagon-like peptide-1 agonist liraglutide has been reported to be associated with an increase in bone formation markers during weight loss (38). The sodium glucose cotransporter 2 inhibitor canagiflozin has been associated with increased BTMs (39) and increased fracture risk (40).
The implications of lower bone turnover in humans (implicated by the finding of lower fasting OC and CTx levels) are as yet uncertain. The direction of association between greater fasting insulin levels and increased visceral adiposity on fasting OC and CTx levels in humans is still a matter under investigation. We postulate that low bone turnover might be a marker for, if not the mechanism of, the unique bone biology and fracture phenotype found in type 2 diabetes and obesity when coupled with insulin resistance. Although obesity, or high FM and FFM, correlated with BMD, the fracture phenotype, or osteopathy, found in type 2 diabetes, might be a consequence of prolonged exposure to hyperinsulinemia (endogenous or exogenous) or other factors related to visceral fat, over and above any subsequent contribution from hyperglycemia. If the fracture syndrome is proved to be one of several nonmacrovascular complications associated with diabetes, further studies on the treatment of diabetes and bone fragility might need to consider the effects on insulin sensitivity, bone turnover, and fracture simultaneously.
Our data provide another framework for understanding diabetic osteopathy. They also suggest that BTMs might need to be used in conjunction with DXA and other markers of bone strength to predict the fracture risk in those with central adiposity and/or diabetes. In addition, we should be mindful of our medication choice in treating hyperglycemia in our patients with diabetes, in particular, if they have additional factors increasing their fracture risk. Further prospective studies of fracture and BTM in type 2 diabetes and obesity are required.
Abbreviations:
- ANOVA
analysis of variance
- BMD
bone mineral density
- BMI
body mass index
- BTM
bone turnover marker
- CTx
collagen type 1 cross-linked C-terminal telopeptide
- CV
coefficient of variation
- DXA
dual energy X-ray absorptiometry
- FFM
fat-free mass
- FM
fat mass
- GIR
glucose infusion rate
- HOMA-IR
homeostasis model assessment insulin resistance
- Obresistant
overweight/obese with insulin resistance
- Obsensitive
overweight/obese with insulin sensitivity
- OC
osteocalcin
- P1NP
procollagen type 1 N-terminal propeptide.
Acknowledgments
The authors thank Ms Stephanie Capdor who ran the bone turnover assays, the nurses of the Clinical Research Facility, including Srs Lynne Schofield, Jennifer Hanson, Ashleigh Douglas, and Renee Ritchens, all the volunteers who participated in the study, and Professor Donald J. Chisholm who provided advice and critical input.
Disclosure Summary: The authors have nothing to disclose.
References
Author notes
Address all correspondence and requests for reprints to: Katherine T. Tonks, MBBS, MPH, FRACP, PhD, Garvan Institute of Medical Research, Level 4, 384 Victoria Street, Darlinghurst, New South Wales 2010, Australia. E-mail: k.tonks@garvan.org.au.
