


Premenstrual syndrome (PMS) is characterized by distressing somatic and behavioral symptoms that develop after ovulation, reach a maximum during the premenstrual days, and disappear within 4 days after the onset of menstruation. Corpus luteum formation is necessary for the presence of symptoms, but the role of luteal hormones is unclear. The aim of this work was to investigate the relationship between sex hormone serum concentrations and premenstrual symptom severity in patients with PMS. Mental and physical symptoms were marked on a validated visual analog scale by 30 PMS patients every evening. Daily blood samples were taken in the luteal phase and in most of the follicular phase. Estradiol, progesterone, FSH, and LH were analyzed. Symptom severity was calculated as the number of negative symptoms expressed per day and as summarized scores of negative ratings. Based on premenstrual hormone concentrations and using the median split method, patients were divided into groups with high and low hormone levels. The pattern of expressed symptoms and summarized scores during the menstrual cycle was similar for the 2 groups. High concentration of luteal-phase estradiol and LH were related to the severity of negative premenstrual symptoms.
MENSTRUAL cycle-linked mood change, termed premenstrual syndrome (PMS), or premenstrual dysphoric disorder (1), is characterized by cyclic distressing somatic and behavioral symptoms related to the variation of ovarian hormones. About 30% of fertile women experience moderate-to-severe symptoms, and 10% want to have treatment for their PMS (2). The symptoms start shortly after ovulation and decrease in severity rapidly at the onset of the menstrual period (3). In anovulatory cycles, symptom cyclicity disappears, and there exists a cosensus that the cyclical changes are provoked by factors from the corpus luteum (4). The nature of the provoking factor, however, is unknown; but the ovarian steroids, 17 β-estradiol (E2) and progesterone (P), are suspected. In an attempt to elucidate this issue, patients with PMS were studied during two menstrual cycles. They showed more adverse premenstrual complaints in cycles with high E2 levels, compared with cycles with low values. In particular, a high luteal phase serum E2 concentration was correlated to more severe PMS-symptoms (5). In addition, E2 administered in the luteal phase resulted in a more severe negative mood, compared with placebo, indicating that E2 increases the severity of mood symptoms when given during the luteal phase (6). E2 alone, on the contrary, related to increased well-being (3). Therefore, it seems that E2 together with P elicits different effects than E2 alone. The ovarian steroids are known to have direct effects in the central nervous system (E2, on the Glutamate; and P metabolites, on the γ-aminobutyric acid-A receptors), as well as on protein synthesis via genomic action (7, 8). Consequently, it is reasonable to suspect that E2 and P may influence mood and mental symptoms. The aim of the present study was to investigate whether a hormone-symptom relationship exists between individuals, as was noted between cycles within individuals in an earlier study (5). As indicators of feedback activity and to elucidate the driving source for ovarian steroids, gonadotrophins also were investigated.
Subjects and Methods
Patients
Thirty patients, 37.8 yr old (range, 27–44 yr), were recruited among women seeking help for PMS at the gynecological outpatient department. All of them showed significant cyclical mood changes and fulfilled the criteria for premenstrual dysphoric disorder in the Diagnostic and Statistical Manual of Mental Disorders, Fourth Edition, DSM-IV (1, 9). They underwent 2 consecutive months of clinical evaluation by prospective daily rating of their symptoms, using a previously validated visual analogue scale (VAS) (10). All patients provided blood samples for hormone assays in, at least, one cycle on cycle days 1–4, and from cycle day 10 throughout the rest of the cycle. In patients who provided two cycles with blood samples, the first cycle was used in the present study. Twelve of the patients participated in the previous study comparing symptoms within individuals between cycles (5). None of the patients received any medication, and they were otherwise healthy. They completed a questionnaire concerning their previous mental and physical health, education, marital status, PMS history, and an Eysenck personality inventory (EPI) (11). All cycles studied were ovulatory, as defined by plasma P values above 15 nmol/L. The day of ovulation was determined as the day after LH surge. The study was approved by the Umeå University Ethics Committee, and informed consent was given by each participant.
Daily rating scale
Every evening, the women completed a previously validated VAS. In total, five negative mood symptoms (depression, anxiety, tension, fatigue, and irritability) and three somatic signs (breast tenderness, swelling, and headache) were rated, as well as the severity of menstrual bleeding (9). For each item, the patient marked, on a 10-cm-long scale (graded 0–10) the severity of a suffered symptom. Zero was defined as the complete absence of the symptom, and 10 as the maximal severity of symptom, as experienced by the patient in an ordinary menstrual cycle. The women were asked also to describe events during the day that might have influenced their mood and to record any medication taken.
Hormone analyses
Analyses of E2, P, FSH, and LH were performed on the serum samples by RIA (12). E2 was measured using an antiserum against an E2 17 β-3-oxime-BSA derivate (purchased from Miles-Yeda, Rehovot, Israel). The intra- and interassay coefficients of variation were 10% and 12%, respectively. For P assays, an antiserum against P 11α-succinyl BSA (Endocrine Science, Tarzana, CA) was used. The intra- and interassay coefficients of variation of P assay were 8% and 11%, respectively. FSH and LH were analyzed by double-antibody RIA (Farmos Diagnostica, Oulu, Finland). The standard for serum LH RIA was human pituitary LH, WHO 68/40; and for FSH, WHO 69/104. The intra- and interassay coefficients of variations were 8.7% and 8.7% for LH and 8.5% and 10.5% for FSH. All samples were analyzed in duplicate.
Data analysis
The mean values of E2, P, FSH, and LH during the last five days in the premenstrual phase were calculated per patient. Patients were ranked according to the mean serum concentration of the hormone in question. Thereafter, for each hormone, patients were divided into groups with high or low hormone levels, by using the median split method, and were identified in the following text as high- or low-hormone group, respectively. In one patient, FSH and LH were not analyzed, and she was excluded from the statistical evaluation.
The number of symptoms expressed per day and summarized symptom scores for negative mental and physical symptoms were calculated. The number of expressed symptoms per day can be compared between individuals, because the absence of a symptom is considered to be equal for each subject. It is problematic to compare VAS symptom scores between subjects, because the scores are subjectively defined, and therefore, the actual scores do not necessarily indicate the same severity between individuals. VAS scores, however, are frequently used as an absolute measure, even between individuals (13–15). Therefore, we give the summarized symptom score for the patient groups, as well. For each patient and day, the expressed symptoms were counted. The number of expressed mental symptoms per day can vary from 0–5, and expressed physical symptoms can vary from 0–3. A summarized symptom score was calculated by adding the symptom VAS scores for each patient and day. The summarized score for negative mental symptoms and physical symptoms can range from 0–50 and 0–30 per day, respectively. Differences in symptoms per day between high- and low-hormone groups were tested, using two-way ANOVA, over the last 10 premenstrual days, with the factors’ premenstrual days × hormone high or low group. Differences in mean hormone levels for the last 5 premenstrual days were tested using ANOVA. Preovulatory peak values of FSH and LH, as well as the results from the EPI, were tested using the Mann-Whitney U-test, because normal distribution was not assumed. A P-value < 0.05 was considered significant.
Results
Menstrual cycle-linked changes
Both the number of expressed symptoms per day and summarized symptom scores per day showed a similar pattern of change through the menstrual cycle. The symptom parameters showed decreased severity during the first 3 days of menstrual cycle and increased severity after ovulation, with a maximum during the last 5 premenstrual days (Fig. 1).
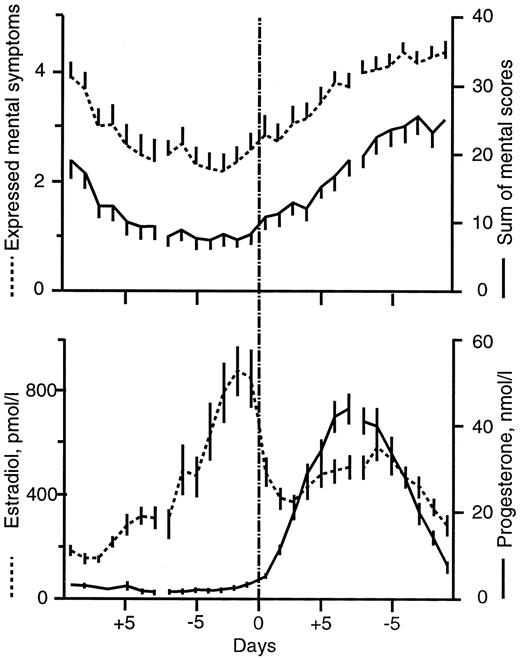
Expressed mental symptoms (dotted line) and summarized mental scores per day (solid line) for all patients during a menstrual cycle (upper graph). Daily serum concentrations of E2 (pmol/L) and P (nmol/L) for all patients during the menstrual cycle (lower figure). The data are centered around the day of ovulation and the day of onset of menstrual bleeding. Values are given as mean ± se.
Symptoms
The patients with high luteal phase-E2 concentration (high-E2 group) were compared with patients with lower luteal E2 (low-E2 group). More mental symptoms were expressed, and higher summarized mental symptom scores were found in the high-E2 group, compared with the low-E2 group (Fig. 2, Table 1). The three summarized physical symptoms were also higher in the high-E2 group (Table 1). Of the individual symptoms, anxiety, depression, tension, and fatigue were more often expressed in the high-E2 group, compared with the low-E2 group [F (1, 296–297) = 38.3–20.1, P < 0.001; data not shown]. The scores of all individual mental symptoms were higher in the high-E2 group[ F (1, 296–297) = 42.5–8.8; P < 0.001–0.005; data not shown].
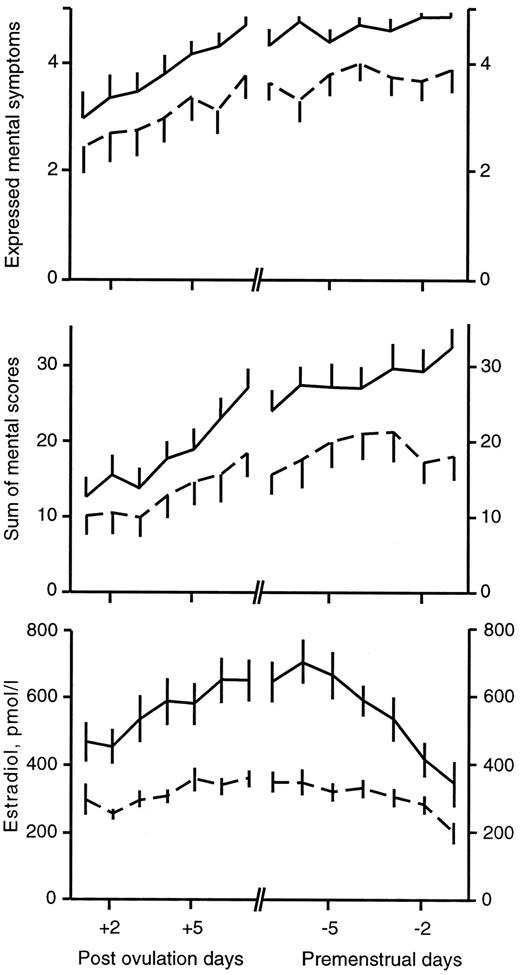
Expressed mental symptoms per day during the luteal phase (upper graph) and summarized mental symptom scores per day (middle figure), separated in groups with high (solid line) and low (dotted line) serum E2 concentrations. In the lower figure, the E2 concentrations (pmol/L) in the two groups are shown. The data are centered around the day of ovulation and the day of menstrual onset. Values are given as mean ± se.
Mean number of mental and somatic symptoms expressed per day and mean summarized symptom scores per day during 10 premenstrual days
| Estradiol groups | Progesterone groups | |||||
|---|---|---|---|---|---|---|
| Low levels mean ± se n = 15 | High levels mean ± se n = 15 | Significance1 F; p< | Low group mean ± se n = 15 | High group mean ± se n = 15 | Significance1 F; p< | |
| Five mental symptoms1 | ||||||
| Number expressed/day | 3.5 ± 0.12 | 4.5 ± 0.08 | 46.9; 0.001 | 4.0 ± 0.12 | 4.0 ± 0.10 | N.S. |
| Summarized symptom scores/day | 17 ± 1.0 | 25 ± 1.0 | 40.4; 0.001 | 23 ± 1.1 | 19 ± 1.0 | 5.87; 0.05 |
| Three somatic symptoms1 | ||||||
| Number expressed/day | 1.9 ± 0.1 | 1.8 ± 0.1 | N.S. | 1.9 ± 0.08 | 1.8 ± 0.08 | N.S. |
| Summarized symptom scores/day | 8.5 ± 0.5 | 10 ± 0.7 | 5.23; 0.023 | 10 ± 0.6 | 8.6 ± 0.6 | N.S. |
| Hormones1 | ||||||
| Estradiol pmol/L | 288 ± 14 | 508 ± 30 | — | 426 ± 33 | 390 ± 22 | N.S. |
| Progesterone nmol/L | 21 ± 1.8 | 20 ± 2.0 | N.S. | 13 ± 1.1 | 29 ± 2.3 | — |
| FSH IU/L | 6.2 ± 0.44 | 8.4 ± 0.4 | 14.7; 0.001 | 7.5 ± 0.4 | 7.7 ± 0.53 | N.S. |
| LH IU/L | 9.6 ± 1.2 | 13 ± 1.3 | 13.9; 0.001 | 12 ± 0.7 | 11 ± 0.7 | N.S. |
| FSH peak IU/L | 29 ± 5.5 | 36 ± 3.9 | N.S. | 38 ± 4.5 | 28 ± 4.3 | N.S. |
| LH peak IU/L | 75 ± 12 | 55 ± 6.7 | N.S. | 80 ± 10 | 50 ± 6.9 | 0.02 |
| Eysenck personality inventory1 | ||||||
| EPI-N score | 11.5 ± 1.3 | 13.5 ± 1.1 | N.S. | 12.9 ± 1.3 | 12.1 ± 1.2 | N.S. |
Patients are divided into groups with low or high mean estradiol and progesterone concentrations in the premenstrual phase. Shown are also the peak FSH and LH concentrations and the neuroticism score in Eysenck’s personality inventory.
Two-way ANOVA, over 10 premenstrual days (degrees of freedom, df = 1, 284–297); and over the last 5 premenstrual days (df = 1,108), were used to analyze the groups, regarding differences in symptomatology and hormone levels, respectively. Peak values of FSH and LH, and EPI-N scores were tested using the Mann-Whitney U test. N.S., Nonsignificant.
Among the individual physical symptoms, only breast-tenderness differed between the two groups, in expressed symptoms and symptom score [F (1, 297) = 11.8, P < 0.001; and F (1, 297) = 33.8, P < 0.001; data not shown].
In the high-P group, the summarized mental symptom scores per day were lower, compared with the low-P group (Table 1). However, the summarized somatic scores did not differ between the two groups. The individual and total number of expressed symptoms (mental or somatic) did not differ between the two groups. Of the individual mental symptoms, tension, anxious, and fatigue were lower in the high-P group [F (1, 296–297) = 6.6–7.18; P < 0.01–0.05; data not shown].
In the high-LH group, mental symptoms were more often expressed, and the summarized mental symptom scores were higher, compared with the low-LH group (Table 2). Among individual summarized symptoms, depression and anxiety were more pronounced in the high-LH group [F (1, 276–277) = 34.5–5.36; P < 0.001–0.05]. The low- and high-FSH groups did not differ in mean number of expressed (mental or somatic) symptoms. Summarized mental and physical symptom scores were not different between the groups (Table 2).
Mean number of mental and somatic symptoms expressed per day and mean summarized symptom scores per day during 10 premenstrual days, divided into groups with low or high mean FSH and mean LH concentrations in the premenstrual phase
| FSH groups | LH groups | |||||
|---|---|---|---|---|---|---|
| Low levels mean ± se n = 15 | High levels mean ± se n = 15 | Significance1 F; p< | Low group mean ± se n = 15 | High group mean ± se n = 15 | Significance1 F; p< | |
| Five mental symptoms1 | ||||||
| Number expressed/day | 3.9 ± 0.1 | 4.1 ± 0.1 | N.S. | 3.7 ± 0.1 | 4.2 ± 0.1 | 10.2; 0.001 |
| Summarized symptom scores/day | 20 ± 1.1 | 21 ± 1.0 | N.S. | 17 ± 1.0 | 24 ± 1.0 | 20.9; 0.001 |
| Three somatic symptoms1 | ||||||
| Number expressed/day | 2.0 ± 0.1 | 1.8 ± 0.1 | N.S. | 2.0 ± 0.1 | 1.8 ± 0.1 | N.S. |
| Summarized symptom scores/day | 10 ± 0.6 | 9.5 ± 0.6 | N.S. | 9.2 ± 0.6 | 10 ± 0.9 | N.S. |
| Hormones1 | ||||||
| Estradiol pmol/L | 356 ± 22 | 458 ± 33 | 8.48; 0.004 | 336 ± 19 | 479 ± 34 | 14.8; 0.001 |
| Progesterone nmol/L | 24.2 ± 2.45 | 17.3 ± 1.6 | 7.48; 0.007 | 18.8 ± 1.7 | 22.0 ± 2.2 | N.S. |
| FSH IU/L | 5.4 ± 0.3 | 9.1 ± 0.4 | — | 6.7 ± 0.4 | 8.2 ± 0.5 | 6.74; 0.01 |
| LH IU/L | 10.0 ± 0.7 | 13.0 ± 0.6 | 10.1; 0.002 | 9.1 ± 0.5 | 14.0 ± 0.7 | — |
| FSH peak IU/L | 25.5 ± 4.9 | 36.6 ± 4.2 | N.S. | 32.0 ± 4.4 | 32.0 ± 5.5 | N.S. |
| LH peak IU/L | 57.3 ± 11 | 69.0 ± 9.4 | N.S. | 70.6 ± 9.5 | 52.9 ± 9.7 | N.S. |
| Eysenck personality inventory1 | ||||||
| EPI-N score | 11.7 ± 1.1 | 12.6 ± 1.3 | N.S. | 12.2 ± 1.2 | 11.6 ± 1.1 | N.S. |
Shown are also the peak FSH and LH concentrations and the neuroticism score in Eysenck’s personality inventory.
Two-way ANOVA, over 10 premenstrual days (degrees of freedom, df = 1, 284–297); and over the last 5 premenstrual days (df = 1,108). Peak df (1,108) were used to analyze the groups, regarding differences in symptomatology and hormone levels. Peak values of FSH and LH and EPI-N scores were tested using the Mann-Whitney U test. N.S., Nonsignificant.
The neuroticism score in the EPI (EPI-N) was studied for each hormone group (Tables 11 and 22). No significant differences were seen, between high and low groups, for any of the hormones. The ages of the hormone groups were compared, and the mean age in the low-E2 group was 35 ± 1.5 (sem) yr vs. 37 ± 1.6 yr in the high group. The difference was not significant for any hormone.
Hormones
The high-E2 group had a higher level of LH and FSH during the late luteal phase, compared with the low-E2 group (Table 1). The low-P group had a higher preovulatory LH peak (Table 1). The levels of E2 and FSH were higher in the high-LH group (Table 2). The high-FSH group showed higher values for E2 and LH, but lower P, compared with the low-FSH group (Table 2).
Discussion
The main finding in this study was a relationship between high serum concentration of E2 during the luteal phase and more severe premenstrual mental symptoms. A similar relation was seen between high LH and symptom severity. However, P concentrations did not seem to be related to mood symptoms to the same degree. Thus, it seems that high E2 in the luteal phase is related to more severe suffering from negative mood symptoms, which is opposite to the follicular phase, where a high level of E2 is related to well-being (3). Consequently, it seems as if E2, together with P or some other factor from the corpus luteum, might have a different effect on mood than E2 by itself. The results of the present study are in line with earlier findings showing a relationship between luteal phase E2 concentration and symptom severity between cycles in the same individuals (5). The results are also in line, regarding the effect of E2 treatment of PMS patients during the luteal phase. PMS patients who were given E2 during the luteal phase had more negative symptoms than patients given placebo (6). On the other hand, E2 alone, as in hormone replacement therapy, is related to an increased well-being (16, 17). However, giving E2 and progestogen together gives rise to negative mood changes (16, 18). In addition, at postmenopausal replacement therapy, high serum E2 levels in combination with progestin give more negative mood symptoms than lower E2 levels combined with progestin (19).
More mental symptoms were seen in the high-LH group than in the low-LH group. This may be caused by the fact that the individuals are distributed similarly between the groups. The relation between high LH and symptoms, therefore, may be a confounder to the E2-symptom relation. No relation was, however, found between FSH levels and mental or physical symptoms. In line with an earlier report (5), the relation between serum P and symptoms was not as evident as for E2. Because symptoms are only present in cycles where a corpus luteum is developed (4, 20), a factor from the corpus luteum must be involved in provoking the symptoms. Moreover, cyclical mood changes develop when the progestogen is added to a sequential postmenopausal treatment (16, 18). On the other hand, P by it self, without the presence of estrogen, has not been shown to have a negative effect on the mood (21).
A high E2 concentration was related to high LH and FSH levels. High LH and E2 concentrations coincided, suggesting that LH regulated the E2 level and not the opposite. If the ovary were primarily driving the E2 production, one would have expected a low LH and FSH, because of negative feedback. Because the opposite was found, we suggest that the pituitary is producing more LH, which is stimulating the corpus luteum to produce more E2. An interesting observation is that women in the perimenopause have higher estrogen and LH secretion, compared with younger women, during the luteal phase. This supports our finding that it is possible to find situations where both LH and E2 are increased simultaneously (22). In this study, the mean age was 2 yr higher in the high-E2 group than in the low group, but the difference was not significant. Therefore, we believe that the difference in E2 and LH was not caused only by a difference in chronological age. Biological age might, however, be different. Age seems also to be of importance for symptom severity in PMS, because more sever symptoms are expressed with increasing age (2). The finding of a high LH, together with a high E2, in the more symptomatic patients suggests that the latter patients are less sensitive to E2-negative feedback. Interestingly, the more symptomatic PMS patients are also less sensitive to benzodiazepine and pregnanolone in a γ-aminobutyric acid-A receptor-linked central nervous system function (23, 24).
The Eysenck personality inventory was compared between the groups. There were no observed differences in the neuroticism score between groups, indicating that differences in personality could not explain their disparity of symptom severity.
To estimate the severity of subjective symptoms, the number of expressed symptoms per day and the summarized symptom score per day were calculated. The validity of symptom scores between individuals may be questioned, because no absolute reference value, except absence of symptoms, can be obtained. Only few attempts have been made in the literature to find methods with which to estimate the severity of PMS. Methods presented as a way to estimate severity have, in fact, often been methods to establish cyclicity (25). However, in one study, all scores for physical and behavioral symptoms were summarized to estimate the severity of PMS (26). This is similar to the way summarized scores are presented in this study, but we distinguish between mental and physical symptoms.
The International Headache Society has suggested a way of estimating the severity of headache, in which patients are asked to keep a diary regarding the presence or absence of headache symptoms. The number of days with headache during a certain time period is then used to classify the severity of symptoms. The higher number of days with headache, the more severe is the condition (27). Because PMS is also a subjective syndrome, this may be a way to measure its severity. To count the number of days with or without symptoms, during a premenstrual period, would give a figure that is comparable between patients, and this is used in the present study. Severino and co-workers assessed significant cyclicity by using spectral density analysis. To grade the severity, they counted, for each patient, the number of symptoms with significant premenstrual spectral density. A higher number of significantly expressed symptoms was considered to indicate a more severe PMS (28). A combination of these two methods is to count the number of symptoms expressed per day during a certain time period (29), which was done in this study, over a time period of 10 premenstrual days. Both methods gave very similar results, as shown in Fig. 1.
In conclusion, high levels of E2 and LH in the luteal phase seem to be related to more severe symptoms in patients with PMS. Intervention studies will be needed to show weather there is a causal relationship between high E2 and P, on one hand, and more severe PMS symptoms, on the other. The higher levels of E2 may be caused by increased LH stimulation of the corpus luteum.
Mrs. A. Andersson is acknowledged for her skillful technical assistance. The authors thank Erik Lissbrant for scrutinizing the English.
This work was supported by the Swedish Medical Research Council (Project 4x-11198), Samverkansnämden “Visare Norr” and Umeå University foundations.
Bäckström T.
Bäckström T.
Aitken RCB.
International Headache Society.
