


Abstract
Severe injury or trauma is accompanied by both hypercortisolemia and prolonged inactivity or bed rest (BR). Trauma and BR alone each result in a loss of muscle nitrogen, albeit through different metabolic alterations. Although BR alone can result in a 2–3% loss of lean body mass, the effects of severe trauma can be 2- to 3-fold greater. We investigated the combined effects of hypercortisolemia and prolonged inactivity on muscle protein metabolism in healthy volunteers. Six males were studied before and after 14 days of strict BR using a model based on arteriovenous sampling and muscle biopsy. Fractional synthesis and breakdown rates of skeletal muscle protein were also directly calculated. Each assessment of protein metabolism was conducted during a 12-h infusion of hydrocortisone sodium succinate (120 μg/kg·h), resulting in blood cortisol concentrations that mimic severe injury (≈31 μg/dL). After 14 days of strict BR, hypercortisolemia increased phenylalanine efflux from muscle by 3-fold (P < 0.05). The augmented negative amino acid balance was the result of an increased muscle protein breakdown (P < 0.05) without a concomitant change in muscle protein synthesis. Muscle efflux of glutamine and alanine increased significantly after bed rest due to a significant increase in de novo synthesis (P < 0.05). Thus, inactivity sensitizes skeletal muscle to the catabolic effects of hypercortisolemia. Furthermore, these effects on healthy volunteers are analogous to those seen after severe injury.
SEVERE INJURY OR TRAUMA leads to a dramatic loss of body nitrogen. This loss of nitrogen is derived in great part from the oxidation of amino acids originating from skeletal muscle. In severe injury, such as burns, skeletal muscle proteolysis far exceeds synthesis, even during feeding (1, 2). This leads to a net breakdown of skeletal muscle and a prolonged efflux of amino acids from skeletal muscle (2, 3).
A traumatic insult is also associated with increased cortisol secretion (4). The increase in blood cortisol concentrations correlates with the severity of the injury (4) and often persists for weeks after injury (4, 5). Although trauma is accompanied by increased circulating concentrations of glucagon and catecholamines (6), the loss of muscle nitrogen is likely due primarily to the effects of cortisol (7). The effects of cortisol on skeletal muscle are to increase net protein breakdown (8–10) and efflux of amino acids (8, 10).
Severe injury most often entails prolonged periods of inactivity or bed rest (BR). Inactivity alone in healthy volunteers has been shown to result in a loss of body nitrogen (11, 12) and lean body mass (11–14). We have previously noted that the loss of lean body mass with BR is due to a decrease in skeletal muscle protein synthesis, while muscle protein breakdown remains unchanged (11). Despite a difference in the underlying mechanisms for loss of muscle nitrogen between severe injury and inactivity alone, the net effect is a loss of lean body mass. However, the accompanying hormonal environment is quite different. Whereas BR does not alter anabolic or catabolic hormonal profiles (11), the same is not true of trauma or surgery. In the case of trauma or postsurgical intervention (15), recovery is associated with both hypercortisolemia and periods of inactivity. Although it has been hypothesized that the effects of BR on muscle protein are of minor impact during severe stress (16), a clinical interaction is thought to exist. For this reason, conventional postsurgical treatment dictates a prompt return to an ambulatory state to enhance the healing process. However, it is unclear the extent to which the BR component contributes to the response of skeletal muscle in patients after surgery or trauma who are hypercortisolemic. Therefore, we have investigated the hypothesis that BR amplifies the normal catabolic effect of hypercortisolemia. To this end, we studied the effects of a cortisol challenge on six normal volunteers before and after 14 days of strict BR.
Methods
Subjects
Six healthy males [26 ± 6 (sd) yr; 76 ± 6 kg; 179 ± 5 cm] were studied before and after 14 days of BR. Written consent was obtained on all subjects, and the protocol was approved by the Institutional Review Board at the University of Texas Medical Branch.
Experimental Protocols
This study involved a 20-day stay at the General Clinical Research Center (GCRC) at University of Texas Medical Branch. The first 5 days served as a diet stabilization period before 14 days of strict BR. Subjects were not permitted to deviate from BR and were continuously monitored by the GCRC staff. Excretory and hygiene functions were accomplished while strict BR was maintained. Subjects were not permitted to sit up at any time, and eating was accomplished by elevating and supporting the head with one arm. Subjects were fed a mixed diet based on the Harris-Benedict equation and designed to maintain body weight throughout the study. The energy intake was adjusted during BR to account for the reduced activity and energy expenditure. The energy distribution of the diet was approximately 14% protein, 27% fat, and 59% carbohydrate, with protein intake standardized at 1.5 g/kg·day. Care was taken to insure that the study diets were very similar to the subject’s normal diet, as ascertained by GCRC dietitian interview. Meal patterns were very similar between subjects with some accommodation of individual aversions. During the 5-day diet stabilization period and the day after BR, body mass was determined by dual energy x-ray absorptiometry (DEXA; Hologic QDR-1000; Hologic, Waltham, MA) with regional analysis (Specialized Region of Interest Software; Hologic).
Isotope Infusions
The day before BR, subjects were fasted after dinner (approximately 1800 h) until the end of the study at 1200 h the following day. A 20-gauge polyethylene catheter was inserted into an antecubital vein at approximately 2300 h. Just before 2400 h, baseline blood samples were obtained for measurement of background amino acid enrichment, indocyanine green concentration, plasma glucose, and serum cortisol concentrations. A systemic infusion of hydrocortisone sodium succinate (Solu-Cortef; Upjohn, Kalamazoo, MI) at 120 μg/kg·h was started at 2400 h (Fig. 1) and maintained throughout the study. At 0500 h, a blood sample was obtained for glucose and cortisol concentrations, and a primed (63 μmol/kg) constant (0.35μ mol/kg·min) infusion of L-[5-15N] glutamine was given. At 0700 h, blood was again sampled for glucose and cortisol concentration, and three additional tracers were started at the following priming dose (PD) and infusion rates (IR): L-[ring-2H5]phenylalanine, IR = 0.05μ mol/kg·min, PD = 2 μmol/kg; L-[1-13C]alanine, IR = 0.35 μmol/kg·min, PD = 35 μmol/kg, and L-[2H3]ketoisocaproic acid, IR = 0.1μ mol/kg·min, PD = 4.8 μmol/kg. All isotopes were purchased from Cambridge Isotope Laboratories (Andover, MA).
![Isotope infusion protocol. ring-d5-PHE, L-[ring-2H5]phenylalanine; d3-KIC, L-[2H3]ketoisocaproic acid; 1-13C-ALA, L-[1-13C]alanine; amide 15N-GLN, L-[5-15N]glutamine, 15N-PHE, L-[15N]phenylalanine.](https://oup.silverchair-cdn.com/oup/backfile/Content_public/Journal/jcem/84/10/10.1210_jcem.84.10.6046/3/m_eg1096046001.jpeg?Expires=1716400138&Signature=e-ry5147Ac2MHkWl6aDPBhryrXzb-jQweX3BIqrZ4N6hs53dMa3Xq3YGv-~m9I~Oa67QsAyoeH7Yhd4-WAikypR6gC2tnopVmYqBUIEcp6fP7D18kJ9s68MUDe-rmbnlsraauF0SMMhgatF7AFbOl6fDNi-bPiMOQ4jL3daG14aOAvy0mSYxJ8RF7e1TjhChkp95R3afQo2jVqAkuKm4GVg5nypXYtkoK4b155FOQEc37~SZt1rr-yK99qWiS7qpTkOlZ-~geyO3PGow54MBEljY~UYvE94w-P18RJvK1o5~scT0~s4fgLG4o~ADJYuhAFWvulPHEto7ixYuwZk6dw__&Key-Pair-Id=APKAIE5G5CRDK6RD3PGA)
Isotope infusion protocol. ring-d5-PHE, L-[ring-2H5]phenylalanine; d3-KIC, L-[2H3]ketoisocaproic acid; 1-13C-ALA, L-[1-13C]alanine; amide 15N-GLN, L-[5-15N]glutamine, 15N-PHE, L-[15N]phenylalanine.
After isotope infusions were started at 0700 h, a 3-Fr, 8-cm polyethylene catheter (Cook, Inc., Bloomington, IN) was inserted into the femoral vein and femoral artery under local anesthesia. Both femoral catheters were used for blood sampling, whereas the femoral arterial catheter was also used for indocyanine green infusion for the determination of leg blood flow (BF). A second 20-gauge polyethylene catheter was placed in the contralateral wrist or forearm and surrounded by a heating pad maintained at ∼65°C for measurement of systemic concentration of indocyanine green.
At 0900 h, a biopsy of the vastus lateralis was performed as described previously (17). Immediately after the biopsy, a primed (2μ mol/kg) continuous (0.05 μmol/kg·min) infusion of L-[15N]phenylalanine was initiated and maintained until 1100 h. The arterial and intracellular L-[15N]phenylalanine enrichments at plateau and during the decay were used to determine the fractional breakdown rate (FBR). At 1100 h, blood was obtained for glucose and cortisol concentrations and amino acid enrichments, and the L-[15N]phenylalanine was then discontinued. Additional biopsies of the vastus lateralis were taken at 1130 and 1200 h.
Arteriovenous blood samples were drawn at 20-min intervals throughout the last hour (1100 to 1200 h) to determine amino acid kinetics. In addition, leg BF was determined by indocyanine green infusion during this hour. To measure leg BF, a continuous infusion (IR = 0.5 mg/min) of indocyanine green was started 15 min before the kinetic hour. Subsequent sampling was performed simultaneously from the femoral vein and the heated wrist over this hour. Arterial samples for amino acid kinetics were always taken after those from the femoral vein and wrist to avoid interference with BF measurement. After each sampling, indocyanine green infusion was uninterrupted for at least 10–15 min before the next BF measurement.
At the conclusion of the isotope infusion study, the subjects were fed and remained in bed for the next 14 days. At 2400 h on day 13 of BR, the above protocol was repeated. When the study was concluded on day 14, subjects were again fed but allowed to ambulate. Subjects remained at the GCRC until the following day for the post-BR DEXA, then discharged.
Analysis of Samples
Blood. The concentrations of unlabeled phenylalanine, glutamine, and alanine, as well as the enrichment of their isotopic counterparts, were simultaneously determined by gas chromatography-mass spectrometry in blood using the internal standard approach (17). Whole blood samples from the femoral vein and artery were immediately precipitated in preweighed tubes containing 15% sulfosalicylic acid. A known internal standard mixture (100 μl/mL blood) was added to the tube and thoroughly mixed. The composition of the internal standard was: 49.4 μmol/L L-[ring-13C6]phenylalanine, 330.7 μmol/L L-[2H4]alanine, and 562.6 μmol/L L-[13C5]glutamine. The tubes were reweighed for determination of blood volume, centrifuged, and the supernatant was removed and frozen at −80°C until analysis. On thawing, 500 μl of the sulfosalicylic extract was passed over a cation exchange column (Dowex AG 50W-8X, 100–200 mesh H+ form; Bio-Rad Laboratories, Richmond, CA) and dried under vacuum using a Speed Vac (Savant Instruments, Farmingdale, NY). To determine the enrichments of the infused tracers and internal standards, the tert-butyldimethylsilyl derivative was prepared as described previously (11). The isotopic enrichment of free amino acids in blood were determined on an HP Model 5989 gas chromatography-mass spectrometry (Hewlett-Packard Co., Palo Alto, CA) by electron impact ionization and selected ion monitoring (18). Data were expressed as tracer to tracee ratio, with correction for overestimation of enrichment (skew) due to isotopomer distribution and for“ overlapping” contribution of isotopomers of small weight to the apparent enrichment of isotopomers of greater mass (18).
Blood glucose was determined on a YSI 2300 Stat (Yellow Springs Instruments, Yellow Springs, OH) glucose analyzer after collection into tubes containing glycolytic inhibitors. Measures for each time point were done in duplicate and averaged.
Serum cortisol concentration was determined by commercial radioimmunoassay (DPC, Los Angeles, CA). All samples were analyzed with one respective assay with an intra-assay coefficient of variation of 3.4%.
Muscle. Tissue biopsies of the vastus lateralis were immediately blotted and frozen in liquid nitrogen. Samples were then stored at −80°C until processed. On thawing, the tissue was weighed and protein was precipitated with 0.5 ml of 10% perchloroacetic acid. To simultaneously determine the intracellular concentrations of certain amino acids, an internal standard containing 2.6 μmol/L L-[ring-13C6]phenylalanine, 5.7 μmol/L of L-[2H4]lysine, 5.8 μmol/L L-[13C6]leucine, and 730.8 μmol/L L-[13C5]glutamine was added (2 μl/mg wet tissue) and thoroughly mixed. The tissue was then homogenized and centrifuged, and the supernatant was collected. This procedure was repeated two more times, and the pooled supernatant (∼1.5 ml) was processed as the blood samples described in Blood. To determine intracellular enrichment of infused tracers, the tert-butyldimethylsilyl derivative was prepared as described above. Intracellular enrichment was determined by correction for extracellular fluid based on the chloride method (19).
The remaining pellet was processed, and the protein bound L-[ring-2H5]phenylalanine and L-[2H3]leucine enrichments were determined using chemical impact ionization with methane gas, as described previously (20). The ions monitored for L-[ring-2H5]phenylalanine were m/z 407 and 409 and for L-[2H3]leucine m/z 202 and 203. These ions are the m + 3 and m + 5 and m + 3 and m + 2 enrichments for phenylalanine and leucine, respectively, where m + 0 is the lowest molecular weight of the ion. These ratios were used because they are more sensitive than using the traditional m + 5/m + 0 (used for plasma phenylalanine samples). Enrichments from the protein-bound samples were determined using a linear standard curve of known m + 5/m + 3 or m+ 3/m + 2 ratios and correcting back to the absolute change in m + 5/m + 3 enrichments over the incorporation period. The m + 3 leucine is analyzed because[ 2H3]ketoisocaproic acid (m + 3) is transaminated in muscle to form leucine, which in turn is incorporated into tissue protein.
Calculations
Data Presentation and Statistical Analysis
Data are presented as means ± sem. Pre- and post-bed rest studies were compared by paired t test with Bonferroni correction (Family error rate). A P value is presented where appropriate and considered significant when <0.05.
Results
Subjects demonstrated a significant loss of total leg lean mass (0.51 ± 0.23 kg; P = 0.04) after 14 days of inactivity, whereas total LBM and total body mass were unchanged. This DEXA-determined loss of leg LBM is very similar to our previous findings during 14 days of inactivity (11).
Cortisol infusion resulted in an 8-fold increase (P = 0.0001) in blood cortisol concentrations that was maintained throughout the isotope infusion study (Fig. 2). Concomitant plasma glucose increased significantly over background values (P = 0.02), but remained within normal fasting values throughout the entire study (Fig. 2).
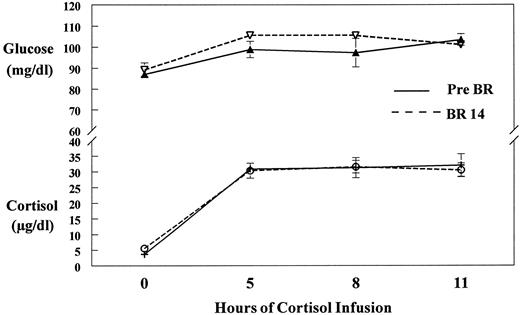
Glucose and cortisol concentrations. Plasma glucose and cortisol concentrations at the beginning (0), 5, 8, and 11 h after cortisol infusion before (Pre BR) and after (BR 14) 14 days of bed rest. Glucose (P = 0.02) and cortisol (P = 0.0001) increased significantly above 0 values to a plateau. Glucose remained within normal fasting values (60–110 mg/dl) throughout the study.
FSR as calculated by bound L-[ring-2H5]phenylalanine tracer in the hypercortisolemic state was not different after 14 days of inactivity, compared with baseline values (1.63 ± 0.04%/day pre-BR vs. 1.61 ± 0.04%/day for BR 14). In accordance with these findings, FSR calculated by bound[ 2H3]KIC tracer was also unchanged (0.74± 0.10%/day pre-BR vs. 0.77 ± 0.13%/day for BR 14). The apparently lower FSR calculated from the KIC tracer is due to the use of a higher arterial leucine precursor enrichment (than intracellular phenylalanine enrichment) in the calculation, which results in a lower FSR value (Equation IX), as described previously in our laboratory (24). However, the salient issue is that each measure demonstrates that there was no change in FSR after bed rest. FBR increased significantly (2.17 ± 0.03%/day pre-BR vs. 2.59 ± 0.02%/day for BR 14; P = 0.002) at BR 14, which lead to a more negative balance between synthesis and breakdown (−0.023 ± 0.001%/day pre-BR vs. −0.041 ± 0.002%/day for BR 14; P = 0.02).
Amino acid kinetics are presented in Table 1. Net amino acid balance was more negative in response to cortisol after 14 days of inactivity. De novo synthesis of alanine and glutamine were also increased after BR. Model-derived calculation of protein breakdown (FM,O) demonstrated an increase that approached significance at P = 0.06. To compare the arteriovenous model calculation of protein breakdown with the direct method (FBR), FM,O (nmol·min−1·100 mL leg−1) derived from phenylalanine was converted to FBR (%/h) on the basis of phenylalanine content in muscle [≈233 nmol/mg dried tissue (17)], the protein content in muscle [≈25% (17)], and the assumption that muscle accounts for ≈60% of leg volume in normal subjects (25). Both methods resulted in essentially the same value, with no statistical differences at either time point between the direct FBR calculation and the FM,O to FBR conversion value. Prebed rest-direct FBR was 0.09 ± 0.005%/h, and the converted value for FM,O was 0.108 ± 0.02%/h, whereas BR14-direct FBR was 0.108 ± 0.005%/h, and the converted FM,O was 0.135 ± 0.08%/h. Because there is agreement between methods, it is likely that the depicted increase in protein breakdown by the arteriovenous model (FM,O) is significant despite P = 0.06.
Effects of bed rest and hypercortisolemia on leg muscle amino acid kinetics
| Parameter/amino acid | PHE | GLN | ALA |
|---|---|---|---|
| Pre-BR | |||
| Fin | 286 ± 58 | 2911 ± 879 | 2042 ± 582 |
| Fout | 302 ± 60 | 3037 ± 891 | 2230 ± 603 |
| FV,A | 128 ± 21 | 2203 ± 553 | 1121 ± 328 |
| FM,A | 159 ± 49 | 708 ± 365 | 920 ± 259 |
| FV,M | 175 ± 51 | 834 ± 367 | 1108 ± 279 |
| FM,O | 63 ± 14 | 1619 ± 502 | 3258 ± 895 |
| FO,M | 48 ± 11 | 1493 ± 500 | 3070 ± 859 |
| Ram | 222 ± 55 | 2327 ± 857 | 4178 ± 1128 |
| NBa | −16 ± 3 | −126 ± 30 | −188 ± 55 |
| DNS | 129 ± 28 | 148 ± 32 | |
| BR 14 | |||
| Fin | 455 ± 165 | 3414 ± 1158 | 2380 ± 859 |
| Fout | 508 ± 180 | 3716 ± 1225 | 2876 ± 1038 |
| FV,A | 247 ± 89 | 3033 ± 1042 | 1465 ± 563 |
| FM,A | 207 ± 80 | 381 ± 119 | 915 ± 311 |
| FV,M | 261 ± 94 | 683 ± 186 | 1411 ± 482 |
| FM,O | 137 ± 50b | 1498 ± 464 | 3451 ± 982 |
| FO,M | 84 ± 36 | 1196 ± 398 | 2955 ± 809 |
| Ram | 345 ± 128 | 1879 ± 581 | 4365 ± 1281 |
| NBa | −53 ± 15c | −302 ± 69c | −495 ± 187c |
| DNS | 282 ± 102c | 323 ± 117c |
Values are means ± se and are expressed as nmol·min−1·100 ml leg−1. Data are for the pre-BR and 14 days of BR studies during hypercortisolemia.
Fin, amino acid inflow into leg from systemic circulation via femoral artery; Fout, amino acid outflow from leg via femoral vein; FV,A, direct amino acid outflow from artery to vein without entering intracellular fluid; FM,A, inward amino acid transport from femoral artery into free muscle amino acid pool; FV,M, outward amino acid transport from intracellular pool into femoral vein; FM,O, intracellular amino acid appearance from endogenous sources (proteolysis for phenylalanine, proteolysis plus de novo synthesis for alanine and glutamine); FO,M, intracellular amino acid utilization (protein synthesis for phenylalanine, protein synthesis plus other fates for alanine and glutamine); RaM, total intracellular amino acid rate of appearance (inward transport and proteolysis for phenylalanine, includes de novo synthesis for alanine and glutamine); DNS, de novo synthesis.
Negative numbers indicate net release from muscle.
P = 0.06.
P < 0.05, significantly different than pre-BR rest.
Intracellular free amino acid concentrations of phenylalanine (83± 6 μmol/L pre vs. 89 ± 9 μmol/L BR 14), lysine (677 ± 66 μmol/L pre vs. 643 ± 85 μmol/L BR 14), and leucine (200 ± 6 μmol/L pre vs. 207 ± 19 μmol/L BR 14) were maintained in response to a cortisol challenge on BR 14. However, intracellular glutamine concentration was decreased significantly in response to cortisol on BR 14 (9850 ± 783μ mol/L pre vs. 8711 ± 525 μmol/L BR 14; P = 0.03).
Discussion
The present study demonstrates an interactive catabolic effect of hypercortisolemia and inactivity that is greater than either alone. Prolonged inactivity apparently sensitizes skeletal muscle to the catabolic effects of cortisol. With 14 days of bed rest, breakdown of muscle protein was significantly elevated in the presence of hypercortisolemia. Although certain essential intracellular amino acid concentrations were maintained by the increased FBR, without a concomitant stimulation of protein synthesis, accelerated protein breakdown leads to a more negative net balance across the muscle.
Investigation of protein metabolism by these independent methodologies have proven reliable and accurate. We have demonstrated that FSR and FBR measures in fasted individuals yield similar results (20) and that model-derived and direct incorporation calculations produce essentially similar values (17, 20). The FSR and FBR calculations describe fractional rates that are independent of the amount of muscle present. Thus, the loss of leg lean mass with BR would not affect the accuracy or validity of these values. The issue of tracer recycling from protein must be addressed because the second isotope infusion study was conducted 14 days after the first. Given that muscle protein turns over approximately 2%/day (see Results), then only 2% of the tracer enrichment could be derived from the first study. As a worse case, this would serve to underestimate only FBR calculations because FSR is unaffected since it is calculated by the difference in enrichment over time (Eq IX). In relation to this study, the possibility of an underestimation only strengthens the findings of increased protein breakdown with inactivity. In reality, however, a relative error of 2% is negligible in the calculation of FBR.
The BR model has been shown to mimic the loss of LBM associated with space flight and microgravity (11, 12, 26). In this respect, BR results in LBM losses, which are comparable with those noted in space (26). Although not included in the present study, “control” subjects who have experienced bed rest alone have been previously investigated by our laboratory (11). In the previous study, we demonstrated that the loss of LBM in normal, healthy volunteers is due to a decrease in whole-body and skeletal muscle protein synthesis, whereas protein breakdown remains unchanged (11). The interactive effect of hypercortisolemia and BR on protein breakdown is six times greater than that of BR alone. Furthermore, even though net amino acid balance across the muscle becomes more negative after BR alone (11), the combined effects of inactivity and hypercortisolemia are again 6-fold worse. It must be noted that both space flight and BR studies investigate fundamentally healthy individuals. However, BR in a healthy population is not clinically relevant. Prolonged BR or inactivity is an integral aspect of recovery from severe injury or illness, and the accompanying physiological and metabolic alterations are distinctly different than BR alone. Severe injury can result in a persistent hypercortisolemia that may last for weeks or months (4, 28). The present study demonstrates that after only 14 days of inactivity, hypercortisolemia exacerbates the loss of nitrogen from skeletal muscle.
To understand the extent of this loss and its clinical significance, Table 2 compares our present findings with those from previous investigations of fasted volunteers (20) and severely burned patients (1). The present study was designed to mimic the hypercortisolemia noted in severely burned patients (5, 28). Table 2 demonstrates that before inactivity the hypercortisolemic effects on skeletal muscle are indistinguishable from the values in overnight fasted healthy volunteers. It seems that there are no additive effects of hypercortisolemia and fasting in normal volunteers. The response to cortisol is quite different after prolonged inactivity. Table 2 illustrates that the effects of hypercortisolemia on skeletal muscle in fasted volunteers are very similar to those found in fed patients with 65% total body surface area burns (1). Skeletal muscle protein breakdown (FM,O), protein synthesis (FO,M), and net balance (NB) in these otherwise healthy, but inactive, volunteers is metabolically similar to patients with severe burn injury. For example, the apparent doubling of protein synthesis (FO,M) is similar to that noted in burn patients (1). This increase in protein synthesis is supported by the increased availability of amino acid precursors from protein breakdown (FM,O), which is elevated to the same extent in each group. The most prominent and physiologically important similarity is the dramatic negative net amino acid (phenylalanine) balance across the muscle, an unremitting situation in severely injured patients that leads to significant losses of LBM and impairs rehabilitative efforts (29).
Comparison of phenylalanine kinetics in skeletal muscle
| Fasteda | Hypercortisolemia; Pre-BR | Hypercortisolemia; BR 14 | Severe burnsb | |
|---|---|---|---|---|
| Fin | 252 ± 23 | 286 ± 58 | 455 ± 165 | 1115 ± 411 |
| Fout | 276 ± 27 | 302 ± 60 | 508 ± 180 | 1177 ± 436 |
| FV,A | 127 ± 16 | 128 ± 21 | 247 ± 89 | 900 ± 436 |
| FM,A | 125 ± 23 | 159 ± 49 | 207 ± 80 | 215 ± 82 |
| FV,M | 149 ± 27 | 175 ± 51 | 261 ± 94 | 277 ± 106 |
| FM,O | 68 ± 16 | 63 ± 14 | 137 ± 50 | 125 ± 48 |
| FO,M | 45 ± 13 | 48 ± 11 | 84 ± 36 | 63 ± 24 |
| Ram | 193 ± 35 | 222 ± 55 | 345 ± 128 | 340 ± 130 |
| NB | −24 ± 7 | −16 ± 3 | −53 ± 15 | −62 ± 20 |
Values are means ± se and are expressed as nmol·min−1·100 ml leg−1. See Table 1 for the explanation of kinetic parameters.
From Ref. 20.
From Ref. 1 and unpublished kinetic data in fed patients. Note that hypercortisolemia before BR has a similar effect on skeletal muscle as fasting in a normal volunteer. However, hypercortisolemia after 14 days of inactivity produces effects on skeletal muscle that are similar to those after severe burn injury.
The results of the present study, when given the perspective of clinical findings, point to the importance of the interactive effects of hypercortisolemia and inactivity on skeletal muscle after severe injury. The present study supports previous work using infusions of the counterregulatory hormones that demonstrate an increasingly negative amino acid balance across the limb (7, 30) and also confirms that the muscle nitrogen loss is predominantly a function of hypercortisolemia (7). However, Gelfand et al. (7) and Barrett speculated that the stress hormones “contributed to, but were not solely responsible for the muscle proteolysis … seen during severe stress.” The present study indicates that the interactive effects of inactivity and hypercortisolemia may be the prevailing influences on skeletal muscle proteolysis after severe injury.
Further evidence for this combined influence of BR and hypercortisolemia can be seen in the resultant change of intramuscular glutamine concentrations. Glutamine has often been considered a conditionally essential amino acid after severe injury (32, 33) or surgical stress (33). In addition to its role in the interorgan transport of nitrogen, glutamine plays an important role in counteracting glucocorticoid-induced muscle loss (34), wound healing (35), and immune function (36). It has previously been demonstrated that after severe injury (2) or surgery (33) intramuscular glutamine can be depleted by as much as 40–75%. The current study demonstrated a significant decrease of intramuscular glutamine in response to hypercortisolemia after inactivity whereby levels were only 56% of normal. This dramatic decrease in intramuscular glutamine concentration is representative of the decrease noted after surgical stress (33). This provides further evidence that protein metabolism in skeletal muscle without an accompanying pathology can be made to represent severely injured muscle by combining hypercortisolemia and inactivity.
There is indirect evidence in animals that suggests that the ubiquitin-proteasome pathway may be involved in the catabolic effects of hypercortisolemia and inactivity on muscle protein breakdown. When fasted rats are injected with glucocorticoids, expression of ubiquitin protein mRNA increases within 6 h and is associated with a 25% increase in muscle protein degradation (37). In denervated (inactive) rat muscle, nonlysosomal proteolysis was 52% greater than an innervated control (38). When competitive inhibitors of the 26S (ubiquitin) proteasome were introduced, proteolysis was inhibited by 65% (38), indicating that proteolysis in inactive muscle is due in large part to this ubiquitin-proteasome pathway. Emerging evidence indicates that similar mechanisms are involved in the regulation of protein degradation in human muscle (39). A link between inactivity and increased protein oxidation has also been established in rats, where it is hypothesized that the decreased blood flow and oxidative damage with inactivity increases muscle breakdown (38). It is possible that this increased oxidative stress may also enhance the hypercortisolemic response during inactivity. Assuming similar pathways for protein degradation in human muscle, hypercortisolemia may exacerbate proteolytic pathways that are already “primed” by inactivity, thus accounting for the interactive effects. Although plausible, it must be noted that the role of the ubiquitin-proteasome pathway and these mechanisms in human muscle remain largely speculative at this point.
Thus, this study demonstrates that inactivity exacerbates the proteolytic effect of hypercortisolemia on skeletal muscle. The absence of muscular activity sensitizes skeletal muscle to the catabolic effects of cortisol. This predisposition to protein breakdown is such that skeletal muscle in healthy volunteers is metabolically analogous to severely injured or stressed patients. These findings provide a metabolic basis for the current surgical axiom of “getting the patient up and moving” as soon as possible after surgery. However, for a more severe injury, such as burns, prolonged bed rest is inherent, and efforts must focus on the preservation of LBM by ameliorating the catabolic effects of hypercortisolemia.
Acknowledgements
We thank the nursing staff at the University of Texas Medical Branch General Clinical Research Center for its invaluable assistance in the conduct of these studies and Guy Jones and Zhiping Dong for their tireless efforts in sample analysis.
This study was funded by NIH Grants M01-RR-00073 and GM 57295-01, NASA Contract NAS 9-97043, and Shriners Hospitals Grant 8940.
Ferrando AA, Chinkes DL, Wolf SE, Matin S, Herndon DN, Wolfe RR. 1999 A submaximal dose of insulin promotes net skeletal muscle protein synthesis in patients with severe burns. Ann Surg. 229(1):11–18.
Ferrando AA, Chinkes DL, Wolf SE, Matin S, Herndon DN, Wolfe RR. 1998 Acute dichloroacetate administration increases skeletal muscle free glutamine concentrations after burn injury. Ann Surg. 228(2):249–256.
Sakurai Y, Aarsland A, Herndon DN, et al. 1995 Stimulation of muscle protein synthesis by long-term insulin infusion in severely burned patients. Ann Surg. 222(3):283–297.
Brillon DJ, Zheng B, Campbell RG, Matthews DE. 1995 Effect of cortisol on energy expenditure and amino acid metabolism in humans. Am J Physiol (Endocrinol Metab). 268(31):E501–E513.
Gore DC, Jahoor F, Wolfe RR, Herndon DN. 1993 Acute response of human muscle to catabolic hormones. Ann Surg. 218(5):679–684.
Ferrando AA, Lane HW, Stuart CA, Wolfe RR. 1996 Prolonged bed rest decreases skeletal muscle and whole-body protein synthesis. Am J Physiol (Endocrinol Metab). 270(33):E627–E633.
LeBlanc AD, Gogia P, Scheider V, Krebs J, Schonfeld E, Evans H. 1988 Calf muscle area and strength changes after five weeks of horizontal bed rest. Am J Sports Med. 16(6):624–629.
Biolo G, Fleming DY, Maggi S, Wolfe RR. 1995 Transmembrane transport and intracellular kinetics of amino acids in human skeletal muscle. Am J Physiol (Endocrinol Metab). 268(31):E75–E84.
Bergstrom J, Furst P, Noree LO, Vinnars E. 1974 Intracellular free amino acid concentration in human muscle tissue. J Appl Physiol. 36(6):693–697.
Ferrando AA, Tipton KD, Doyle D, Phillips SM, Cortiella J, Wolfe RR. 1998 Net protein synthesis and amino acid uptake with testosterone injection. Am J Physiol (Endocrinol Metab). 275(38):E864–E871.
Zhang X, Chinkes DL, Sakurai Y, Wolfe RR. 1996 An isotopic method for measurement of muscle protein fractional breakdown rate in vivo. Am J Physiol (Endocrinol Metab). 270(33):E759–E767.
Jahoor F, Desai M, Herndon DN, Wolfe RR. 1988 Dynamics of the protein metabolic response to burn injury. Metabolismo. 37(4):330–337.
Vaughn GM, Becker RA, Allen JP, Goodwin CW, Pruitt BA, Mason AD. 1982 Cortisol and corticotrophin in burned patients. J Trauma. 22(4):263–273.
Bessey PQ, Lowe KA. 1993 Early hormonal changes affect the catabolic responses to trauma. Ann Surg. 218(4):476–491.
Hammarqvist F, Wernerman J, Ali R, van der Decken A, Vinnars E. 1989 Addition of glutamine to total parenteral nutrition after elective abdominal surgery spares free glutamine in muscle, counteracts the fall in muscle protein synthesis, and improves nitrogen balance. Ann Surg. 20(4):455–461.
Hickson RC, Czerwinski SM, Wegrzyn LE. 1995 Glutamine prevents down-regulation of myosin heavy chain synthesis and muscle atrophy from glucocorticoids. Am J Physiol (Endocrinol Metab). 268(31):E730–E734.
Caldwell MD. 1989 Local glutamine metabolism in wounds and inflammation. Metabolismo. 38[Suppl 1]:34–39.
Wing SS, Goldberg AL. 1993 Glucocorticoids activate the ATP-ubiquitin-dependent proteolytic system in skeletal muscle during fasting. Am J Physiol (Endocrinol Metab). 264(27):E668–E676.
