


Although brown adipose tissue (BAT) activity is increased by a cold environment, little is known of the response of human white adipose tissue (WAT) to the cold.
We examined both abdominal and thigh subcutaneous (SC) WAT from 71 subjects who were biopsied in the summer or winter, and adipose expression was assessed after an acute cold stimulus applied to the thigh of physically active young subjects.
In winter, UCP1 and PGC1α mRNA were increased 4 to 10-fold (p < 0.05) and 1.5 to 2-fold, respectively, along with beige adipose markers, and UCP1 protein was 3-fold higher in the winter. The seasonal increase in abdominal SC WAT UCP1 mRNA was considerably diminished in subjects with a BMI > 30 kg/m2, suggesting that dysfunctional WAT in obesity inhibits adipose thermogenesis. After applying an acute cold stimulus to the thigh of subjects for 30 min, PGC1α and UCP1 mRNA was stimulated 2.7-fold (p < 0.05) and 1.9-fold (p = 0.07), respectively. Acute cold also induced a 2 to 3-fold increase in PGC1α and UCP1 mRNA in human adipocytes in vitro, which was inhibited by macrophage-conditioned medium and by the addition of TNFα.
Human SC WAT increases thermogenic genes seasonally and acutely in response to a cold stimulus and this response is inhibited by obesity and inflammation.
Brown adipose tissue (BAT) is present in all mammals and serves to dissipate energy as heat to defend against the cold through the actions of uncoupling protein 1 (UCP1) (1) and this increase in energy expenditure also helps prevent obesity in rodents (2). The recent rediscovery of human BAT through fluorodeoxyglucose (FDG) PET-CT has stimulated much research on thermogenesis and provocative questions about adipose browning as a defense against obesity in humans (3–6). Using PET-CT, about 25% of humans have demonstrable BAT, but with cooling most humans will demonstrate d-glucose uptake in discrete areas around the neck and spine, and these tissues have a brown/beige adipose phenotype (5). In addition, the activation of these BAT depots is dependent upon outdoor temperature, seasons, and adiposity in subjects (7, 8).
In addition to the activation of BAT, rodents can increase their thermogenic capacity in typical white adipose tissue (WAT) depots by a process known as “browning,” which results in increased brown adipocytes in WAT depots (6). This type of brown fat has a distinct pathway of development and a unique signature of gene expression; thus, it is now called beige fat (4, 12, 13). However, both brown and beige adipocytes have increased mitochondrial content and express UCP1, which uncouples oxidative respiration to generate heat, and both cells express PPARγ, PRDM16, and PGC1α during differentiation (9–11). PGC1α is induced by β-adrenergic stimulation, which is a well characterized mechanism to induce browning of white adipose (12).
Previous studies have clearly demonstrated the ability of rodent WAT depots to become beige upon cold stimulation (6), however, very little research has examined human WAT for a similar ability. Therefore, the main goal of our study was to investigate the capability of WAT from different depots in humans to respond to seasons and cold exposure with increased markers of beige fat. An additional purpose was to determine the role of obesity and inflammation in the process of beiging of WAT in humans, since activation of BAT is inversely related to adiposity (7) and elevated inflammation is associated with increased WAT mass (14). Subjects with different levels of obesity were recruited in order to address these two goals.
We examined the subcutaneous WAT of humans and found a considerable ability to up regulate UCP1 and other mitochondrial genes in response to an acute cold stimulus and to seasons, and this effect was inhibited by obesity. Human adipocytes in culture have a similar ability, which was inhibited by inflammation. Humans have over 1000-fold more SC WAT than they do BAT, and thus, the induction of these genes in SC WAT could be exploited to up regulate energy expenditure and/or to improve WAT function.
Materials and Methods
Human subjects
To examine the seasonal changes in adipose tissue, we examined both abdominal (group 1) and thigh (group 2) subcutaneous (SC) adipose tissue from two groups of subjects. Group 1 involved abdominal SC biopsy samples from subjects covering a broad range of body mass index (BMI) and insulin sensitivity, and their characteristics are shown in Table 1. All subjects gave informed consent and the protocols were approved by the Institutional Review Boards from either the University of Kentucky or the University of Arkansas for Medical Sciences. Some of these subjects were involved in previous studies (15, 16), but only baseline (pretreatment) samples were examined. “Winter” biopsies were collected between the December 1 and March 21, which corresponds to daily mean temperatures of 4–8°C. “Summer” biopsies were collected between June 1 and September 15, when mean temperatures are 20–24°C. For each subject, the biopsy was performed in either the winter or summer, and no repeated measures were performed on these subjects. All participants were generally healthy, with no evidence of chronic inflammatory disease, and participated in normal activities of daily living (ADL) but without significant exercise. No subjects were employed in jobs that involved prolonged outdoor activity, none were taking any medication likely to change adipocyte metabolism, and there were no abnormalities in liver enzymes, creatinine, or TSH. All subjects were initially assessed with a standard oral glucose tolerance test (OGTT) to rule out diabetes.
Characteristics of subjects with SC WAT biopsies
| Sensitivity Index | Summer | Winter | ||||
|---|---|---|---|---|---|---|
| BMI < 30 | BMI > 30 | All | BMI < 30 | BMI > 30 | All | |
| n (M/F) | 16 (6/10) | 12 (2/10) | 28 (8/20) | 13 (3/10) | 14 (5/9) | 27 (8/19) |
| Age | 38 ± 2.9 | 47 ± 2.8 | 42 ± 2.3 | 49 ± 2 | 47 ± 3 | 48 ± 2 |
| BMI | 27 ± 0.6 | 37 ± 1.2 | 32 ± 1.2 | 27 ± 1.1 | 34 ± 1 | 31 ± 1.1 |
| SI | 4.5 ± 0.5 | 2.0 ± 0.1 | 3.8 ± 1.0 | 3.3 ± 0.4 | 2.0 ± 0.3 | 3.0 ± 0.6 |
| FBG | 79 ± 6 | 93 ± 3 | 88 ± 6 | 82 ± 2 | 92 ± 3 | 87 ± 3 |
| 2 h glu | 102 ± 9 | 136 ± 10 | 121 ± 6 | 112 ± 8 | 160 ± 8 | 136 ± 6 |
Characteristics of subjects with SC WAT biopsies are displayed as mean ± se. n, number of subjects; M, male; F, female; age, years; BMI, body mass index (kg/m2); SI, insulin sensitivity from FSIGT; FBG, fasting blood glucose (mg/dl); 2 h glu, glucose 2 h after standard oral glucose tolerance test (mg/dL). There was no significant difference in male/female ratio or SI between the summer and winter groups. For SI, BMI and glucose values, the differences were significantly different (P < .05) between the subjects with BMI over 30 kg/m2 vs BMI under 30 kg/m2.
After an overnight fast, adipose biopsies were performed with a 2.5 cm incision in the lower abdominal wall under local (lidocaine without epinephrine) anesthesia and approximately 2 g of tissue was removed. On a different day, insulin sensitivity was measured with a frequently sampled IV glucose tolerance test (FSIGT) and minmod millennium calculation, which yields a measure of insulin sensitivity (SI) that correlates well with the euglycemic clamp (17, 18).
To examine a different adipose depot, fat biopsies from the anterior thigh were performed on group 2, a group of 16 healthy subjects from the Lexington area. The recruitment of these subjects was intended to examine the effects of an acute cold stimulus in the form of the application of a cold pack to the thigh on adipose tissue and muscle. The experiments (baseline biopsy followed by cold-stimulus biopsy) were performed in the summer (n = 7) or winter (n = 9) such that we could compare baseline values for the different seasons in this group. These subjects were all under age 30 (mean 26.6 years) and most were physically active, but mostly through indoor activities in a gym. This group included 10 men and 6 women, and mean BMI was 26.3 kg/m2. These subjects were taking no medications and had no chronic illnesses. All subjects had a thigh skinfold thickness of less than 2 cm to ensure that the cold stimulus reached the muscle as well as the fat; the applied protocol was according to Merrick et al (19) and ensured substantial cooling (down to about 23°C) beyond the fat layer into the muscle. At 8:00 am, an ice pack weighing 2 kg was tightly applied to the skin over the left thigh for 30 min, and then removed. During the cold stimulus, subjects reported that the site felt numb, and there was a rewarming sensation, but no unpleasant side effects or shivering were observed. A fat and muscle (vastus lateralis) biopsy was performed from the site of the cold stimulus, as well as from the non-iced (control) leg using a 0.75 cm incision. The fat was removed with a scalpel and with use of a conchotome, and the muscle biopsy employed a Bergstrom needle with syringe suction. These biopsies were taken 4 h after conclusion of the ice application, since this time period has been shown to be optimal to measure changes in gene expression (20, 21). The iced leg was always biopsied first to ensure that the time period after icing was the same between all the subjects.
Gene expression
Total RNA was isolated from human adipose tissue using RNAeasy Lipid Tissue Mini (Qiagen) and RNA quantity and quality were verified using an Agilent 2100 Bioanalyser. Real-time RT-PCR was performed as described previously (22) using18S RNA to normalize the data. The primers used for each of the RNAs tested are shown in Supplemental Table S1.
Western blotting
Adipose tissue (50 mg) was lysed in 50 mM Tris,150 mM NaCl, 0.1% SDS, 0.5% Sodium Deoxycholate, and 1% IGEPAL CA-630, and 1X protease inhibitors (Calbiochem) by sonication. The lysate was then centrifuged at 1000 × g for 10 min at 4°C to remove cellular debris. Fifty μg of lysate was resolved on a 10% SDS-PAGE gel, transferred to nitrocellulose, and immunoblotted as follows. The membranes were blocked in tris buffered saline [TBS: 20 mM Tris(hydroxymethyl)aminomethane pH 8.0, 150 mM NaCl] with 1% casein, and the membranes were then incubated with primary antibody for 1 h, washed three times with TBS, incubated with IRDye 800CW secondary antibodies (LI-COR Biosciences), washed three times with TBS, and quantified using an Odyssey imaging system (LI-COR Biosciences). Antibodies against UCP1 were obtained from Millipore (AB1426) and used at a 1:1000 dilution. Antibodies against actin (used as a loading control) were from Sigma (A1978) and used at a 1:10 000 dilution.
Cell culture
Human adipocytes in culture were obtained by the induction of differentiation of adult derived human adipocyte stem cells (ADHASC) as described previously (23). In brief, adipose tissue was obtained from patients undergoing liposuction of the subcutaneous WAT of the abdomen or thigh, and preadipocytes were obtained by collagenase digestion. The differentiation of the preadipocytes was induced 2 days post confluence using a differentiation medium [DMEM:Ham's F-10 vol/vol 1:1, 3% FBS (Invitrogen), 15 mM Hepes pH 7.4 (Invitrogen), 33 μM Biotin (Sigma), 17 μM pantothenate (Sigma), 1 μM dexamethasone (Sigma), 0.25 mM IBMX (Sigma), 1 × 10⁻⁷ M Insulin (Novo Nordisk) and 1 μM rosiglitazone (SmithKline Beecham)] for 3 days. The cells were then incubated in the above differentiation medium without IBMX and rosiglitazone with medium changes every 3 days until 80–90% of the cells had lipid droplets (usually 7–10 days).
THP-1 monocytes were polarized to differentiate into M1, M2a, and M2c macrophages using (for M1) 100 ng/ml LPS (R&D Systems) and 20 ng/ml INF-γ (R&D Systems), (for M2a) 25 nM phorbol ester 12-O-tetradecanoylphorbol-13-acetate (TPA) (Sigma) followed by 20 ng/ml of IL4 (R&D Systems), or (for M2c) IL10 (R&D Systems), as described previously (15). After 16 h of differentiation, the conditioned medium was made by replacing the macrophage medium with αMEM with 2% FBS, incubating for 24 h, and then harvesting the conditioned medium.
Experimental treatment of differentiated ADHASC cells
After ADHASC cells were fully differentiated, cells were incubated in α-MEM with 2% FBS medium or macrophage conditioned medium (above) in a 5% CO2 incubator at 37°C for 12 h, subjected to cold shock at 16°C for 30 min, and allowed to recover for 4 or 24 h at 37°C as indicated. Cells were also treated with conditioned medium or medium containing 1, 10, or 100 ng/ml TNFα (R&D) for 24 hours after cold shock at 16°C for 30 min as indicated. Total RNA was isolated using RNAqueous (Ambion), and gene expression was evaluated by real-time PCR as described above.
Statistics analysis
Data in the tables are expressed as mean ± SEM. Two-sample t-tests were performed to compare winter and summer with respect to dependent variables. Paired t-tests were utilized to examine the acute response to cold in WAT. In Figure 2 below, the interaction of season and obesity, ie, the difference in seasonal effect for lean and obese subjects, was assessed using a t-test from a linear regression model using weights that account for possible differences in variances across seasons. T-tests from this model were also used to assess statistical significance with respect to seasonal effects for lean and obese separately. We used results from individual comparisons, rather than MANOVA, because we were interested in which variables differ between winter and summer, rather than using one test to determine whether any differences occur. Additionally, we used a multiple linear regression model to control for any factors for which these groups are not comparable, ie, adjusting for potential confounders. Statistical significance for all tests was set at P ≤ .05. Analyses were performed in SAS version 9.3 (SAS Institute).
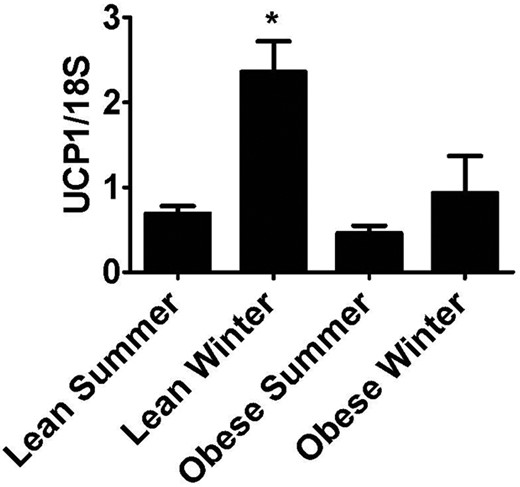
Effect of high BMI on seasonal induction of abdominal SC UCP1 expression.
The UCP1 mRNA data from the subjects in group 1 was grouped according to BMI more or less than 30 kg/m2 and by season. *P < .05 vs “lean summer.”
Results
Seasonal changes in adipose tissue gene expression
We measured gene expression in the abdominal SC adipose tissue of 55 subjects in group 1, and a subset of genes in the thigh SC adipose tissue from the 16 subjects in group 2. UCP1 and PGC1α mRNA expression was higher in the winter than the summer in abdominal SC adipose tissue from group 1 (Figure 1A). In addition, the mRNA levels of genes involved with energy utilization and lipolysis, such as adiponectin, acetyl CoA carboxylase (ACC), and hormone sensitive lipase (HSL) were all significantly higher in the adipose biopsies from the winter than the summer (group 1, Figure 1A), while housekeeping genes, such as cyclophilin A did not change (not shown). Previous studies have identified a number of genes in mouse adipocytes that are specific to either beige or brown adipocytes (12). We examined the expression of four “beige” gene markers, and four “brown” adipose markers in the samples from group 1. As shown in Figure 1B, two of the beige markers that were previously identified in mice were significantly increased in winter, whereas none of the brown adipose markers were increased. To investigate whether thigh adipose tissue also responds to changes in season we measured UCP-1, PGC1α, and TMEM26 expression in group 2. All three genes were significantly elevated in winter (Figure 1C) indicating that seasonal changes are not dependent on fat depot. To assess UCP1 protein expression, we immunoblotted abdominal SC fat from 8 summer and 8 winter subjects from group 1. There was increased UCP1 protein in the winter abdominal SC adipose tissue (Figure 1D).
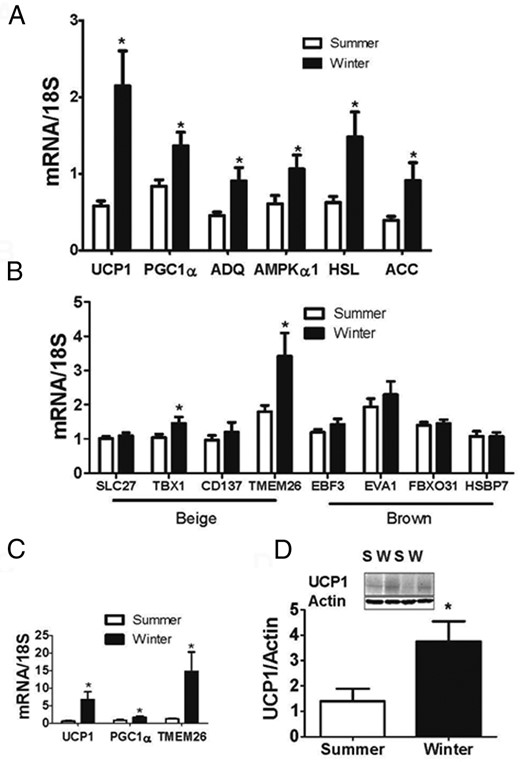
Seasonal changes in adipose tissue gene expression.
(A) and (B) Gene expression from abdominal SC adipose biopsies performed in the summer and winter of subjects in group 1. (C) Gene expression from thigh SC adipose biopsies performed in the summer and winter of subjects in group 2. (D) Western blot for UCP1 of 16 subjects from group 1; S, summer; W, winter. UCP1 expression was normalized to actin expression. Inset: example blot of the induction of UCP1. *P < .05 vs summer.
Effect of BMI on seasonal induction of UCP1
Because there was an increase in SC WAT UCP1 and PGC1α in the winter, we investigated whether there were differences between subjects based on a low vs high BMI in subjects from group 1 (see Table 1). Subjects were divided into BMI less than or more than 30 kg/m2, and into “summer” or “winter” according to the season of the biopsy. There was no significant difference in male/female ratio between the summer and winter groups (P = .94); furthermore the insulin sensitivity index (SI) was not different between summer and winter for the group with BMI over 30 (P = 1.0) or BMI under 30 (P = .19). For SI, BMI and glucose values, the differences were predictably significantly different between the subjects with BMI over 30 kg/m2 vs BMI under 30 kg/m2 (Table 1; group 1). UCP1 mRNA levels were higher in the winter in subjects with BMI < 30 (Figure 2; P < .001), whereas for BMI > 30 subjects, the seasonal effect was blunted and no statistically significantly different between summer and winter (Figure 2; P = .3). This interaction between BMI, UCP1, and season was not influenced by age or gender. Thus, there was a difference in the ability of lean/overweight (BMI < 30) and obese (BMI > 30) subjects to induce UCP1 seasonally (Figure 2; interaction between season and BMI: P = .04). This interaction between BMI and season was not observed with other genes affected by season. In addition, we used a multiple linear regression model to adjust for any confounders, such as age and gender. Using this different statistical approach, we again observed a significant increase of UCP1 mRNA in the winter subjects with BMI < 30 (Figure 2; P < .001), a blunted response for BMI > 30 subjects (Figure 2; P = .3), and an interaction between season and BMI (Figure 2; interaction between season and BMI: P = .04). Importantly, we were able to rule out gender (P = .25) and age (P = .54) as confounders; thus, the groups are comparable with respect to these.
Acute response of adipose to cold
To examine the acute response to cold in WAT, we performed adipose biopsies on physically fit subjects (group 2) after an acute cold exposure. When comparing the iced leg to the control, PGC1α mRNA expression was induced 2.7-fold by cold exposure in the summer months (group 2, Figure 3A, P = .015), and UCP1 also tended to be induced (1.9-fold induction; P = .07), as shown in Figure 3B. Interestingly, neither PGC1α nor UCP1 were induced by cold exposure in the winter (not shown). This was likely due to the already elevated baseline levels that occur with the chronic cold exposure of the seasons (Figure 1, B and C). As a positive control for cold exposure, we measured the expression of the cold shock protein RNA binding motif 3 (RBM3) (24) and found that the cold treatment induced the expression RBM3, as expected, by 1.74-fold (P < .05, data not shown).
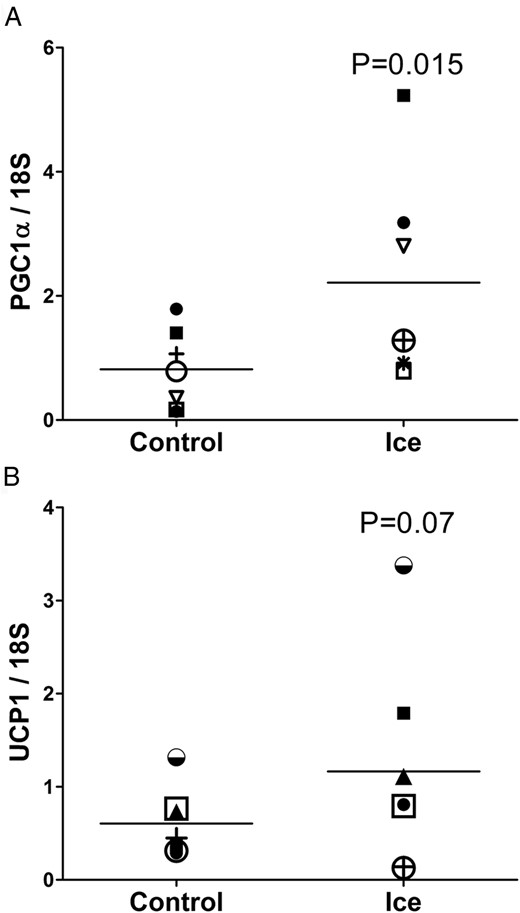
Response to acute cold exposure.
Thigh SC adipose was obtained from 7 subjects from group 2 in the summer 4 h after a 30-min cold exposure, and compared to the adipose tissue from the non-iced thigh (PGC1α, P = .015; UCP1, P = .07; one-tailed t-test).
Muscle biopsies were also performed in response to the acute cold exposure on the thigh. RNA was extracted from the muscle samples and gene expression was assessed. No change in gene expression of mitochondrial genes was detected, but RMB3 was also not induced (data not shown) indicating that the response to cold may be adipose tissue specific.
In vitro response of human adipocytes
Recent studies have indicated that mouse adipocytes can respond to the cold in a cell-autonomous manner, without sympathetic nervous system stimulation (25). Therefore, we tested whether differentiated human ADHASC cells would increase UCP1 and PGC1α in response to a cold treatment in vitro. When ADHASC cells were exposed to 16°C, there was an increase in both PGC1α and UCP1 expression, along with an increase in PGC1α protein (Figure 4; P < .05). The increases in PGC1α and UCP1 were not observed immediately after the cold exposure, but were noted 4 and 24 h after recovery from the cold exposure. Because inflammation may play a role in the inhibition of the seasonal response in obese subjects, we treated ADHASC cells with conditioned media from THP-1 cells polarized into M1, M2a, and M2c macrophages, as described in Materials and Methods. We found that the conditioned medium from M1 and M2c macrophages inhibited both PGC1α and UCP1 expression from adipocytes, and all macrophage conditioned media inhibited the increase in PGC-1a and UCP-1 by cold (Figure 4, A and B, respectively). M1 macrophage conditioned medium was particularly effective at blunting the cold response. To further evaluate this inhibition, we examined the effects of TNFα and found that TNFα potently inhibited the gene expression of PGC1α and UCP1 in cold-treated ADHASC cells (Figure 4, A and B, respectively).
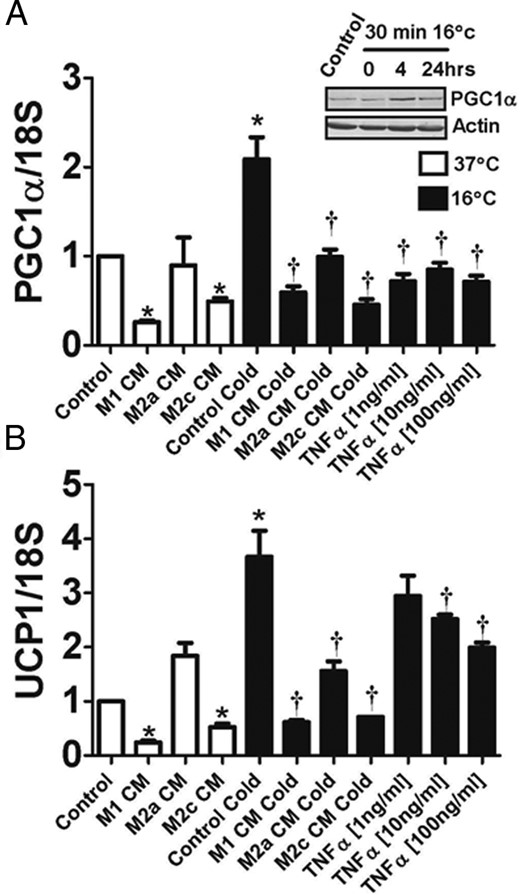
Effects of temperature and inflammation on adipocytes.
After human adipocytes were cultured and differentiated, they were kept at 37°C (open bars) or placed at 16°C for 30 min and allowed to recover for 4 h at 37°C (closed bars) as described in Materials and Methods. (A) Changes in PGC1α with cold and in response to macrophage conditioned medium or TNFα. As indicated, some experiments were performed in the presence of conditioned medium from M1, M2a, or M2c macrophages, or in the presence of the indicated concentrations of TNFα. Inset: Western blot of PGC1α from adipocytes that were kept at 37°C (control), or at 0, 4, and 24 h after a 30 min exposure to 16°C. (B) Changes in UCP1 in response to cold, macrophage conditioned medium or TNFα. *P < .05 vs control at 37°C. †P < .05 vs control cold.
Discussion
With the recent discovery of functional BAT in humans using radiologic methods, there has been renewed interest in the ability of thermogenic tissues to combat obesity in humans (26). Although it is clear that humans have depots of BAT that are activated by cold, most of the basic research has been in vitro and on rodent tissue.
An important question, however, concerns the functional relevance of BAT depots in humans. Although the thermogenic capacity of BAT is high, the total mass of BAT in humans is low, and BAT depots are located in the body cavity where temperature does not normally change. On the other hand, many studies have demonstrated that WAT has the ability to up-regulate its thermogenic capacity and become “beige” (27). In mice, cold exposure makes the typical interscapular BAT more thermogenic, but also makes most typical WAT depots beige, especially the SC WAT depot (6, 12, 13). This beiging effect in the SC WAT likely provides an additional layer of defense against the cold.
To our knowledge no previous studies have examined human WAT for evidence of thermogenic gene induction by season or acute cold exposure, and therefore we examined WAT from biopsies that were performed in the summer and winter from both the abdominal and thigh SC depots. In both depots, UCP1 and PGC1α were higher in adipose biopsied in the winter than the summer. In the abdominal SC WAT, other genes involved with lipolysis and energy utilization (adiponectin, AMPK, HSL, and ACC) were also elevated in the winter, as was the adipose protein level of UCP1.
These data suggest that there are seasonal changes in WAT thermogenic gene expression in free living subjects who do not partake in extreme outdoor activities. Based on the response to cold exposure in mice, one would expect SC WAT to become more beige (6). A limitation to the current study is that we do not know whether the induction of these genes is due to the increased presence of genuine beige adipocytes or increased expression of thermogenic genes in white adipocytes. Indeed, the increased expression of TBS1 and TMEM26 suggests that there may be an increase in beige adipocytes, but further studies are needed to confirm this. In either case, the changes in gene expression likely represent “healthier” WAT since PCG1α has been shown to have beneficial properties in WAT (28). It will be important in the future to characterize the adipose depots histochemically and functionally.
To determine whether this seasonal increase in UCP1 was dampened by obesity, as was shown for human BAT (7), we divided the subjects into groups based on BMI that was in the obese (> 30 kg/m2) or in the normal to overweight (BMI < 30 kg/m2) range. Although obese subjects whose biopsies occurred in the winter demonstrated slightly higher levels of UCP1, these changes were not significant. This effect of obesity could have been due to the higher level of insulation from increased adiposity, although the adipose biopsies are very superficial. It is also possible that these differences represented behavioral changes associated with obesity. A limitation of the study was that the measurements for group 1 were not taken from the same individuals in the summer and winter and, therefore it will be important to confirm these outcomes with a paired study design in the future.
To examine the effects of cold in a more dynamic manner, we performed adipose biopsies before and after an acute cold exposure. We chose a different adipose depot, the anterior thigh, to determine whether the effects in abdominal SC fat were found elsewhere, and to determine whether there was a cold response in muscle. A 30 min cold exposure was sufficient to generate changes in WAT gene expression (PGC1α and UCP1). Even though these subjects all had skinfolds smaller than 2 cm, this cold exposure failed to generate changes in muscle gene expression. Although few studies have examined the effects of cold on human WAT or muscle, a recent study exposed subjects to 10 days of progressively longer periods in a 16°C room and found no change in either muscle or WAT mitochondrial markers (29). However, these subjects were all studied in winter and early spring. Based on our data, it is likely that there was already up regulation of UCP1 and other thermogenic genes in WAT and an additional cold exposure was likely not effective.
The human studies suggested a link between the adipose pathology of obesity and impaired winter UCP1 elevation. To examine the response of human adipocytes in vitro, cells were exposed to 16°C for 30 min, which yielded an increase in PGC1α and UCP1. Although adipocytes in vivo are innervated and clearly respond to sympathetic nervous system stimulation and plasma catecholamines (30), there is also evidence for cold receptors on adipocytes that will activate UCP1 expression (25, 31, 32). When cold exposed adipocytes were exposed to inflammatory products, either macrophage conditioned medium or TNFα, the cold response was considerably blunted. This effect was especially pronounced with M1 macrophage conditioned medium, indicating that a proinflammatory environment blunts the beiging effect of WAT in response to cold.
The BAT/beige adipose depots that are readily identified using FDG PET/CT have considerable metabolic activity. These depots are often not detectable unless stimulated by cold exposure (5), although there is evidence that there are higher baseline levels of FDG PET/CT uptake in the winter, compared to the summer (7), and previous studies have noted that resting metabolic weight is increased in the winter (33). Thus, available data suggest that some element of adaptation to seasonal temperature changes occur; weight loss would not be expected to result from these changes in energy expenditure unless there was some restriction of calories.
However, the source of these seasonal changes in energy metabolism is not clear. Some of this could be from increased BAT activity, but most humans do not demonstrate positive FDG PET uptake at baseline, even in the winter, suggesting that other tissues are able to contribute to seasonal thermogenesis. In a study involving measurements of BAT activity, energy expenditure and tissue-level rate of oxygen consumption, the mass of BAT varied in humans between 2 and 85 g (usually less than 10 g) (34). Upon cold stimulation, BAT activity and tissue-level oxygen consumption increased, but cold-induced thermogenesis in BAT could only explain a small fraction of the total increase in overall energy expenditure, leaving open the possible contribution of other tissues, such as WAT.
Studies in rodents have noted pockets of beige/brite adipocytes in WAT and these tissues become overtly beige when the animal is exposed to cold (6, 12); our data suggest that human WAT has the ability to induce thermogenic genes and show evidence of beiging. In addition, our data support the thesis that this induction is inhibited by inflammatory cytokines and by obesity. In contrast to BAT mass, which in humans is small (34), SC WAT mass is at least 1000-fold greater than that of BAT, and therefore even a small increase in UCP1-mediated mitochondrial uncoupling in WAT could significantly increase energy expenditure. These changes in energy expenditure may occur naturally with seasons, and this effect could potentially be manipulated through drug therapy.
Acknowledgments
We thank Regina Dennis at the University of Arkansas for Medical Sciences and Stacy BeBout and Doug Long at the University of Kentucky for their assistance with subject recruitment.
This work was supported by the following grants: DK80327 and DK71349 (P.K.), CTSA Grant No. UL1TR000117 and P20RR021954.
Disclosure Summary: The authors have nothing to disclose.
Abbreviations
References
