


Abstract
Pneumococcal vaccination is recommended in people with HIV, prioritizing PCV. We compared the immunogenicity of PCV-10 and PPV-23 administered antepartum or postpartum.
This double-blind study randomized 346 pregnant women with HIV on antiretrovirals to PCV-10, PPV-23, or placebo at 14–34 weeks gestational age. Women who received placebo antepartum were randomized at 24 weeks postpartum to PCV-10 or PPV-23. Antibodies against 7 serotypes common to both vaccines and 1 serotype only in PPV-23 were measured by ELISA/chemiluminescence; B- and T-cell responses to serotype 1 by FLUOROSPOT; and plasma cytokines/chemokines by chemiluminescence.
Antibody responses were higher after postpartum versus antepartum vaccination. PCV-10 generated lower antibody levels than PPV-23 against 4 and higher against 1 of 7 common serotypes. Additional factors associated with high postvaccination antibody concentrations were high prevaccination antibody concentrations and CD4+ cells; low CD8+ cells and plasma HIV RNA; and several plasma cytokines/chemokines. Serotype 1 B- and T-cell memory did not increase after vaccination.
Antepartum immunization generated suboptimal antibody responses, suggesting that postpartum booster doses may be beneficial and warrant further studies. Considering that PCV-10 and PPV-23 had similar immunogenicity, but PPV-23 covered more serotypes, use of PPV-23 may be prioritized in women with HIV on antiretroviral therapy.
NCT02717494.
Pneumococcus is a leading cause of bacterial pneumonia in individuals with human immunodeficiency virus (HIV). Even with the widespread use of antiretroviral therapy (ART), the incidence of invasive pneumococcal disease (IPD) remains higher in people with HIV compared with same-age adults without HIV [1, 2]. IPD is also more common in pregnant and early postpartum women compared with nonpregnant women of reproductive age in the absence of HIV infection [3, 4].
IPD is a vaccine-preventable condition [5]. There are 2 types of antipneumococcal vaccines: PPV-23, which is a polysaccharide vaccine containing 23 capsular serotypes, and 2 conjugated vaccines, PCV-10 and PCV-13, containing 10 and 13 serotypes, respectively. The efficacy of PPV-23 in preventing IPD in people with HIV was demonstrated in several nonrandomized studies, but the only randomized, placebo-controlled trial failed to show a decrease in all-cause pneumonia [6, 7]. Importantly, the study also showed that the failure of PPV-23 to protect against pneumonia was associated with low antibody responses to the vaccine [8]. The efficacy of PCV-9 and PCV-7 was demonstrated in children and adults with HIV, respectively [9, 10]. PPV-23, PCV-7, PCV-9, and PCV-13 were generally safe and equally immunogenic in people with HIV except for individuals with low CD4+ T cells and high HIV plasma RNA, who had higher antibody responses to PCV-7 compared with PPV-23 [11–14]. In the United States, the Centers for Disease Control and Prevention recommends administration of PCV-13 followed ≥ 8 weeks later by PPV-23 in people with HIV, including pregnant women [15].
Only 2 studies have addressed the safety and immunogenicity of pneumococcal vaccines during pregnancy in women with HIV, including the study reported here [16, 17]. In the first report that resulted from this study, we showed that PCV-10 and PPV-23 were equally safe and immunogenic in pregnant women with HIV and were associated with similar levels of transplacental antibody transport [17]. Neither vaccine affected pneumococcus carriage in women, but maternal administration of PPV-23 tended to decrease carriage of vaccine serotypes in infants in an exploratory analysis [17].
The effect of pregnancy on vaccine immunogenicity has been debated in the medical literature, with most studies focusing on influenza vaccination and showing conflicting results [18, 19]. In women with HIV, there are additional considerations that may factor into the decision of when to administer vaccines. Immunogenicity of vaccines in people with HIV generally increases with higher CD4+ and lower CD8+ T-cell counts and with lower HIV replication [11, 14, 17]. Pregnancy is associated with decreased CD4+ T-cell counts and mild immune suppression, suggesting that vaccines may not achieve optimal immunogenicity [20, 21]. Conversely, use of ART is associated with increased CD4+ and decreased CD8+ T-cell counts and decreased HIV replication and, therefore, has an indirect boosting effect on the immunogenicity of vaccines in women with HIV. Several studies conducted before the recommendation of universal ART administration to people with HIV showed that the use of ART decreased postpartum, complicating the identification of the optimal time to administer vaccines to pregnant women with HIV [22].
In this article, we report the results of secondary objectives of a much larger study. This report includes the effect of pregnancy, CD4+ and CD8+ T-cell counts, and plasma HIV viral load on the immunogenicity of PCV-10 and PPV-23 in women with HIV in the current landscape of universal ART recommendation in people with HIV. We also explored the association of inflammatory biomarkers on the immunogenicity of the vaccines.
METHODS
Study Design and Participants
This double-blind study (NCT02717494) randomized pregnant women with HIV 1:1:1 to receive PCV-10 (Glaxo Smith-Kline), PPV-23 (Merck), or placebo. The study was conducted at 8 clinical sites in Brazil, under approval of national and local regulatory review boards. All participants signed informed consent. Key inclusion criteria were pregnancy complicated by HIV, use of ART, gestational age ≥ 14 and < 34 weeks, and no prior pneumococcal immunization. The gestational age was chosen to avoid immunization in the first trimester and to allow enough time between immunization and delivery for transplacental antibody transport. Randomization was centralized. After unblinding, the site principal investigators received information on treatment allocations and letters were sent to participants notifying them of the treatment received.
At entry, participants received 1 dose of PCV-10, PPV-23, or placebo. At 24 weeks postpartum, placebo recipients were randomized to receive PPV-23 or PCV-10. Adverse events collected antepartum were reported elsewhere [17]. Adverse events were not collected postpartum because the safety of pneumococcal vaccines in young adults, including women, with HIV was well accepted before the initiation of this study. Antipneumococcal antibody concentrations against 8 serotypes were measured in all participants. Memory B- and T-cell responses were measured against a single serotype using cryopreserved peripheral blood mononuclear cells (PBMC) collected from the first 150 participants before and 4 weeks after vaccination antepartum and all participants vaccinated postpartum. Plasma samples from the same participants who contributed PBMC were used to measure inflammatory biomarkers. CD4+ and CD8+ T-cell numbers and HIV plasma RNA were measured at the time of vaccination antepartum and postpartum.
Serum Antibodies
Serum antibodies for serotypes 4, 7F, 23F, and 33F were measured by enzyme-linked immunosorbent assay (ELISA) at the World Health Organization reference laboratory at University College London, United Kingdom using methods previously described [23]. Antibodies for serotypes 1, 5, 6B, and 14 were measured at the University of Colorado Anschutz Medical Campus using a chemiluminescent multiplex assay (Meso Scale Discovery) as previously described [24]. Serotype 33F is included only in PPV-23.
Memory T Cells
We measured interferon-γ (IFN-γ) and interleukin 17A (IL-17A) memory responses against serotype 1, because T helper 17 (Th17) responses were previously shown to contribute to protection against pneumococcus colonization and IFN-γ responses generally increase after administration of T-cell dependent vaccines [25]. PBMC were collected in tandem with the aforementioned plasma samples and were cryopreserved for viability at local laboratories certified by the Immunology Quality Assurance Program (National Institutes of Health Division of AIDS) using the International Maternal Pediatric Adolescent AIDS Clinical Trials Network/AIDS Clinical Trials Group/HIV Prevention Trials Network standard operating procedure (https://www.hanc.info/resources/sops-guidelines-resources/laboratory/cross-network-pbmc-processing-sop.html). PBMC were shipped on liquid nitrogen to the testing laboratory. PBMC at 250 000 cells/well in dual-color FLUOROSPOT plates (Mabtech; catalog number FS-0103) were stimulated with 500 000 colony-forming units/well of pneumococcus serotype 1 (gift of Dr S. Pelton), medium, or 2 µg/mL phytohemagglutinin A (Sigma) overnight. Assays were revealed as per manufacturer’s instructions. Results were reported in spot-forming cells (SFC)/106 PBMC in pneumococcus serotype 1-stimulated or phytohemagglutinin A-stimulated wells after subtraction of background SFC in medium-stimulated wells.
Memory B Cells
Memory B cells were measured as previously described using a dual-color IgG/IgA FLUOROSPOT plates (Mabtech; catalog number FS-05R06G) with the following modification: the antigen wells were coated with 25ng/well pneumococcal polysaccharide 1 (American Type Culture Collection) [26]. Results were reported in SFC/106 PBMC.
Soluble Inflammatory Factors
V-PLEX Human Cytokine 30-plex kits (Meso Scale Discovery; catalog number K15054D) was used on plasma according to the manufacturer’s instructions.
Statistical Analysis
The primary outcomes in this report were antibody responses at 4 weeks after administration of PCV-10 or PPV-23 antepartum and postpartum. Outcome measures included antibody concentrations, frequency of ≥ 2-fold increase in antibodies postvaccination over prevaccination, and frequency of antibody concentrations ≥ 0.35 µg/mL (protective against IPD in infants), ≥1 µg/mL (arbitrary level frequently used in adults), and ≥ 4 µg/mL (associated with protection against pneumococcus colonization) [25, 27, 28]. Additional outcomes were IgG and IgA memory B cells and IFN-γ and IL-17A memory T cells to serotype 1. To identify the factors that contributed to the antipneumococcal antibody responses to vaccination, we performed multivariable regression analyses including variables significantly associated with antibody responses in univariate analyses, such as prevaccine antibody concentrations, type and timing of vaccine (PCV-10 vs PPV-23, antepartum vs postpartum), CD4+ and CD8+ T-cell counts, and plasma HIV viral load at the time of vaccination. In each model, the antibody concentrations after vaccination in the case of linear regressions, or the binary outcomes described above in the case of logistic regressions, were used as response variables. Antibodies and HIV RNA were log10 transformed.
For the inflammatory marker analyses, concentrations were log10 transformed and markers were grouped using principal component analysis. The first 5 principal components, which explained > 50% of the variance, were used as explanatory variables in linear regression models for each antibody serotype. Statistical analyses were performed using SAS version 9.4 (SAS Institute, Inc).
RESULTS
Characteristics of the Study Population
We enrolled 347 pregnant women with HIV, including 115 who received PCV-10, 115 PPV-23, 116 placebo, and 1 participant who did not receive study medication antepartum. Of the 116 antepartum placebo recipients, 53 received PCV-10 and 53 PPV-23 at 24 weeks postpartum (Figure 1). The demographic characteristics were similar in the PPV-23 and PCV-10 recipients at each time point (Table 1). Combining the vaccine groups, the following differences were observed in participants who were immunized antepartum versus postpartum: (1) the mean CD4+ T-cell counts was 590 cells/µL antepartum and 711 cells/µL postpartum; (2) mean CD8+ T cells/µL was 778 antepartum and 858 postpartum; (3) 62% of participants had HIV plasma RNA < 40 copies/mL antepartum versus 76% postpartum; and (4) 100% of women were on ART antepartum and 93% postpartum.
Demographic and HIV Disease Characteristics
| Characteristic | Antepartum | Postpartum | ||
|---|---|---|---|---|
| PCV-10 (n = 115) | PPV-23 (n = 115) | PCV-10 (n = 53) | PPV-23 (n = 53) | |
| Race, No. (%) | ||||
| Black | 51 (44) | 57 (50) | 23 (43) | 31 (58) |
| White | 24 (21) | 19 (17) | 12 (23) | 11 (21) |
| American Indian | 0 (0) | 0 (0) | 1 (2) | 0 (0) |
| Other | 40 (35) | 36 (31) | 16 (30) | 11 (21) |
| Unknown | 0 (0) | 3 (3) | 1 (2) | 0 (0) |
| Ethnicity, No. (%) | ||||
| Latino | 112 (97) | 110 (96) | 50 (94) | 53 (100) |
| Not Latino | 1 (1) | 1 (1) | 1 (2) | 0 (0) |
| Unknown | 2 (2) | 4 (3) | 2 (4) | 0 (0) |
| Age at randomization, y, mean (SD) | 27 (6) | 28 (6) | 29 (6) | 28 (6) |
| Gestational age at randomization, wk, mean (SD) | 26 (5) | 25.2 (5) | NA | NA |
| CD4+ T cell %, mean (SD)a | 32 (9) | 32 (9) | 33 (10) | 31 (11) |
| CD4+ T cells/µL, mean (SD)a | 596 (243) | 585 (257) | 716 (302) | 707 (385) |
| CD4+ T cells > 200 cells/µLa | 109 (95) | 113 (98) | 50 (94) | 49 (92) |
| CD8+ T cells/µL, mean (SD)a | 772 (279) | 785 (345) | 847 (364) | 869 (315) |
| HIV RNA copies/mL of plasmaa | ||||
| Median (Q1–Q3) | 39 (39–96) | 39 (39–103) | 39 (39–39) | 39 (39–82) |
| No. missing | 1 | 3 | 1 | 0 |
| HIV RNA < 40 copies/mL of plasmaa | ||||
| No. (%) | 72 (63) | 69 (62) | 41 (79) | 39 (74) |
| No. missing | 1 | 3 | 1 | 0 |
| ART, No. (%) | 115 (100) | 115 (100) | 50 (94) | 49 (92) |
Abbreviations: ART, antiretroviral therapy; HIV, human immunodeficiency virus; NA, not applicable; Q1 and Q3, 25th and 75th percentiles.
Obtained at the time of immunization.
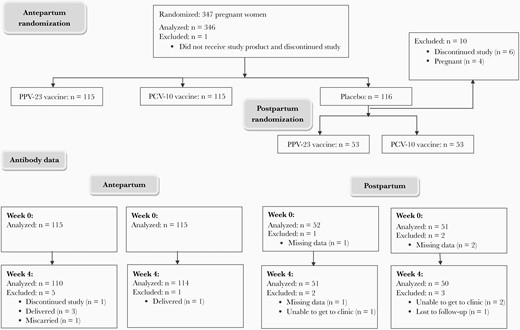
Consort diagram.
Immunogenicity of PCV-10 and PPV-23 Administered Antepartum or Postpartum
PCV-10 and PPV-23 robustly increased antibody concentrations against the vaccine serotypes tested both antepartum and postpartum, but antibody concentrations were generally lower antepartum compared to postpartum and in PCV-10 compared to PPV-23 (Figure 2 and Supplementary Table 1). To determine if these observations were independent of prevaccination antibody concentrations, which were also lower antepartum compared to postpartum, and to identify additional factors that contributed to the antibody responses to vaccination, we performed multivariable regression analyses including factors previously shown to be associated with antibody responses, such as CD4+ and CD8+ T-cell counts and plasma HIV load at the time of vaccination (Table 2) [17]. The adjusted analyses showed that high prevaccination antibody concentrations were significantly associated with increased concentrations postvaccination for all serotypes and with higher proportions of women reaching predefined response thresholds. In contrast, high prevaccination antibodies were associated with lower vaccine response rates defined by ≥ 2-fold increase in antibody concentration at 4 weeks postvaccination compared to prevaccination. Compared to postpartum, antepartum vaccination was significantly associated with lower antibody concentrations and/or lower odds of women reaching predefined response thresholds and/or lower vaccine response rates for 7 out of 8 serotypes tested. Overall, PCV-10 was less immunogenic than PPV-23 for serotypes 1, 6B, 7F, and 14, and more immunogenic for serotype 4. Higher CD4+ T-cell counts, lower CD8+ T-cell counts and/or lower HIV plasma viral load at the time of immunization were associated with higher antibody responses to 6 of 8 serotypes (1, 4, 7F, 14, 23F, and 33F).
Determining Factors of the Antibody Responses to Pneumococcal Vaccines in Women With HIV
| Serotype | Variable | No. Used | Linear Regressiona | Logistic Regressiona | ||||||||
|---|---|---|---|---|---|---|---|---|---|---|---|---|
| ≥2-Fold Rise | ≥0.35 µg/mL | ≥1 µg/mL | ≥4 µg/mL | |||||||||
| Coefficient (95% CI) | P Value | Odds Ratio (95% CI) | P Value | Odds Ratio (95% CI) | P Value | Odds Ratio (95% CI) | P Value | Odds Ratio (95% CI) | P Value | |||
| 1 | PCV-10 vs PPV-23 | 317 | −0.26 (−.35 to −.17) | <.001 | 0.38 (.22–.68) | .001 | 0.25 (.13–.46) | <.001 | ||||
| Antepartum vs postpartum | 317 | −0.25 (−.35 to −.16) | <.001 | 0.52 (.27–1.00) | .049 | 0.31 (.17–.57) | <.001 | |||||
| Prevaccine antibodiesb | 317 | 0.05 (.04–.06) | <.001 | 0.80 (.75–.87) | <.001 | 1.42 (1.24–1.63) | <.001 | 1.32 (1.22–1.42) | <.001 | 1.22 (1.14–1.31) | <.001 | |
| Prevaccine HIV RNA | 317 | −0.09 (−.15 to −.04) | 0.001 | 0.50 (.31–.81) | .005 | |||||||
| Prevaccine CD4 countsc | 317 | 1.17 (1.04–1.33) | .010 | 1.22 (1.09–1.37) | <.001 | |||||||
| 4 | PCV-10 vs PPV-23 | 313 | 0.40 (.31–.49) | <.001 | 5.35 (2.77–10.30) | <.001 | 5.59 (1.82–17.17) | .003 | 7.57 (3.94–14.55) | <.001 | 7.22 (3.83–13.60) | <.001 |
| Antepartum vs postpartum | 313 | −0.17 (−.27 to −.07) | <.001 | 0.37 (.18–.75) | .006 | 0.25 (.06–.97) | .045 | 0.47 (.23–.95) | .035 | |||
| Prevaccine antibodiesb | 313 | 0.07 (.06–.08) | <.001 | 0.85 (.79–.93) | <.001 | 1.77 (1.40–2.25) | <.001 | 1.44 (1.29–1.60) | <.001 | 1.33 (1.22–1.45) | <.001 | |
| Prevaccine HIV RNA | 313 | −0.10 (−.16 to −.04) | <.001 | 0.43 (.29–.65) | <.001 | |||||||
| Prevaccine CD4 countsc | 313 | 1.15 (1.04–1.26) | .007 | |||||||||
| 5 | Antepartum vs postpartum | 322 | −0.19 (−.28 to −.10) | <.001 | 0.41 (.25–.68) | <.001 | 0.27 (.09–.85) | .025 | 0.27 (.14–.54) | <.001 | 0.33 (.17–.65) | .001 |
| Prevaccine antibodiesb | 322 | 0.08 (.07–.09) | <.001 | 0.90 (.85–.95) | <.001 | 1.97 (1.63–2.38) | <.001 | 1.60 (1.44–1.79) | <.001 | 1.32 (1.19–1.46) | <.001 | |
| 6B | PCV-10 vs PPV-23 | 322 | 0.56 (.33–.96) | .033 | ||||||||
| Antepartum vs postpartum | 322 | 0.39 (.20–.74) | .004 | 0.38 (.17–.87) | .021 | |||||||
| Prevaccine antibodiesb | 322 | 0.08 (.07–.09) | <.001 | 0.92 (.87–.97) | 0.004 | 1.62 (1.38–1.91) | <.001 | 1.54 (1.39–1.72) | <.001 | 1.29 (1.21–1.37) | <.001 | |
| 7F | PCV-10 vs PPV-23 | 322 | −0.12 (−.21 to −.03) | 0.011 | 0.52 (.30–.89) | .017 | 0.51 (.28–.93) | .027 | ||||
| Antepartum vs postpartum | 322 | 0.53 (.29–.98) | .043 | |||||||||
| Prevaccine antibodiesb | 322 | 0.07 (.06–.09) | <.001 | 0.90 (.84–.96) | .002 | 1.69 (1.41–2.02) | <.001 | 1.41 (1.29–1.54) | <.001 | 1.32 (1.21–1.45) | <.001 | |
| Prevaccine CD8 countsc | 322 | 0.92 (.85–1.00) | .049 | |||||||||
| 14 | PCV-10 vs PPV-23 | 322 | 0.55 (.32–.94) | .029 | ||||||||
| Prevaccine antibodiesb | 322 | 0.06 (.05–.07) | <.001 | 0.90 (.87–.94) | <.001 | 1.46 (1.24–1.71) | <.001 | 1.42 (1.26–1.59) | <.001 | 1.30 (1.22–1.38) | <.001 | |
| Prevaccine CD4 countsc | 322 | 0.03 (.01–.05) | .010 | 1.12 (1.01–1.25) | .029 | |||||||
| 23F | Antepartum vs postpartum | 314 | −0.16 (−.26 to −.05) | .005 | 0.34 (.17–.66) | .001 | 0.50 (.28–.90) | .020 | ||||
| Prevaccine antibodiesb | 314 | 0.08 (.07–.09) | <.001 | 0.92 (.87–.98) | .009 | 1.61 (1.36–1.89) | <.001 | 1.49 (1.36–1.64) | <.001 | 1.28 (1.19–1.38) | <.001 | |
| Prevaccine CD8 countsc | 314 | −0.02 (−.03 to −.004) | .014 | 0.91 (.84–.99) | .021 | |||||||
| 33Fd | Antepartum vs postpartum | 155 | −0.23 (−.39 to −.08) | .003 | 0.26 (.07–.93) | .039 | ||||||
| Prevaccine antibodiesb | 155 | 0.07 (.06–.09) | <.001 | 1.63 (1.07–2.50) | .024 | 1.38 (1.18–1.61) | <.001 | 1.31 (1.18–1.45) | <.001 | |||
| Prevaccine HIV RNA | 155 | −0.12 (−.20 to −.04) | .005 | 0.52 (.32–.84) | .007 | |||||||
| Prevaccine CD4 countsc | 155 | 1.29 (1.11–1.50) | .001 | |||||||||
| Prevaccine CD8 countsc | 155 | 0.83 (.73–.95) | .006 | |||||||||
Only the variables significantly associated with the antibody responses are shown.
The regression analyses included vaccine type, antepartum vs postpartum administration; and antibody concentrations, plasma HIV RNA copies/mL, CD4+ and CD8+ T-cell counts prevaccination.
For 0.1 log10 µg/mL.
For 100 cells/mm3.
This serotype is present in the PPV-23 vaccine only.
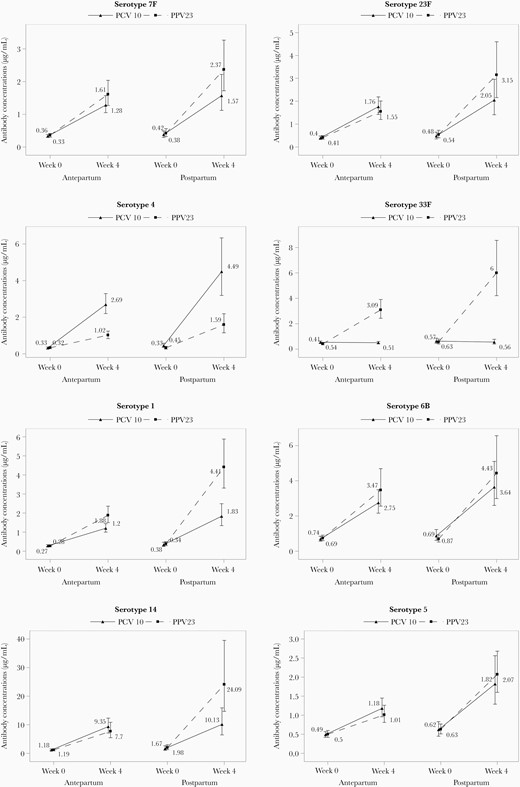
Antibody responses to PCV-10 and PPV-23 administered antepartum or postpartum. Data were derived from 336 women with HIV randomly assigned to PCV-10 antepartum (n = 115), PPV-23 antepartum (n = 115), PCV-10 postpartum (n = 53), and PPV-23 postpartum (n = 53). The following serotypes showed significant differences (P ≤ .03) in the unadjusted nonparametric comparison of week 4 postvaccination antibody concentrations antepartum versus postpartum: 1, PCV-10 and PPV-23; 4, PCV-10 and PPV-23; 5, PCV-10 and PPV-23; 7F, PPV-23; 14, PPV-23; 23F, PPV-23; and 33F, PPV-23. The following serotypes showed significant differences in the unadjusted comparison of PCV-10 versus PPV-23 antibody concentrations at 4 weeks after vaccination: 1, antepartum and postpartum; 4, antepartum and postpartum; 7F, postpartum; and 14, postpartum. Maternal geometric means and 95% confidence intervals are shown.
Antepartum and Postpartum Memory B- and T-Cell Responses to Serotype 1 After PCV-10 and PPV-23
We analyzed B- and T-cell memory responses to serotype 1 in a subset of 38 women who received PCV-10 and 37 PPV-23 antepartum, and in 35 women who received PCV-10 and 29 PPV-23 postpartum. The demographic characteristics of this subset did not appreciably differ from those of the entire study population (Supplementary Table 2). After exclusion of samples with poor PBMC viability, results were available for 17 PCV-10 and 17 PPV-23 antepartum vaccine recipients and for 18 PCV-10 and 14 PPV-23 postpartum recipients. Before antepartum vaccination, women had a median of 0 (range, 0–4) IgA and 2 (range, 0–34) IgG SFC/106 PBMC, and 6 (range, 0–172) IFN-γ and 4 (range, 0–144) IL-17A SFC/106 PBMC (Supplementary Table 3 presents results separated by vaccine). Corresponding numbers postpartum were 0 (range, 0–8) IgA and 2 (range, 0–26) IgG SFC/106 PBMC, and 10 (range, 0–164) IFN-γ and 6 (range, 0–128) IL-17A SFC/106 PBMC. Although a few participants had increases in memory B- and/or T-cell responses to serotype 1, overall, there were no appreciable increases in memory responses in any vaccine group (Supplementary Table 3).
Effect of Cytokines and Chemokines on Antibody Responses to PCV-10 and PPV-23
To investigate the potential effect of inflammatory markers on antibody responses to pneumococcal vaccines in women with HIV, we measured a panel of 30 cytokines/chemokines at 4 weeks after vaccination in 76 women vaccinated antepartum and 53 postpartum. The timing and sample size were dictated by convenience. The demographic characteristics of this subset of women did not appreciably differ from the parent groups (Supplementary Table 4). Five analytes, IL-8HA, granulocyte-macrophage colony-stimulating factor (GM-CSF), IL-1β, tumor necrosis factor-β (TNF-β), and IL12p40, were excluded from analysis due to ≥ 30% of the samples below the lower level of quantification of the assay or redundancy with other analytes. Supplementary Table 5 shows the concentrations of the remaining 25 analytes. To reduce the dimensionality of the dataset, cytokines/chemokines were grouped using principal component analysis (Table 3) [29]. Next, we assessed the relationship between antibody concentrations at week 4 postvaccination with each principal component in a regression analysis that also included vaccine type, prevaccination antibody concentrations, numbers of CD4+ and CD8+ T cells/µL, and HIV plasma RNA copies/mL at the time of vaccination (Table 4). Antibody responses for 6 of 8 serotypes showed significant effects of 1 or more of the principal components in which the cytokines/chemokines were grouped, but only after postpartum vaccination. Overall, principal components with high positive loadings for IL-2, IL-6, IL-13, IL-12p70, and/or IL-17A and negative loadings for IL-7, CC chemokine ligand 11 (CCL-11), CCL-13, and CCL-17 were associated with higher antibody responses, whereas principal components with high positive loadings for IL-1α, IL-5, CCL-3, and CCL-4 and negative loadings of IL-12/p70, IL-16, and IL-2 were associated with lower antibody responses. The effect of cytokines/chemokines that positively loaded on principal components with both positive and negative associations with the antibody production were considered uninterpretable.
Biomarker Principal Component Eigenvectors
| Biomarker, pg/mL | Principal Components Antepartum | Principal Components Postpartum | ||||||||
|---|---|---|---|---|---|---|---|---|---|---|
| 1 | 2 | 3 | 4 | 5 | 1 | 2 | 3 | 4 | 5 | |
| CCL-11 | 0.26 | 0.36 | −0.04 | 0.12 | −0.15 | 0.32 | −0.22 | −0.29 | 0.01 | −0.10 |
| CCL-13 (MCP-4) | 0.24 | 0.37 | −0.01 | 0.14 | −0.07 | 0.37 | −0.23 | −0.19 | 0.06 | 0.04 |
| CCL-17 | 0.11 | 0.24 | −0.01 | −0.10 | 0.43 | 0.21 | −0.33 | 0.14 | −0.09 | −0.06 |
| CCL-2 (MCP-1) | 0.15 | 0.26 | −0.17 | 0.23 | 0.15 | 0.26 | −0.09 | −0.31 | −0.08 | −0.04 |
| CCL-22 (MDC) | 0.02 | 0.20 | 0.10 | −0.10 | 0.27 | 0.12 | −0.004 | 0.04 | −0.12 | 0.03 |
| CCL-26 (Eotaxin 3) | 0.26 | 0.30 | −0.10 | 0.19 | −0.20 | 0.33 | −0.20 | −0.23 | 0.12 | −0.002 |
| CCL-3 (MIP-1α) | 0.38 | −0.16 | −0.08 | −0.15 | −0.04 | 0.12 | 0.10 | −0.10 | 0.15 | 0.32 |
| CCL-4 (MIP-1β) | 0.34 | −0.15 | −0.31 | −0.11 | 0.01 | 0.11 | −0.12 | 0.12 | 0.28 | 0.35 |
| CXCL-10 (IP-10) | 0.14 | 0.00 | 0.44 | 0.18 | 0.16 | 0.32 | 0.23 | 0.07 | 0.03 | −0.03 |
| IFN-γ | 0.18 | −0.22 | 0.13 | 0.30 | 0.04 | 0.24 | 0.29 | 0.05 | 0.07 | 0.001 |
| IL-10 | 0.09 | −0.04 | −0.07 | 0.29 | 0.22 | 0.27 | 0.25 | −0.11 | −0.10 | 0.12 |
| IL-12p70 | 0.11 | −0.30 | −0.05 | 0.34 | −0.21 | 0.08 | 0.06 | 0.29 | 0.35 | −0.24 |
| IL-13 | 0.05 | −0.19 | −0.09 | 0.20 | 0.09 | 0.04 | −0.07 | 0.22 | 0.55 | −0.06 |
| IL-15 | 0.12 | 0.01 | 0.17 | −0.01 | 0.08 | 0.13 | 0.18 | 0.19 | −0.07 | 0.31 |
| IL-16 | −0.02 | 0.17 | 0.32 | 0.18 | −0.12 | 0.17 | −0.04 | 0.15 | −0.15 | −0.24 |
| IL-17A | −0.005 | −0.21 | 0.15 | 0.37 | 0.35 | 0.12 | 0.38 | 0.07 | −0.04 | −0.12 |
| IL-1α | 0.21 | 0.003 | 0.41 | −0.19 | −0.20 | 0.05 | 0.05 | 0.14 | −0.39 | 0.40 |
| IL-2 | 0.14 | −0.15 | 0.15 | 0.01 | 0.05 | 0.09 | 0.27 | 0.14 | 0.03 | −0.26 |
| IL-4 | 0.16 | 0.04 | −0.04 | 0.30 | −0.22 | −0.09 | 0.03 | −0.02 | 0.31 | 0.26 |
| IL-5 | 0.07 | −0.21 | 0.21 | −0.02 | −0.06 | 0.04 | 0.07 | 0.13 | −0.10 | 0.36 |
| IL-6 | 0.10 | −0.09 | 0.04 | −0.15 | 0.33 | 0.17 | 0.22 | −0.07 | 0.23 | 0.17 |
| IL-7 | 0.22 | 0.12 | 0.03 | −0.12 | 0.38 | 0.14 | −0.30 | 0.39 | −0.18 | 0.04 |
| IL-8 | 0.34 | −0.13 | −0.26 | −0.23 | −0.04 | 0.15 | −0.17 | 0.20 | 0.11 | 0.14 |
| TNF-α | 0.31 | −0.27 | −0.03 | −0.07 | 0.03 | 0.30 | 0.24 | 0.10 | −0.13 | −0.20 |
| VEGF-A | 0.22 | 0.03 | 0.40 | −0.25 | −0.17 | 0.13 | −0.17 | 0.46 | −0.08 | −0.07 |
| Explained variation, % | 16.63 | 12.22 | 8.54 | 7.30 | 7.03 | 19.25 | 11.36 | 9.28 | 7.64 | 6.89 |
The table shows the eigenvectors (weights) of the different cytokines/chemokines on principal components 1–5. Weights indicate the relative importance of each cytokines/chemokines in forming each of the first 5 principal components. Loadings with magnitude ≥ 0.2 are shown in bold because they were considered substantial.
Abbreviations: CCL, CC chemokine ligand; CXCL, C-X-C motif chemokine ligand; IFN-γ, interferon-γ; IL, interleukin; IP-10, inducible protein 10; MCP, monocyte chemoattractant protein; MDC, macrophage-derived chemokine; MIP, macrophage inflammatory protein; TNF-α, tumor necrosis factor-α; VEGF-A, vascular endothelial growth factor A.
Effect of Cytokines/Chemokines on Pneumococcal Antibody Responses to Postpartum Vaccination
| Serotype | Variable | No. Used | Linear Regressiona | |
|---|---|---|---|---|
| Coefficient Estimates (95% CI) | P Value | |||
| 1 | Principal component 4 | 51 | 0.10 (.02 to .18) | .012 |
| 4 | Principal component 1 | 49 | −0.06 (−.12 to −.01) | .014 |
| Principal component 4 | 49 | 0.11 (.02 to .20) | .016 | |
| Principal component 5 | 49 | −0.09 (−.17 to −.01) | .026 | |
| 5 | Principal component 4 | 51 | 0.07 (.01 to .14) | .027 |
| 7F | Principal component 2 | 51 | 0.08 (.01 to .16) | .030 |
| Principal component 4 | 51 | 0.15 (.06 to .25) | .003 | |
| 14 | Principal component 4 | 51 | 0.14 (.001 to .27) | .048 |
| 23F | Principal component 5 | 47 | −0.09 (−.17 to −.01) | .031 |
Principal components 1, 2, and 5 were associated with lower antibody responses. These principal components included overall substantial positive loadings of CCL-2, CCL-3, CCL-4, CCL-26, CXCL-10, IL-1α, IL-4, IL-5, IL- 6, IL-10, IL-13, IL-15, IFN-γ, and TNF-α, suggesting that these cytokines and chemokines were associated to lower antibody responses. Principal components 1, 2, and 5 also included substantial negative loadings of IL-7 and IL-16, suggesting that these cytokines were associated with higher antibody responses. Conversely, principal component 4 was associated with higher antibody responses and included substantial positive loadings of CCL4, IL-12p70, IL-13, IL-4, and IL-6, and negative loading of IL-1α.
Abbreviations: CCL, CC chemokine ligand; CXCL, C-X-C motif chemokine ligand; IFN-γ, interferon-γ; IL, interleukin; TNF-α, tumor necrosis factor-α.
The regression analysis included cytokine/chemokine principal components, vaccine type, prevaccination antibody levels, plasma HIV RNA, and CD4+ and CD8+ T-cell counts
DISCUSSION
Our study showed that antibody responses to both PCV-10 and PPV-23 were notably higher, both from statistical and biological standpoints, when the vaccines were administered postpartum compared with antepartum after controlling for potential confounders in the statistical analysis. It is important to note that the volume of antibody distribution was higher antepartum versus postpartum. This difference most likely affected the antibody concentrations, but not the antibody fold-rise postvaccination compared with prevaccination. Previous studies comparing immunogenicity of vaccines in pregnant and nonpregnant women were restricted to influenza vaccines [30, 31]. These studies were not randomized and showed conflicting results across influenza strains in the vaccines and in the comparison of antepartum with postpartum immunization. Our study was the first to compare antepartum and postpartum vaccine responses in a randomized trial setting, which increased the likelihood of evaluating a homogeneous population antepartum and postpartum. Other differences that may have contributed to the discrepant results between our and previous studies included the antigens (pneumococcus versus influenza) and the fact that our participants had HIV infection. Of note, although PPV-23 is deemed to generate T-cell–independent antibody responses, both PCV and influenza vaccines are deemed to generate T-cell–dependent antibody responses. Collectively, our results suggest that the immunogenicity of the pneumococcal vaccines antepartum compared with postpartum may derive from the immune suppression that accompanies pregnancy [31].
Our study compared for the first time the immunogenicity of vaccines administered to women with HIV antepartum versus postpartum. Previous reports indicated much lower compliance with ART postpartum compared with antepartum, with accompanying increase of viral replication and deterioration of the immune system [22]. Because responses to vaccines in people with HIV generally increase with control of HIV replication, this observation has prompted providers to preferentially complete immunizations antepartum. However, in our study, most participants continued on ART postpartum, the proportions of women with virologic control and the mean percentage of CD4+ T cells were similar antepartum and postpartum, and the mean CD4+ and CD8+ T cells were higher postpartum compared with antepartum. These results support postpartum administration of vaccines that are not specifically recommended in pregnancy. Additional studies are needed to confirm our results and identify the vaccines that may benefit from postpartum administration.
A surprising finding in our study was that PPV-23 generated higher antibody concentrations than PCV-10 against most pneumococcus serotypes common to both vaccines and lower concentrations against a single serotype. Previous studies in people with HIV showed similar or higher antibody responses to PCV-7 compared with PPV-23 [11, 32]. Our study population consisted of young women, including ≥ 92% participants with CD4+ T-cell counts > 200 cells/µL, which may explain some of the differences between our and previous results. Although our study is the first to compare PCV-10 with PPV-23 in people with HIV, previous investigations showed similar immunogenicity of PCV-10 compared to PCV-7 or PCV-13 in children, suggesting that the type of PCV might not have played a role in the discrepancy between our results and those of previous studies [33, 34]. Moreover, we previously reported that the persistence of antibodies generated by the 2 vaccines was similar and in the current study neither vaccine generated memory B- or T-cell responses against serotype 1, failing to establish advantages of one vaccine over the other [17]. We also measured and previously reported similar opsonophagocytic activity indices after antepartum vaccination with PCV-10 or PPV-23 [17]. Because opsonophagocytic activity is considered the best measure of antipneumococcal antibody functionality, our findings indicate that PCV-10 and PPV-23 generate antibodies with similar functionality in young women with HIV on ART [35]. Collectively, these results show that the administration of PCV-10 to young women with HIV on ART may not have any advantages compared with PPV-23.
An important feature of HIV pathogenesis is inflammation. In fact, most of the complications of HIV infection in people on effective ART have been ascribed to persistent inflammation. Previous studies showed negative associations between high plasma inflammatory markers and antibody responses in older adults, including people with and without HIV [36]. Our investigation showed both positive and negative associations of plasma levels of cytokines and chemokines with antipneumococcal antibody responses, but only postpartum. Among the analytes positively correlated with antibody production, IL-2, IL-6, and IL-13 are known to increase B-cell function and IL-12p70 to stimulate Th1 cells, suggesting a direct relationship with antibody responses to vaccination, including T-cell–dependent antibody responses. Among cytokines/chemokines associated with lower production of antibodies, IL-1α is a bona fide inflammatory cytokine, suggesting that increased inflammation may decrease antibody responses to vaccines.
Limitations of this study included measuring antibody and B- and T-cell memory responses against a single serotype. Moreover, the poor quality of many of the PBMC collected for B- and T-cell memory responses substantially decreased our ability to obtain robust results.
In conclusion, the immunogenicity of both PPV-23 and PCV-10 were highest postpartum, and when HIV replication and CD8+ T-cell counts were low and CD4+ T-cell counts were further restored, which generally occurs a few months after initiation of ART. However, delaying pneumococcus immunization in pregnant women with HIV needs to be balanced against the risk of intercurrent IPD. A potential strategy to mitigate the decreased immunogenicity of vaccines during pregnancy may be to administer an additional dose postpartum. This strategy deserves to be further studied, as well as the optimal schedule of administration of other vaccines recommended in women with HIV that are not specifically indicated during pregnancy. In addition, we found that PPV-23 was at least as immunogenic as PCV in women with HIV on ART, but had broader pneumococcus serotype coverage, suggesting that administration of PPV-23 may be prioritized in this group.
Supplementary Data
Supplementary materials are available at The Journal of Infectious Diseases online. Supplementary materials consist of data provided by the author that are published to benefit the reader. The posted materials are not copyedited. The contents of all supplementary data are the sole responsibility of the authors. Questions or messages regarding errors should be addressed to the author.
Notes
Acknowledgments. We thank Dr Helena Keiko Sato from the Centro de Vigilância Epidemiológica da Secretaria da Saúde do Estado de São Paulo for donating the PCV-10 doses used for maternal immunization; Drs George Siberry, Heather Watts, and Elizabeth Smith, and the IMPAACT network for their support in the early development of this study; Ms Bonnie Zimmer for data management; Dr David Goldblatt for overseeing the ELISA antibody testing; and Drs John Moye and Robert Harris for critical review of the manuscript.
Participating clinical sites and personnel. Instituto de Puericultura e Pediatria Martagão Gesteria, Principal Investigator, Ricardo Hugo Oliveira, MD and Study Coordinator, Maria Chermont Sapia, MD; Site 5072, Hospital Federal dos Servidores (Rio de Janeiro), Principal Investigator, Esau Custodio Joao, MD, PhD and Study Coordinator, Leon Claude Sidi, MD; Site 5073, Federal University of Minas Gerais (Belo Horizonte), Principal Investigator, Jorge Pinto, MD and Study Coordinator, Flavia Faleiro, MD; Site 5074, University of Sao Paulo-Ribeirão Preto Medical School, Principal Investigator, Marisa Mussi-Pinhata, MD and Study Coordinator, Conrado Milani Coutinho, MD; Site 5084, Universidade de Caxias do Sul, Principal Investigator, Rosa Dea Sperhacke, PharmD, PhD and Study Coordinator, Silva Mariani Costamilan, BS, RN; Site 5097, Hospital Geral de Nova Iguaçu, Principal Investigator, José Henrique da Silva Pilotto, MD and Study Coordinator, Gisely Gonçalves Falco, RN; Site 5098, Hospital Santa Casa Porto Alegre Brazil, Principal Investigator, Regis Kreitchmann, MD and Study Coordinator, Maria Fernanda Severini, PharmB, MS; Site 5117, Hospital Nossa Senhora da Conceicão, Principal Investigator, Breno Riegel Santos, MD and Study Coordinator, Rita Lira, MD; and Westat, Clinical Research Associate/Pharmacist, Adriana Ferreira, PharmD, MBA, CCRA.
Disclaimer. The content of the manuscript is solely the responsibility of the authors and does not necessarily represent the official views of the funding agency.
Financial support. This work was supported by the Eunice Kennedy Shriver National Institute of Child Health and Human Development (grant number HHSN275201800001I).
Potential conflicts of interest. A. W. receives grants from National Institutes of Health (NIH), Merck, GSK, and Janssen. N. C. is employed by NIH. S. I. P. receives personal fees from Merck, Sanofi, and Pfizer; and receives grants from NIH and Pfizer. All other authors report no potential conflicts. All authors have submitted the ICMJE Form for Disclosure of Potential Conflicts of Interest. Conflicts that the editors consider relevant to the content of the manuscript have been disclosed.
References

