


Abstract
In most polygynous species, males compete for access to females using agonistic interactions to establish dominance hierarchies. Typically, larger and stronger males become more dominant and thus gain higher mating and reproductive success over subordinate males. However, there is an inherent trade-off between time and energy invested in dominance interactions versus courtship and mating activities. Individuals may overcome this trade-off by selectively engaging in more effective mating tactics. North American bison (Bison bison) are a species of conservation concern that exhibit female-defense polygyny with two predominant mating tactics: (1) tending individual females; or (2) challenging tending males as a satellite and then mating opportunistically. Here, we use social network analysis to examine the relationship between position in the agonistic interaction network of bison males and their mating, reproductive success, and reproductive tactics and effort. To assess the potential for social network analysis to generate new insights, we compare male (node) centrality in the interaction network with traditional David’s score and Elo-rating dominance rankings. Local and global node centrality and dominance rankings were positively associated with prime-aged, heavy males with the most mating success and offspring sired. These males invested more effort in the “tending” tactic versus the “satellite” tactic, and they tended more females for longer periods during peak rut, when most females were receptive. By engaging in the most effective mating tactic, dominant males may mitigate the trade-off between allocating time and energy to agonistic interactions that establish dominance, versus courtship and mating. While less dominant males participated more in the alternative mating tactic, network analysis demonstrated that they were still important to the interaction network on both a local and global scale.
“Dominance” and its counterpart, “subordinance,” can be defined as a relationship between two individuals in which one defers to the other in contest situations, with each participant making a compromise based on the fitness costs and benefits incurred (Kaufmann 1983). The outcome of agonistic interactions is the dominance hierarchy of a social group. From a functional perspective, dominance status determines priority of access to resources in short supply, with both contestants minimizing time, energy, and risk of injury by entering into the dominant–subordinate relationship (Kaufmann 1983). For reproductive males of polygynous mammals, access to receptive females often is an important limited resource. Sexual selection arises from differences in reproductive success via two mechanisms: intersexual mate choice and intrasexual competition for mates (Darwin 1871; Andersson 1994). In the most common cases of intrasexual selection, males compete for females through ritualized displays, physical contests, and other agonistic interactions in which dominance status is determined by age, mass, and competitive ability (Clutton-Brock et al. 1982; McElligott et al. 2001; Chunwang et al 2004; Roden et al. 2005; Pelletier and Festa-Bianchet 2006). To assess the competitive ability of rivals, males either evaluate the current fighting strength of their opponents each time they meet, or base their evaluation on past encounters to avoid repeated aggressive, and potentially costly, interactions.
In the majority of polygynous ungulates, fighting and other agonistic interactions coincide with mating activities during the breeding season (Willisch and Neuhaus 2010). In many species, reproductive effort involves fighting with other males for access to females, patrolling territories, displaying, and guarding females (Lott 1979; Clutton-Brock et al. 1982; Hogg 1984; Mysterud et al. 2004; Pelletier et al. 2006; Roden et al. 2011; Willisch et al. 2012). In these societies, the most dominant males typically have the greatest access to females and thus the highest mating success and reproductive success (e.g., Ellis 1995). Therefore, sexual selection should strongly favor males that fight for dominance and court females for matings. However, alternative mating tactics may complicate the situation by enabling subordinate males to breed as well (Stearns 1989; Ellis 1995; Gross 1996; Morrell 2004; Mysterud et al. 2004; Isvaran 2005; Garland 2014). Furthermore, success in obtaining copulations (matings) does not guarantee success in producing offspring, and copulations alone do not necessarily predict reproductive success (Mooring and Penedo 2014). Thus, males face a trade-off between mating with females versus competing with other males to establish dominance and ensure future access to females. The more time and energy an individual invests in establishing dominance status, the less time and energy they have to search for and court a possible mate—a classic trade-off (Kodric-Brown 1988; Santangelo et al. 2002). Males may reduce the negative impact of this trade-off by investing effort in the most effective reproductive tactic and/or by selecting the most fecund females. Here we examine whether dominant bison males engage in selective mating behaviors that are more likely to produce offspring. We use a social network approach to examine the status of males in a network of agonistic interactions in relation to their mating success, reproductive success, and reproductive effort put into effective mating tactics.
Review of bison reproduction and dominance
North American bison (Bison bison) live in sexually segregated groups for the majority of the year: adult males roam in small bachelor herds or singly until late spring when they aggregate with the larger female and offspring groups at the start of the breeding season called the “rut.” The rut generally starts with the first copulation in late June and runs through late September, with occasional breeding as late as December; however, the majority of breeding occurs during an intense, 6-week season in July and August (Lott 1981; Meagher 1986). Bison exhibit male-dominance female-defense polygyny in which a mature male guards (“tends”) a female from rival males until she comes into estrus and they breed, or until he is displaced by a more dominant male or he loses interest (Wolff 1998; Lott 2002). During tending, males invest time and energy into producing a variety of threat and dominance displays to deter the approach of rival males, including bellow vocalizations, scent-urination, pawing, rubbing, and wallowing (Lott 1974, 1979; Berger and Cunningham 1991; Wyman et al. 2012). Copulations take less than 10 s but afterwards the male guards the female anywhere from a few minutes to several hours before searching out new mates (Lott 1981; Wolff 1998). Second matings within an estrous period are rare among females (Mooring and Penedo 2014), indicating that postcopulatory guarding against rival or sneaker males may serve to reduce the loss of reproductive output via sperm competition. Tending males are challenged frequently by rival males, with whom they may engage in physical fights if signaling alone is not sufficient to establish dominance (Mooring et al. 2004, 2006a). Males that are unable to compete successfully to gain tending status may exhibit an alternative mating tactic in which they become a “satellite” and challenge tending pairs until they are able to defeat an exhausted tending male, opportunistically copulate with the female when the tending male is distracted with a rival, or give chase when the female runs away. Tending and satelliting can be considered alternative mating tactics within a conditional strategy (Taborsky et al. 2008). Wolff (1998) found that the tending tactic produced 10 times more matings a year than the satellite tactic.
Studies of large, naturalistic herds of wild bison have reported that the dominance hierarchy of males is nonlinear, transitory, and unstable over the course of the breeding season (Lott 1979), with frequent challenges and many rank reversals. King et al. (2019) described similar “frequently shifting” dominance structures in a smaller, semiwild reintroduced herd. During the hectic 6-week breeding peak, male competitive ability is constantly changing, and the most successful males must accurately judge which rival males they can displace to gain copulations (Wyman et al. 2008, 2012). These vigorous breeding activities eventually result in elevation of glucocorticoid stress hormones, exhaustion, and subsequent rank loss by dominant males (Mooring et al. 2006b; King et al. 2019). Male physical condition deteriorates as the rut progresses, with males bellowing less frequently (Berger and Cunningham 1991) and at lower amplitudes (Wyman et al. 2008) due to fatigue and spending less time foraging or resting (Mooring et al. 2006a). Males that retire from the breeding herds remain solitary for a period or join bachelor groups of males. Although some breeding takes place into late fall and early winter, most females have bred by the end of August. The peak rut is short-lived, high-stakes, physically demanding, and chaotic—it is no wonder that male dominance structure at this time has been described as “tumultuous” and “volatile” (King et al. 2019).
Social network analysis
Because of its inherent unstable and reported nonlinear nature, the dominance hierarchy of bison males is a good candidate for social network analysis. Social network theory (Wey et al. 2008; Pinter-Wollman et al. 2014; Krause et al. 2015) has provided useful advances that expand the traditional dominance hierarchy approach (McDonald and Shizuka 2012; Shizuka and McDonald 2012; Hobson and DeDeo 2015; Holekamp and Strauss 2016). Network measures take into account a comprehensive view of all the interactions that form dominance relationships as well as the position of an individual within the entire social network. There is growing use of social network analysis to quantify the dominance relationships in social species, especially when dominance relationships are nonlinear, because the formation of dominance relationships is more nuanced than previously believed (Chase et al. 2002; So et al. 2015). Dominance relationships emerge from both individual interactions and group dynamics (Dey and Quinn 2014; Wooddell et al. 2019). Some studies have recommended the use of network analysis for the study of dominance in social systems because it provides new tools for comparative studies across species (Shizuka and McDonald 2015) or because conventional measures of dominance are inadequate to fully depict the complexity of social relationships within a group (Funkhouser et al. 2018).
Previous studies of bison dominance utilized conventional measures of dominance, such as the proportion of “wins” over the total number of agonistic interactions (Mooring et al. 2006a; Wyman et al. 2008; Mooring and Penedo 2014) or “fighting ability” (Wolff 1998). To our knowledge, only one previous bison study has used a social network approach (Ramos et al. 2019), but with only eight captive adult females and no adult males, in contrast with the large, mixed-sex wild bison herd we study here. We take a social networks approach to explore the male dominance structure in a wild bison herd and its relation to mating, reproductive success, reproductive tactics, and effort. We use two local (out-degree and strength) and two global (closeness and betweenness) network measures of node centrality to test our dominance-related predictions. We acknowledge that these measures are not a direct substitute for traditional dominance rankings but instead represent a more comprehensive approach to quantifying the position of each male within the network of agonistic interactions. To assess the potential for social network analysis to generate new predictions and insights not available through traditional dominance scores, we compare social network measures with dominance measures derived from two common dominance ranking methods, David’s score and Elo-rating (David 1987; Albers and de Vries 2001; Gammell et al. 2003; Neumann et al. 2011).
Conservation applications
The study of animal behavior has been recognized as important for wildlife conservation because of the links that behavioral ecologists can make between behavior and the population dynamics of threatened species (Blumstein and Fernandez-Juricic 2010; Caro and Sherman 2011, 2013; Bro-Jørgensen et al. 2019; Tobias and Pigot 2019). In particular, animal social network analysis can improve our understanding of how social behavior contributes to population survival (Webber and Vander Wal 2019). Bison are listed as “Near Threatened” by the IUCN Red List; they are threatened by: artificial selection for market traits; inbreeding in small populations; cattle gene introgression; genetic loss through hybridization; small population effects and loss of genetic diversity; habitat loss; lack of full range of natural selection; and ecological extinction (Freese et al. 2007; Hedrick 2009; Gates et al. 2010; Sanderson et al. 2010; Aune et al. 2017). Given the conservation importance of bison, improved understanding of how male agonistic interactions and mating efforts influence reproduction and population growth would be valuable for bison managers.
Hypotheses and predictions
First, we tested the hypothesis (Table 1: Hypothesis 1) that network measures would identify as dominant males those that are central in the agonistic interaction networks, would be “prime-aged” (generally 7–12 years) and heavy compared to other males, similar to traditional dominance measures (Maher and Byers 1987; Wilson et al. 2002; Mooring et al. 2004; Wyman et al. 2012; Mooring and Penedo 2014). Specifically, we predicted that centrality in the network of agonistic interactions will peak in prime-aged males and show a positive relationship with mass. Next, we used network analysis to test the hypothesis (Hypothesis 2: Fig. 1A) that central males have higher mating success (copulations) and reproductive success (offspring sired) than peripheral males. Lastly, we tested the hypothesis (Hypothesis 3; Fig. 1B) that central males invest their time in the most effective mating tactic (i.e., maintaining access to females through tending). We predicted that there would be a positive relationship between node centrality and tending behaviors (mate guarding) and a negative or no relationship between node centrality and the alternative satellite reproductive tactic, which carries a lower fitness benefit (Wolff 1998). Furthermore, because intense agonistic activity results in significant energetic losses over the course of the breeding season (Berger 1989; Wolff 1998; Mooring et al. 2006b) and fewer females are in estrus later in the season (Berger 1989), we expect the positive relationship between node centrality and tending behavior to dissipate over time (Fig. 1B).
Hypotheses and predictions tested in this study.
| Hypotheses and predictions | Level of support |
|---|---|
| Hypothesis 1: Socially dominant males are prime-aged and heavy. • Prediction 1.1: Node centrality in the dominance structure will peak in prime-aged males, and there will be a positive relationship between node centrality measures and mass. | Full support |
| Hypothesis 2: Dominance is positively related to mating and reproductive success (Fig. 1A). • Prediction 2.1: There will be a positive relationship between node centrality in the dominance structure and number of matings. | Full support |
| • Prediction 2.2: There will be a positive relationship between node centrality in the dominance structure and number of offspring sired. | Full support |
| Hypothesis 3: Socially dominant males invest strongly in successful mating tactics (Fig. 1B). • Prediction 3.1: There will be a positive relationship between node centrality in the dominance structure and participation and effort in the tending mating tactic. | Full support |
| • Prediction 3.2: There will be a negative or no relationship between node centrality and participation in the alternative satellite mating tactic. | Conflicting support |
| • Prediction 3.3: The positive relationship between node centrality and tending behavior will diminish with time during the breeding season. | Partial support |
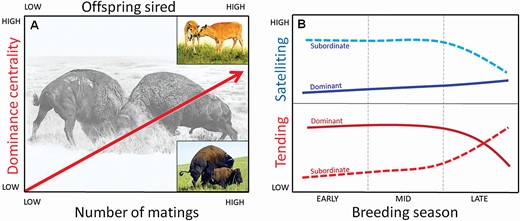
(A) Conceptual illustration of Hypothesis 2 (Table 1), which predicts that there will be a positive relationship between social centrality of bison males and number of matings (prediction 2.1, bottom axis) and a positive relationship between centrality and number of offspring sired (prediction 2.2, top axis). Paintings of fighting males (background) and bison calves (upper right insert) by Emma Mooring; photo of mating bison (lower right insert) by M. Mooring. (B) Conceptual illustration of Hypothesis 3 (Table 1) regarding tending effort (lower panel in red) and “satelliting” effort (upper panel in blue) for dominant (solid lines) and subordinate (dashed lines) bison males. During peak breeding season (early–mid), dominant males are predicted to mainly invest in tending females (prediction 3.1) while subordinates invest in satelliting (prediction 3.2). During the late breeding season, dominants are predicted to reduce tending effort as they become exhausted, lose dominance status, and eventually retire from breeding (prediction 3.3) while subordinates gain dominance status and potentially switch to tending the remaining estrus females.
Materials and Methods
Study site
The study was carried out between June–September 2004 on North American plains bison, at the 77 km2 Fort Niobrara National Wildlife Refuge (FTN) in the Nebraska Sandhills, United States (42°53.65′N, 100°28.47′W). The refuge maintained a population of 350 bison aged 1–23 years that increased to over 400 during the calving season. Every bison in the population was individually identified using a brand marking. At any given time during the study, the herd contained > 100 potentially breeding males (≥ 2 years old). For more details on the study site and herd, see Mooring (2004, 2006a), Wyman et al. (2008, 2012), and Mooring and Penedo (2014).
Measures of male mass, age, and reproductive success
Mass was measured in late September 2004 using a hydraulic squeeze chute containing a built-in scale. A random selection of 42 males were weighed as it was not possible to measure mass for all individuals in the population. Exact ages were available for all bison through the unique brands and FTN records. The number of offspring sired by each male was determined by genetic paternity analysis from tissue biopsies and/or blood and tail hair samples collected from all individuals in the herd, including calves born the following year. Forty-four microsatellite markers were used to assign parentage through an exclusion selection process that required at least two loci to exclude possible sires or dams. Details on the genetic analysis can be found in Mooring and Penedo (2014).
Behavioral observations of tending and mating
Observations of mating and agonistic behaviors were carried out from 4WD vehicles to which the bison were habituated and from which brand numbers could be read using binoculars. We maintained continuous surveillance of the herd during daylight hours (~0600 to ~2000 h) as detailed elsewhere (Mooring et al. 2004, 2006a; Wyman et al. 2008, 2012; Mooring and Penedo 2014). Throughout the season, we recorded copulations, tending of females, and attending satellite behaviors, as mating-related behaviors by bison males. A copulation between a male and female was recorded when (1) the copulation event was observed directly, or (2) the copulation event could be confidently inferred via postcopulatory evidence of a female “tail-up” display (i.e., female displaying an elevated tail—Lott 1981) along with observations of the same male accompanying the female before and after the display was observed (inferred copulation—Berger and Cunningham 1994; Wolff 1998). We recorded such inferred copulations only if the tail-up display was accompanied by additional indications of copulation such as: swollen vulva, presence of vaginal secretions, and frequent squatting and urination by the female. We defined “number of matings” as the number of observed and inferred copulations by a given male during the season.
A tending pair was recorded when a male stood parallel to a female and followed her movements closely, attempting to exclude competitors from the female (Lott 1974, 1981). Tending pairs were accounted for every 1–2 h. We used three measures to characterize the tending behavior of a male: (1) number of unique females tended; (2) “number of tending days,” defined as the total number of days in a period during which a male tended any female, with no more than 4 days elapsing between tending observations; and (3) “number of tending observations per female” defined as the average number of times a given male was seen tending each of the females it tended. Number of tending days provides information on seasonal investment in tending, while number of tending observations per female provides a fine-grained examination of the investment of a given male in each female it tended. The identities of any attending satellite males also were recorded, defined as single males standing within 30 m of a tending pair while closely focusing on them in an actively vigilant manner and interacting with the tending male through bellow and wallow displays. We calculated the total number of satellite males attending a male during the reproductive season, and the total number of tending males that a male “satellited” throughout the season.
Dominance and social network measures
To determine the dominance relationship among males, we recorded agonistic interactions opportunistically during our daily observations. We used network analysis to quantify these interactions. Agonistic interactions included both direct and indirect interactions. Direct agonistic interactions were defined as one male directly approaching another within two body lengths, resulting in one of the males turning or backing away using at least two steps. The first male to submit in this way was termed the “loser” of this aggressive encounter and the other was termed the “winner” (Komers et al. 1992). Indirect agonistic interactions were defined as a tending male (the “winner”) being actively attended to by a satellite male (the “loser”). Indirect interactions were included in the social network analysis because they represent important interactions that occur consistently throughout the rut and are often accompanied by dominance displays (e.g., visual and scent displays, wallowing, bellowing). In these tender-satellite male dyads, the tending male wins a significantly higher proportion of fights than the satellite male if displays progress to direct interactions (Wolff 1998). We then aggregated these winner–loser relationships in a weighted, directed network of 112 males, which are denoted as nodes, and 648 agonistic interactions, each denoted as an edge (link) that is weighted according to the number of observed interactions of any type and directed from the winner to the loser of an interaction (Fig. 2).
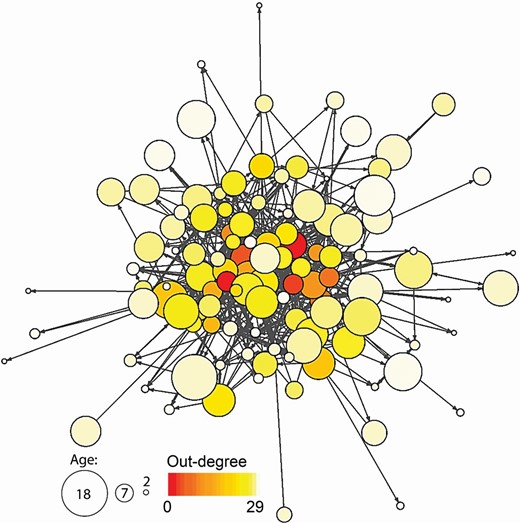
Network of agonistic interactions among bison males. Each node represents a male, node size corresponds to age, arrow direction indicates the direction of the agonistic action from aggressor (winner) to recipient (loser), and line thickness indicates edge weight—number of interactions. Color corresponds to a male’s out-degree—the number of unique males it won over.
To determine the role of sexually mature males in the dominance structure, we used social network analysis to quantify the position of each male within the network of agonistic interactions (Table 2). We used two local network measures of node centrality that account for the direct links of each male: the number of unique males each individual dominated (out-degree) and total number of contests for each male (strength). We further used two global measures of node centrality that account for interactions across the entire network: the reciprocal of the average of all agonistic interactions that link each male to all other males (closeness), and the number of shortest paths, which connect every pair of males, that pass through the focal individual (betweenness). Out-degree is most directly related to traditional dominance measures as it provides the total number of unique individuals beaten in contests, while the other three measures represent different aspects of an individual’s place in the agonistic interaction network. Strength centrality (the total number of contests a male participated in, regardless of outcome) can provide a proxy for the time and energy invested in dominance status. For example, a traditional dominance rank calculated as the proportion of wins over total contests would have placed a male that won 50 out of 100 contests at the same dominance position as an individual that won one out of two contests, even though the first individual clearly invested more energy in contests (strength centrality 150) than the second one (strength centrality 3). Closeness measures how well an individual is connected directly or indirectly to all other individuals in the network and therefore can be interpreted as an individual’s potential to influence the entire group. Betweenness indicates the importance of a male for the stability of the social structure because they are part of many dominance hierarchy chains or occupy an important point of social connections (i.e., social broker). High betweenness indicates that an individual is important for the dominance structure; however, these males are not necessarily at the top of the dominance chains they link. We used the R package “igraph” (Csardi and Nepusz 2006) to calculate social network measures and plot networks.
Glossary of social network (node centrality) measures used in the study.
| Glossary of social network measures | |
|---|---|
| Local interactions among males | |
| Out-degree | Total number of unique males each individual dominated. Individuals with high out-degree have won contests over more individuals than those with low out-degree. Closest to traditional dominance measures. |
| Strength | Total number of contests each male participated in, regardless of outcome. Individuals with high strength participate more in agonistic interactions. A proxy for time and effort invested in dominance status. |
| Global interactions across male social network | |
| Closeness | The reciprocal of the average of all agonistic interactions that link each male to all other males. Indicates how well an individual is connected directly or indirectly to all other individuals in the network. Can be interpreted as an individual’s potential to influence the entire group. High closeness reflects short social distance to other individuals. |
| Betweenness | The number of shortest paths, which connect every pair of males, that pass through the focal individual. Indicates the importance of a male for the stability of the social structure because they are part of many dominance hierarchy chains or occupy an important point of social connections (i.e., social broker). High betweenness indicates high importance to the network but these males are not necessarily at the top of dominance chains. |
To compare network centrality measures with those produced by traditional dominance ranking systems, we calculated two common dominance measures from our data set, David’s score (David 1987; Gammell et al. 2003) and Elo-rating (Albers and de Vries 2001; Neumann et al. 2011). David’s score is a measure of individual overall success based on the outcome of agonistic interactions with group members while taking into account the relative strengths of opponents (Gammell et al. 2003). The Elo-rating method provides sequential estimations of individual dominance based on the temporal sequence of dominance interactions, with derived ratings possible for any moment in time (Albers and de Vries 2001). The R package “EloRating” (Neumann and Kulik 2020) was used to calculate both David’s score (“DS” function) and Elo-rating (“elo.seq” function). We calculated David’s scores using the Pij index (the raw dyadic win proportion) and calculated the final Elo-rating for each individual within the time period of interest.
Statistical analyses
Regressions were used to investigate the relationship between a male’s position in the dominance structure and their age and mass (prediction 1.1): polynomial regressions tested the relationship between the four node centrality measures and age while linear regressions tested the relationships between node centrality and mass. To determine the relationship between a male’s position in the dominance structure and its mating success and reproductive success (predictions 2.1, 2.2), we used Pearson’s correlation to relate the four node centrality measures with the number of matings and the number of sired offspring. To examine the relationship between participation in different mating tactics and position in the dominance structure (predictions 3.1, 3.2), we used Pearson’s correlation to link node centrality with the number of females tended, the number of satellite males that attended a given tending male, and the number of tending males that a given satellite male attended. To assess the relationship between tending effort and position in the network of agonistic interactions (prediction 3.1), we used Pearson’s correlation to link node centrality with the total number of tending days and the number of tending observations per female. Lastly, to investigate whether links between node centrality and mating behavior changed throughout the season (prediction 3.3), we split the breeding season into three equal periods of 32–33 days each (early, middle, and late, based on the first and last days with observed tending) and analyzed the relationship between node centrality and number of females tended in each of these periods separately using a Pearson’s correlation. The 6-week breeding peak overlapped with the early (15 June to 18 July) and middle (19 July to 20 August) periods but not the late period (21 August to 21 September).
To determine the statistical significance of the relationships between the factors of interest (e.g., age, mass, matings, etc.) and node centrality, we used a randomization procedure because of the nonindependence among individuals in a network (Good 2005). We permuted individual IDs on the observed network, while keeping the network structure as we observed empirically. By shuffling only node IDs, we created a reference model in which the relationship between node centrality and the factor of interest is broken but the global structure of the social network is maintained. We conducted two-tailed tests by running the permutation 10,000 times and computing P-values as the proportion of iterations in which the observed correlation coefficient was > 97.5% or < 2.5% of the 10,000 randomized values of the correlation coefficient. To further determine our confidence in the relationship between the factors of interest and the network centrality measures, we ran a bootstrap of 10,000 iterations to produce 95% confidence intervals (CIs) for the correlation coefficients. We used the Benjamini–Hochberg procedure to account for multiple testing (Benjamini and Hochberg 1995) across the four network centrality measures (4-way B–H procedure), with the false discovery rate set to 0.05 and adjusted P-values presented as PAdj.
Pearson’s correlation tests were used to evaluate the relationships among the four node centrality measures and the traditional dominance measures of David’s score and Elo-rating. We also assessed the relationship between the factors of interest and the traditional dominance measures in the same way outlined above for node centrality, including randomizations and bootstrapping. Results for these traditional dominance measures used the Benjamini–Hochberg procedure for multiple testing applied across all six dominance and network centrality measures (6-way B–H procedure). Finally, we used Wilcoxon signed-rank tests to determine if the strength of the relationship between the factors of interest and out-degree (i.e., the correlation coefficients from all hypothesis tests) was significantly different from results derived using traditional dominance measures of David’s score and Elo-rating. Out-degree was used for this comparison as it is the network measure used here that is most similar in nature to the traditional dominance measures.
Ethical note
All our methods were approved by the Institutional Animal Care and Use Committees (IACUC) of Point Loma Nazarene University (IACUC no. 1001) and the University of California-Davis (IACUC no. 11800).
Results
Comparison of social network measures and traditional measures
All node centrality measures, out-degree, strength, closeness, and betweenness, were positively related to each other with statistically significant (P < 0.0001) Pearson’s correlation coefficients of r ≥ 0.62 (Supplementary Data SD1). The two most correlated measures were out-degree and strength (r = 0.86). Betweenness was the least correlated with all other centrality measures (r = 0.62–0.67). David’s scores and Elo-ratings were highly correlated with each other (Pearson’s correlation: r = 0.90, P < 0.0001) and showed a strong significant positive correlation with out-degree but weaker positive correlations with all other measures (Table 3).
Pearson’s correlation coefficients between network centrality measures and David’s scores and Elo-rating. Asterisks indicate statistical significance (*P < 0.01; **P < 0.001; ***P < 0.0001).
| Out-degree | Strength | Closeness | Betweenness | |
|---|---|---|---|---|
| David’s score | 0.82*** | 0.47*** | 0.26* | 0.35** |
| Elo-rating | 0.81*** | 0.47*** | 0.32** | 0.36** |
| Out-degree | Strength | Closeness | Betweenness | |
|---|---|---|---|---|
| David’s score | 0.82*** | 0.47*** | 0.26* | 0.35** |
| Elo-rating | 0.81*** | 0.47*** | 0.32** | 0.36** |
Hypothesis 1: dominance versus age and mass
All measures of male centrality peaked in prime-aged males and increased with mass, as seen in other studies of male dominance in bison. Young and old males exhibited low centrality and prime-aged males had high node centrality (polynomial regression: out-degree, r109 = 0.475, CI = 0.409–0.558, PAdj = 0.0001, Fig. 3A; strength, r109 = 0.455, CI = 0.353–0.564, PAdj = 0.0001, Fig. 3B; closeness, r109 = 0.498, CI = 0.345–0.649, PAdj = 0.0002, Fig. 3C; betweenness, r109 = 0.364, CI = 0.280–0.478, PAdj = 0.002, Fig. 3D; Supplementary Data SD1 and SD2). Furthermore, heavier males had greater node centrality than lighter males for all measures (linear regression: out-degree, r38 = 0.464, CI = 0.354–0.589, PAdj = 0.007, Fig. 3E; strength, r38 = 0.458, CI = 0.251–0.608, PAdj = 0.004, Fig. 3F; closeness, r38 = 0.590, CI = 0.286–0.765, PAdj = 0.0004, Fig. 3G; betweenness, r38 = 0.403, CI = 0.257–0.553, PAdj = 0.013; Fig. 3H; Supplementary Data SD1 and SD2).
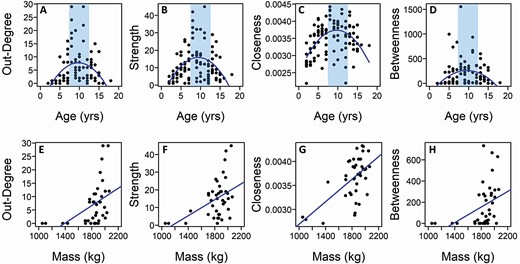
Relationship between the four node centrality measures and male age (top row:A–D) and mass (bottom row:E–H). Lines for the age graphs indicate the polynomial fit to the data and lines for mass graphs indicate the linear fit to the data. The vertical shading indicates the prime age range (approximately 7–12 years). All relationships are statistically significant.
David’s score and Elo-rating showed similar significant positive relationships to prime age and mass (Pearson’s correlation: David’s score, r = 0.308–0.313, PAdj = 0.0043–0.049; Elo-rating, r = 0.378–0.416, PAdj = 0.0001–0.019; Fig. 4; Supplementary Data SD1 and SD2).
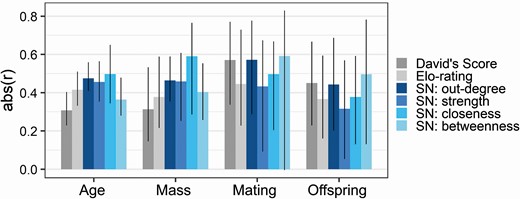
Absolute values of the correlation coefficients of relationships between all traditional dominance and social network (SN) centrality measures versus age, mass, number of matings, and number of offspring sired. The absolute values of the correlation coefficients (‘abs(r)’ as bars) are presented along with 95% confidence intervals (vertical black lines; see Supplementary Data SD1 for details).
A secondary analysis on the network measures was carried out after removing four mass values that presented low outliers in the original mass analysis. These mass values were from the youngest males in this mass data set (two 2-year-old and two 3-year-old males). In this secondary analysis, out-degree and betweenness were still significantly correlated with mass, but strength and closeness showed only a trend for a positive correlation (Supplementary Data SD2).
Hypothesis 2: dominance versus mating and reproductive success
The local centrality of an individual in the dominance structure strongly corresponded to the number of matings (observed and inferred) it achieved and the number of offspring it sired. The more unique individuals a male dominated (out-degree) and the more contests it participated in, as a winner or loser (strength), the more matings it obtained (Pearson’s correlation: out-degree, r30 = 0.572, CI = 0.286–0.777, PAdj = 0.003, Fig. 5A; strength, r30 = 0.432, CI = 0.091–0.674, PAdj = 0.013, Fig. 5B; Supplementary Data SD1 and SD3) and the more offspring it sired (Pearson’s correlation: out-degree, r40 = 0.443, CI = 0.202–0.687, PAdj = 0.01, Fig. 5E; strength, r40 = 0.316, CI = 0.053–0.569, PAdj = 0.04, Fig. 5F; Supplementary Data SD1 and SD3).
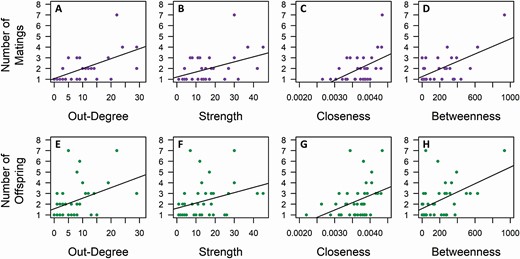
Relationship between male centrality in the network of agonistic interactions and the number of matings carried out (top row) and the number of offspring sired (bottom row). Four network centrality measures are shown: out-degree (A, E), strength (B, F), closeness (C, G), and betweenness (D, H). Lines indicate the linear fit to the data. All relationships are statistically significant.
The global centrality measures showed a similar pattern to that of the local centrality measures. Closeness and betweenness were significantly correlated with number of matings obtained (Pearson’s correlation: closeness, r30 = 0.496, CI = 0.205–0.669, PAdj = 0.006, Fig. 5C; betweenness, r30 = 0.591, CI = −0.005 to 0.830, PAdj = 0.003, Fig. 5D; Supplementary Data SD1 and SD3) and offspring sired by a male (Pearson’s correlation: closeness, r40 = 0.377, CI = 0.130–0.592, PAdj = 0.02, Fig. 5G; betweenness, r40 = 0.496, CI = 0.130–0.782, PAdj = 0.004, Fig. 5H; Supplementary Data SD1 and SD3).
David’s score and Elo-rating had similar significant positive relationships to the number of matings and number of offspring sired (Pearson’s correlation: David’s score, r = 0.450–0.571, PAdj = 0.0036–0.01; Elo-rating, r = 0.367–0.445, PAdj = 0.012–0.019; Fig. 4; Supplementary Data SD1 and SD3).
Hypothesis 3: dominance and mating tactics
All node centrality measures were positively related to investing in the tending tactic (tending females and having satellite males) but only some of these measures were related to the alternative satellite tactic (attending other males). There was a significant positive correlation between the number of females an individual tended and the number of unique males it dominated (Pearson’s correlation: out-degree, r108 = 0.548, CI = 0.459–0.650, PAdj = 0.0001), the number of total contests it participated in (Pearson’s correlation: strength, r108 = 0.538, CI = 0.418–0.646, PAdj = 0.0001), its social distance from other individuals in the network, i.e., males that participated more in tending have shorter social network distances (Pearson’s correlation: closeness, r108 = 0.564, CI = 0.431–0.676, PAdj = 0.0002), and its importance for the cohesion of the network (Pearson’s correlation: betweenness, r108 = 0.455, CI = 0.280–0.595, PAdj = 0.0001); see Fig. 6A and Supplementary Data SD1 and SD4 for details. Similarly, there were significant positive correlations between the number of satellite males that attended to an individual and all node centrality measures derived for that individual (Pearson’s correlation: out-degree, r53 = 0.932, CI = 0.867–0.967, PAdj = 0.0002; strength, r53 = 0.819, CI = 0.684–0.901, PAdj = 0.0001; closeness, r53 = 0.598, CI = 0.479–0.710, PAdj = 0.0001; betweenness, r53 = 0.278, CI = 0.080–0.566, PAdj = 0.045; Fig. 6B; Supplementary Data SD1 and SD4). Furthermore, analyses of tending effort showed positive significant relationships between all node centrality measures and the number of days a male engaged in tending a female (Pearson’s correlation: out-degree, r108 = 0.581, CI = 0.474–0.675, PAdj = 0.0002, Fig. 7A; see Supplementary Data SD1 and SD5 for details on strength, closeness, and betweenness, r108 ≥ 0.399, PAdj = 0.0001) and its average number of tending observations per female (Pearson’s correlation: out-degree, r108 = 0.595, CI = 0.434–0.738, PAdj = 0.0002, Fig. 7B; see Supplementary Data SD1 and SD5 for details on strength, closeness, and betweenness, r108 ≥ 0.209, PAdj ≤ 0.03).
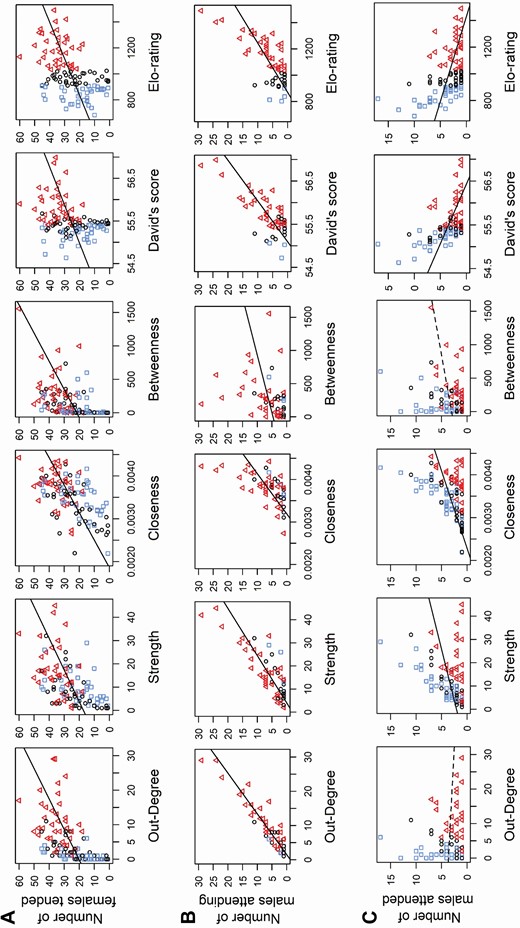
Relationship between all network and dominance measures versus mating tactic. Participation in the tending mating tactic is depicted as the number of females tended (A: top row) and number of satellite males attending (B: middle row). Participation in the alternative satellite mating tactic is shown as the number of tending males attended (satellited) by a given male (C: bottom row). Network centrality measures include out-degree, strength, closeness, and betweenness, and traditional dominance measures include David’s score and Elo-rating (respectively, across each row). Lines indicate the linear fit to the data, with significant relationships depicted with solid lines. Data points are color and shape coded according to the 33% and 66% quantiles of Elo-rating: blue squares (□) = Elo-rating < 910 (low dominance); black circles (ο) = Elo-rating ≥ 910 and < 1,026 (mid dominance); red triangles (∆) = Elo-rating ≥ 1,026 (high dominance).
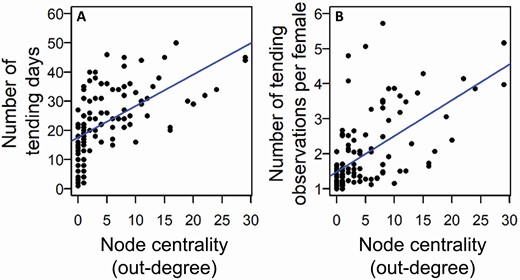
Relationship between node centrality in the network of agonistic interactions (as out-degree) and tending effort. Tending effort is represented as (A) the number of days tending, and (B) the average number of tending observations per female. Lines indicate the linear fit to the data. All relationships are statistically significant.
Again, like all the node centrality measures, both David’s score and Elo-rating showed positive correlations with participation and effort in the tending mating tactic (i.e., number of females tended, number of satellite males attending, number of tending days, and average number of tending observations per female; Pearson’s correlation: David’s score, r = 0.329–0.767, PAdj = 0.0001–0.0005; Elo-rating, r = 0.431–0.721, PAdj = 0.0001–0.0002; Figs. 6A and 6B ; Supplementary Data SD1, SD4, and SD5).
In contrast, when examining participation in the alternative satellite tactic, we did not detect a significant relationship between the number of males an individual attended as a satellite male (Fig. 6C) and the number of males it dominated or its social centrality (Pearson’s correlation: out-degree, r97 = −0.086, CI = −0.236 to 0.089, PAdj = 0.387; betweenness, r97 = 0.197, CI = −0.025 to 0.384, PAdj = 0.068). However, we found positive correlations between the number of males attended and the individual’s total number of contests and social distance, i.e., males who attended more had shorter social distances (Pearson’s correlation: strength, r97 = 0.367, CI = 0.161–0.572, PAdj = 0.0004; closeness, r97 = 0.431, CI = 0.305–0.546, PAdj = 0.0004). See Fig. 6C and Supplementary Data SD1 and SD4 for details. Conversely, there was a negative correlation between participation in the alternative satellite mating tactic and both traditional measures of dominance (Pearson’s correlation: David’s score, r97 = −0.482, PAdj = 0.0003; Elo-rating, r97 = −0.444, PAdj = 0.0002; Fig. 6C and Supplementary Data SD1 and SD4).
The positive relationship between a male’s centrality and the number of females it tended persisted through the early and the middle parts of the breeding season for all node centrality measures (Pearson’s correlation: out-degree early, r76 = 0.514, CI = 0.333–0.679, PAdj = 0.0003; out-degree middle, r108 = 0.478, CI = 0.361–0.607, PAdj = 0.0002; Fig. 8; see Supplementary Data SD1 and SD6 for details on strength, closeness, and betweenness, r ≥ 0.353, PAdj ≤ 0.0003) and traditional dominance measures (Pearson’s correlation: David’s score, r = 0.283–0.470, PAdj = 0.0002–0.0027; Elo-rating, r = 0.431–452, PAdj = 0.0001–0.0002; Supplementary Data SD1 and SD6). However, out-degree, betweenness, David’s score, and Elo-rating were not significantly correlated with the number of females tended in the late, nonpeak season (Pearson’s correlation: out-degree: r89 = 0.159, CI = −0.073 to 0.379, PAdj = 0.13, Fig. 8; betweenness: r89 = 0.193, CI = −0.033 to 0.401, PAdj = 0.09; David’s score, r89 = 0.032, PAdj = 0.768; Elo-rating, r89 = 0.048, PAdj = 0.768; Supplementary Data SD1 and SD6). Strength and closeness maintained positive correlations with the number of females tended in the late, nonpeak season (Pearson’s correlation: strength: r89 = 0.262, CI = 0.038–0.471, PAdj = 0.03; closeness: r89 = 0.261, CI = 0.071–0.430, PAdj = 0.03; Supplementary Data SD1 and SD6).
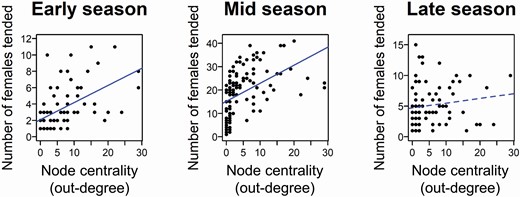
Relationship between node centrality in the network of agonistic interactions (as out-degree) and number of females tended throughout the season. Lines indicate the linear fit to the data, with significant relationships depicted with solid lines.
Comparison of correlation coefficients between out-degree and traditional measures of dominance
Out-degree had a stronger relationship with factors of interest than Elo-rating when comparing the absolute value of correlation coefficients across all tests (Wilcoxon signed-rank: V = 13, P = 0.04, Fig. 4 for Hypotheses 1 and 2, Supplementary Data SD1 for Hypothesis 3). However, out-degree correlations were not significantly different from those generated from David’s score (Wilcoxon signed-rank: V = 17, P = 0.09, Fig. 4; Supplementary Data SD1).
Discussion
Social network measures allow us to explore the importance of a diversity of social dynamics that go beyond traditional measures of dominance hierarchy, such as David’s score and Elo-rating. Here, we examined the relationship between measures of male fitness (age, mass, matings, offspring) and mating tactic with two local and two global measures of social centrality. While the number of unique males an individual won over (out-degree) is aligned with traditional dominance measures, we also examined the total number of wins and losses (strength) as a proxy of energy spent on establishing dominance. Furthermore, the global network measures provided us information on the social distance of an individual to all others (closeness) and the importance of an individual to the cohesion of the network, or their potential to be a social broker (betweenness).
The different measures of male centrality in the interaction network of bison were positively correlated with each other and with traditional dominance measures (David’s score and Elo-rating). All node centrality measures, as well as both traditional measures, peaked in prime-aged males (Fig. 3) and showed positive significant relationships with mass (Fig. 3), number of matings (Fig. 5), and number of offspring (Fig. 5), thus supporting predictions 1.1, 2.1, and 2.2, respectively. Furthermore, all node centrality measures, and traditional dominance measures, were positively and significantly correlated with participation and effort in the tending mating tactic, i.e., number of females tended, number of satellite males attending, number of tending days, and average number of tending observations per female (Figs. 6A, 6B and 7), supporting prediction 3.1. Our prediction that participation in the tending tactic would diminish over the breeding season (prediction 3.3) was mostly supported. All node centrality measures, and traditional dominance measures, showed significant positive correlations with number of females tended during the early and middle periods of the breading season (Fig. 8), which overlap with the 6-week peak breeding period. Only strength and closeness remained significantly correlated with number of females tended during the late period of the season. In summary, heavier, prime-aged males with high mating and reproductive success and strong participation and effort in the tending mating tactic had high dominance (traditional dominance scores), high social centrality (out-degree), high participation in agonistic interactions (strength), short social network distances (closeness), and high importance to network stability (betweenness).
While all node centrality measures and traditional dominance measures produced largely similar results for assessing mating, reproductive success, and participation in the tending tactic, there was a divergence in the direction and strength of the relationships of these measures to participation in the alternative satellite mating tactic. We predicted that network centrality would not have a positive correlation with the number of tending males an individual attended as a satellite bull (prediction 3.2). While this prediction was supported for out-degree and betweenness, which showed no significant relationship, strength and closeness both showed significant positive correlations with participation in the alternative tactic (Fig. 6C). Furthermore, the traditional dominance measures both showed significant negative correlations with this tactic (Fig. 6C), highlighting that different measures of dominance have differing relationships with participation in the satellite tactic. In summary, males that participated more in the alternative satellite mating tactic had low dominance (traditional dominance scores) but high participation in the networks of agonistic interactions (strength) and short social network distances (closeness).
Our use of social network analysis to characterize agonistic behavior of male bison based on their local and global position in interaction networks generated results that are largely supported by existing studies of dominance in bison and other polygynous ungulates.
Age and mass
Node centrality measures and traditional dominance rankings identified males with high node centrality and high dominance as prime-aged and heavy individuals. This result supported Hypothesis 1 (Table 1) and is in accordance with previous studies in which traditional measures of dominance also identified heavy, prime-aged bison males as dominant (Maher and Byers 1987; Wilson et al. 2002; Mooring et al. 2004; Wyman et al. 2012; Mooring and Penedo 2014). Social centrality was also positively correlated with male mass (Fig. 3), as seen in other species of ungulates (e.g., McElligott et al. 2001). In general, the largest males have the largest weapons (e.g., horns) and have the greatest competitive ability or resource holding potential, and these large males obtain the highest mating success (Emlen 2008). For example, heavier fallow deer males (Dama dama) have greater mating success due to their greater dominance rank during the rut (McElligott et al. 2001). Conversely, smaller or younger males are at greatest risk for injury during agonistic encounters with high-ranked males. Subdominant male feral goats (Capra aegagrus hircus) are at higher risk of being butted by dominant males when practicing the alternative mating tactic of coursing (Saunders et al. 2005).
Mating and reproductive success
Network analysis revealed that bison males with the greatest node centrality in the interaction network mated with more females and produced more offspring than males with low node centrality (Fig. 5). Hypothesis 2 thus was supported (Table 1), indicating that males more central to the interaction network invested more in matings than peripheral males in the network and thereby sired more offspring. In addition, we found that males with higher traditional dominance rankings had higher mating and reproductive success (David’s score and Elo-rating; Supplementary Data SD1 and SD3). This agrees with previous studies that have correlated dominance with total number of copulations (Wolff 1998; Mooring et al. 2006a; Wyman et al. 2008) and offspring sired (Wyman et al. 2008; Mooring and Penedo 2014). However, while total number of copulations was positively related to reproductive success in prior studies (Wyman et al. 2008; Mooring and Penedo 2014), observations of specific copulation events between a given male and female did not predict paternity (i.e., offspring production) on the individual level (Mooring and Penedo 2014). Thus, it is possible that dominant males assess the potential outcome of each mating opportunity prior to making any investment. For example, by tending the most fertile females for longer periods, dominant males can potentially mitigate the trade-off between committing time and energy to agonistic interactions as opposed to mate-directed behaviors.
In support of the notion that dominant males invest in matings that are more likely to result in offspring compared with subordinate males, a study of semiwild bison in Nebraska found that high-ranking males focused breeding efforts on the females with the highest productivity (King et al. 2019). In fact, the top two dominant males focused most of their breeding efforts on the 11 females that produced 71% of the calves (King et al. 2019). Mooring and Penedo (2014) found that male dominance rank, but not observed mating events, was a significant predictor of paternity for a given calf. This suggests that behaviors such as mate guarding and establishing dominance are just as important for siring offspring as actual copulations.
Mating tactics
In most ungulate species, larger and heavier males of prime age invest in more reproductive effort by participating in more aggressive interactions and mate-guarding behaviors than younger, smaller, and lighter males (see review in Mysterud et al. 2004). The positive impact of participation and effort in tending tactics on reproductive success has been noted in other species (Mysterud et al. 2004). For example, in Alpine ibex (Capra ibex), the older, more dominant males gain higher reproductive success by using a tending tactic while younger, more subordinate males adopt the less successful alternative mating tactic of sneak matings (Willisch et al. 2012). In red deer (Cervus elaphus), the more days a stag is able to guard and hold a female in his harem, the higher the probability that he will sire offspring with that female (Pemberton et al. 1992).
Although bison males are sexually mature and can mate starting at the age of 2, they only begin to successfully compete with other males at age 6 (Maher and Byers 1987). The satellite mating tactic, which carries a lower fitness payoff, is practiced primarily by males that are too young or too old to successfully compete directly with prime-aged males using the tending tactic (Gross 1996). While our more traditional dominance measures confirmed the prediction that high-ranking males would not participate strongly in the less successful alternative satellite mating, our network analysis revealed that males who do adopt this tactic are still very central in the social network on both a local and global scale. Not only is their participation in agonistic interactions high, but they are also strongly connected either directly or indirectly to all other males in the network and may influence agonistic interactions throughout the group. For instance, it is likely that the use of the alternative satellite mating tactic by lower-ranked males requires tending males to be more protective of their females and to invest in continued tending following copulation (Berger and Cunningham 1991). Going beyond traditional dominance rankings to use social network measures helps to highlight the critical role of less dominant males in polygynous mating systems.
Timing of mating tactics
We found that males with high node centrality and high dominance tended more females than males with low node centrality and low dominance through the peak of the breeding season (early–middle rut), but not late in the breeding season (Fig. 8; Table 1: prediction 3.3; Supplementary Data SD1 and SD6). Because more females are receptive during the early and middle periods of the rut (Berger 1989; Wolff 1998), the ability of males to tend more females during these periods would increase their chances of obtaining a mating that results in offspring. Our finding that males with low node centrality and low traditional dominance rankings produced fewer offspring may in part result from an inability to gain access to and mate with females during their most fertile periods. Competition among males for access to a female is highest when she is in peak estrus: more satellite males attend the tending pair and more males produce bellow vocalizations, a prominent dominance signal, when females are in estrus (Berger and Cunningham 1991). In wood bison (B. bison athabascae), subordinate males are prevented from tending estrus females by dominant males (Komers et al. 1994). Dominant males likely invested less in their reproductive effort during late rut because far fewer females come into estrus then (Berger 1989; Wolff 1998). As the breeding season comes to an end, it is more advantageous for dominant males to begin recovering energy stores by resting and feeding to ensure survival through the winter, rather than expending the last stores of energy to compete for the few females that have not yet been bred. Similarly, red deer males invest more in fighting rivals when the potential for gaining access to receptive females is high (Clutton-Brock et al. 1979). We conclude that successful matings resulting in offspring likely were achieved by dominant males with high social centrality securing more mating opportunities than subordinate males with low centrality when females were sexually receptive, and by investing in the most effective mating tactic (tending).
Conclusions
Our work suggests that breeding bison males can overcome the trade-off between mating with females versus establishing their dominance over other males by investing in the most effective tending tactic that results in more sired offspring and confers direct fitness benefits. In bison, dominance contests enable males to simultaneously pursue the most effective mating tactic while establishing or maintaining their dominance status, for example, when males fight challengers while tending females. In other polygynous systems, dominance status may be determined before the breeding season, resolving the temporal trade-off between establishing dominance and mating. Alternatively, mating and dominance contests can be separated spatially but not temporally, further enhancing the trade-off between these two behaviors. Our analysis comparing social network measures with traditional dominance rankings shows that the network measures may be a useful tool in future investigations of dominance relationships. Social network measures could be used to examine how the direct and indirect aspects of agonistic interactions can relate to mating effort, reproductive success, and mating tactic across different mating systems. Such an approach could elucidate the various balancing tactics employed by males to resolve the “fighting versus breeding” trade-off while gaining the greatest fitness benefits possible.
Implications for conservation
We have proposed that a social network approach may be useful for enhancing the conservation of threatened species. A key objective for bison management is to maximize the long-term persistence and “wildness” of bison populations by retaining the variability of natural behaviors possessed historically by wild herds (Symstad et al. 2019). New guidelines for bison population management include supporting and promoting wild behaviors and demographic processes that reflect natural selection because “bison are social animals and the importance of social structure within a herd is critical to overall herd health and survival” (Gates et al. 2010:88). Differential reproduction resulting from mate competition is an important evolutionary process; therefore, Gates et al. (2010) argued that it is crucial to allow bison to express natural mating behaviors as part of a bison management program. For example, support for wild behavior in bison conservation herds should enable dominance interactions and fighting among males during the breeding season. Best management practices also should regularly monitor behavioral performance measures that include dominance competitions (Gates et al. 2010; Symstad et al. 2019). We have shown in this study that a social network approach has the potential to clarify how the social behavior of individual males translates into population growth and survival, and we propose that such an approach would be a valuable tool for the management of species of conservation concern.
Acknowledgments
Funding was provided by the National Science Foundation RUI grant IOB-0517771 to MSM and by grants from Point Loma Nazarene University. The staff of Fort Niobrara National Wildlife Refuge provided extraordinary support throughout the field study, especially R. Huber, K. McPeak, and S. Hicks. Special thanks to L. Hart and B. Hart at University of California-Davis for aid in the development of the overall field study. Behavioral and genetic data were collected with the help of N. Beckley, D. Boyle, M. Dillenbeck, M. Herrick, and M. Mantor. We are especially grateful to E. Jenkins and R. Botts of Point Loma Nazarene University for assisting in the analysis of the traditional dominance measures and their relationship to the social network measures.
Supplementary Data
Supplementary data are available at Journal of Mammalogy online.
Supplementary Data SD1. Data supporting factor test results and comparisons between network and dominance measures.
Supplementary Data SD2. Data supporting tests of age and mass versus network and dominance measures.
Supplementary Data SD3. Data supporting tests of network and dominance measures versus number of matings and offspring.
Supplementary Data SD4. Data supporting tests of network and dominance measures versus mating tactic.
Supplementary Data SD5. Data supporting tests of network and dominance measures versus tending effort.
Supplementary Data SD6. Data supporting tests of network and dominance measures versus tending tactic seasonality.
