


Abstract
Data collected on life-history parameters of known-age animals from the northern (NR) and southern resident (SR) killer whales (Orcinus orca) of the eastern North Pacific were compared with life-history traits of killer whales located at SeaWorld (SEA) facilities. For captive-born SEA animals, mean age and body length at 1st estrus was 7.5 years and 483.7cm, respectively. Estimated mean age at 1st conception was different (P < 0.001) for the combined data from both northern and southern resident (NSR) free-ranging populations (12.1 years) compared to SEA (9.8 years), as was the estimated mean age at 1st observed calf (SEA: 11.1 years, NSR: 14.2 years, P < 0.001). Average calf survival rate to 2 years of age for SEA animals (0.966) was significantly greater (P = 0.04) than that for SR (0.799). Annual survival rate (ASR) for SEA increased over approximately 15-year increments with rates in the most recent period (2000–2015 ASR: 0.976) improved (P < 0.05) over the first 2 periods of captivity (1965–1985: 0.906; 1985–2000: 0.941). The SR (0.966) and NR ASR (0.977) were higher (P ≤ 0.05) than that of SEA until 2000, after which there were no inter-population differences. Based on ASR, median and average life expectancy were 28.8 and 41.6 years (SEA: 2000–2015), 20.1 and 29.0 years (SR), and 29.3 and 42.3 years (NR), respectively. The ASR for animals born at SEA (0.979) was higher (P = 0.02) than that of wild-caught SEA animals (0.944) with a median and average life expectancy of 33.1 and 47.7 years, respectively. These data present evidence for similar life-history parameters of free-ranging and captive killer whale populations and the reproductive potential and survivorship patterns established herein have application for use in future research concerning the overall health of both populations.
With estimated worldwide population levels at a minimum of 50,000 (Taylor et al. 2013), killer whales (Orcinus orca) are considered one of the most ubiquitous top predators in the oceans, occurring in most of the available habitats (Dahlheim and Heyning 1999). Although there is consensus that specialized killer whale lineages or ecotypes exist, the degree of genetic and/or reproductive isolation between or within these ecotypes is under debate (Barrett-Lennard et al. 2001; Riesch et al. 2012; de Bruyn et al. 2013). The killer whale populations in the eastern North Pacific Ocean are by far the most studied and best understood. Three clearly distinct ecotypes, residents, transients, and offshores, have been identified based primarily on migratory patterns and prey sources (reviewed by National Marine Fisheries Service 2008).
Within the well-studied resident ecotypes inhabiting the Pacific Northwest, animals remain in their natal group for most, if not all, of their life, whereas evidence for the lesser-studied transients and the poorly studied offshores indicates a fluid population structure with temporary or permanent dispersal of offspring from the natal group (Bigg et al. 1987; Ford et al. 1998; Baird 2000; Ford et al. 2000; Dahlheim et al. 2008).
Families or clans are formed from groups of animals that frequently associate along matrilines known as “pods,” and groups of geographically cohesive clans form subpopulations (Ford 1991; Riesch et al. 2012). Subpopulations of the same ecotype may be completely or partially genealogically distinct (Riesch et al. 2012; de Bruyn et al. 2013). Three resident ecotypes of the northern and southern Pacific Northwest and those of southern Alaska have been identified through approximately 40 years of intensive studies (Bigg et al. 1987; Matkin et al. 2013). The ability for each of these parapatric subpopulations to adapt to changing environments or to recover from an adverse response to an unusual mortality event (Matkin et al. 2008) has profound implications for their conservation. The characterization of normal reproductive potential and survivorship patterns are essential for predicting responses to these pressures, as well as for evaluating overall health and the ensuing potential for population recovery.
The study of captive cetacean populations in controlled research settings has provided fundamental information on many species-specific aspects of their biology. A contribution to our understanding of the basic physiological processes in killer whales has been derived from captive populations including adaptations to diving (Hedrick and Duffield 1991), auditory detection, echolocation, and learning (Hall and Johnson 1972; Dahlheim and Awbrey 1982; Bowles et al. 1988; Szymanski et al. 1999; Crance et al. 2013), reproductive physiology (Benirschke and Cornell 1987; Walker et al. 1988; Robeck et al. 1993, 2004, 2006), growth and development (Asper et al. 1988; Clark and Odell 1999a, 1999b; Clark et al. 2000), metabolic and energy requirements (Kastelein et al. 2000; Williams et al. 2011; Worthy et al. 2013), health status (Cornell 1983; Reidarson et al. 2000; Robeck and Nollens 2013), immune system function (King et al. 1996; Funke et al. 2003), and genetics (Stevens et al. 1989). The utility of these captive studies for health assessment and conservation strategies for free-ranging cetacean populations requires that captive populations are healthy and thriving. In the killer whale and other delphinids, commonly used population health indicators are reproductive success and age-specific survivorship patterns (Wells and Scott 1990; Small and DeMaster 1995; Olesiuk et al. 2005; Matkin et al. 2008; Poncelet et al. 2010; Matkin et al. 2013). Recent analysis of captive bottlenose dolphin (Tursiops truncatus) populations, a species closely related to killer whales, demonstrated that reproductive success and survivorship patterns are comparable to or exceed those experienced by their wild counterparts (Wells and Scott 1990; Innes 2005; Venn-Watson et al. 2011a). As such, these captive populations can provide models for understanding geriatric changes and impacts of unique age or event-specific physiological stressors to wild populations (Venn-Watson et al. 2011a, 2011b; Robeck and Nollens 2013).
The effectiveness of these models to aid in population management for either zoological or wild animals is critically dependent on health assessment procedures that require accurate estimates of life-history parameters for the species. For the killer whale, controversy exists concerning the methodology (Wiese and Willis 2004; Innes 2005; Matkin et al. 2013) and the current relevancy of historical estimates of killer whale survivorship in both free-ranging (Olesiuk et al. 1990) and captive (Small and DeMaster 1995) populations. These estimates are inherently problematic in long-lived species like the killer whale due to a proportionately limited number of years tracking known-age animals relative to their overall lifespan. Similarly, there is insufficient time to evaluate the effects of improved population management practices on survivorship patterns (Wiese and Willis 2004). Small captive population size further complicates statistical analysis. Recently, survival and reproductive activity of known-age killer whales since 1973 for the resident populations of the Pacific Northwest have become available (northern residents—Cetacean Cousins 2015; Northern Resident Orca 2015; southern residents—Center for Whale Research 2015; Cetacean Cousins 2015; Orca Network 2015) as well current life-history traits of the long-studied southern Alaska resident killer whales (Matkin et al. 2013). These data provide a novel metric from which comparisons with other populations can be made. They also provide an opportunity to update reviews of life-history parameters for the species.
The availability of a robust captive killer whale breeding program for scientific research allows for comparisons of life-history traits with animals in the wild and can improve the accuracy of population health assessments and the efficacy of ensuing conservation strategies. Accordingly, the objective of this research was to characterize and compare reproductive parameters and survivorship patterns of free-ranging killer whales in the Pacific Northwest (northern and southern residents, NSR) and captive killer whales at SeaWorld (SeaWorld Parks and Entertainment, SEA) using methodologies previously published for captive and free-ranging populations (DeMaster and Drevenak 1988; Olesiuk et al. 2005; Matkin et al. 2013; Jett and Ventre 2015). The specific objectives were to utilize current data to: 1) define gestation lengths and reproductive maturation in female killer whales; 2) establish and compare the current reproductive potential of free-ranging (NSR) and captive (SEA) killer whales; 3) determine survivorship patterns of known-age animals for the NSR population; 4) determine survivorship patterns of known-age animals and wild-caught animals for the SEA population; and 5) compare survivorship patterns of free-ranging (NSR, and southern Alaska residents) and captive (SEA) killer whales, across different time blocks.
Materials and Methods
Animals.
For this research, the SEA population included animals born, transferred, or living at SeaWorld San Diego (n = 11, San Diego, California), SeaWorld San Antonio (n = 6, San Antonio, Texas), SeaWorld Orlando (n = 7, Orlando, Florida), and Loro Parque (n = 6, Tenerife, Spain). During 1965–1978, a total of 18 founders (animals born in the wild) were collected from the wild or stranded (n = 1) and 1 founder was transferred to SEA from another institution. Thereafter and until 2012, 16 founder and 3 first-generation animals were transferred to the SEA population from other facilities as they closed their programs or for the purposes of breeding loans, or as a stranded animal (Table 1). Ages for wild-captured SEA animals were assigned based on their length at capture using published growth curves for male and female killer whales (Clark et al. 2000). Life-history data for these killer whales along with the captive-born totaled 65 animals that compose the SEA data set as of 20 April 2015 are listed in Supporting Information S1.
Annual recruitment, mortalities, and total number of killer whales (Orcinus orca) by population (SEA: SeaWorld Parks and Entertainment, SR: southern residents, NR: northern residents) and evaluation period.
| Population and evaluation period | No. of initial animals | No. of animals recruited or transferred | No. of mortalities | Total end period population number |
|---|---|---|---|---|
| SEA: 1965–2015 | 1 | 65 (18, 14, 2, 31)a | 35 | 30 |
| SEA: 1965–1985 | 1 | 18 (17, 1)b | 11 | 8 |
| SEA: 1985–2000 | 8 | 26 (11, 1, 14)c | 14 | 20 |
| SEA: 2000–2015 | 20 | 20 (2, 1, 17)c | 10 | 30 |
| SRd: 1975–2015 | 15 | 131 | 73 | 73 |
| NRd: 1975–2014 | 20 | 343 | 126 | 237 |
aThe parenthesized numbers represent: SEA founder collections from the wild, founder transfers, F1 transfers, and captive-born at SEA, respectively.
bThe parenthesized numbers represent: SEA founder collections from the wild and a founder transfer.
cThe parenthesized numbers represent: founder transfers, F1 transfers, and captive-born at SEA, respectively.
dOnly animals born during or after 1972 were included.
For animals in the northern (NR) and southern resident (SR) data set, life-history data for known-age animals (first identified as neonates) were analyzed (1975–2014 NR, 1975–2015 SR—Bigg et al. 1987; Ford et al. 2000; Ellis et al. 2011; Center for Whale Research 2015; Cetacean Cousins 2015; Northern Resident Orca 2015; Orca Network 2015). We also included information for live calves estimated at a year old in 1973 and thus born in 1972. To maximize accuracy, individuals were only included in the NR and SR (NSR) data set if animal data were corroborated with at least 2 of the available sources. A summary of total numbers of NSR animals used for this research is presented in Table 1, with life-history details for each animal listed in Supporting Information S2.
All life-history data results, where appropriate, from both the SEA and NSR populations were compared to published data collected during 1984–2010 for southern Alaskan resident killer whales (Matkin et al. 2013). Total animals at the start of each time period, recruitments, transfers, and mortalities are listed in Table 1.
Gestation length.
Conception dates for SEA animals were determined through endocrine monitoring as previously described (Robeck et al. 2004). The date of parturition was then subtracted from the conception date for each pregnancy to determine the gestation length. Data for each pregnancy were then combined to determine killer whale gestation length parameters (mean, median, standard error of the mean [SEM], and 95% confidence interval [CI]). While some of these data have been previously reported (Duffield et al. 1995; Robeck et al. 2004; Robeck and Nollens 2013), the data set herein represents the most comprehensive to date. There are at this time no equivalent data for any wild killer whale population. All sample collections from SEA animals were part of routine husbandry monitoring, followed ASM guidelines (Sikes et al. 2011), and were approved by SEA institute animal care and use committee.
Neonate mortality and calf survival rates.
SEA neonates (live born) were defined as animals < 40 days of age. Neonatal mortality rate (NMR) for SEA animals was calculated by dividing the number of neonate deaths by the total number of births. A neonate classification cannot be applied to NSR animals since 1st observation of an individual typically occurred several months after parturition (as described in the following section). Thus, as with gestation length, the NMR is not known for any wild population.
Calves were defined as animals that survived until the end of weaning, which occurs within 2 years of birth (Haenel 1986; Robeck et al. 1993). As such, the calf survival rate (CSR) was determined for animals that survived for > 40 days and were aged ≤ 2 years (690.5 days). CSRs for wild orca were determined with calves that were first observed at less than 1 year of age. For these animals, they were assumed to be 180 days of age at the start of the year after which they were first observed (for example, if they were first observed during 1989, they were assigned a birth date of 1 January 1989 and would be ~180 days at 1 July 1989). If calves were listed as dying the same year they were first observed, they were considered to have reached 180 days (180 − 40 days = 140 at-risk days) of age at death. If they were observed 1 year and not the next, they were assumed to have died at 325.25 days of age for 1st-year calves and 505.5 days for calves between 1 and 2 years. For animals surviving to > 2 years and beyond, they were assigned a maximum “at-risk (for mortality)” days of 690.5 days (730.5 − 40 days). All SEA calves that survived beyond 40 days were considered at risk from 40 days until the maximum weaning time of 2 years (40 days until 2 years: 690.5 at-risk days). While this method caused an increase in the “at-risk” days for SEA animals, it was considered the best approach for comparison to wild animal data. The CSR was calculated by first determining the daily survival rate (DCSR) of the calves using methods described by DeMaster and Drevenak (1988) as follows:
where Yi is the total number of calves that died during the observation period (> 40 and ≤ 730.5 days), Xi is the total number of days, including any days in which death may have occurred, in the observation period for the ith individual, and K is the total number of animals in the sample. Finally, the CSR was determined by raising the DCSR to the 690.5th power (the total possible at-risk days).
Maturation, age at 1st reproduction, and female reproductive rate.
Female sexual maturation: for captive-born animals, age at sexual maturity was defined as the age in years at the 1st detected ovulation. Ovulation was defined as occurring when serum progesterone concentrations exceeded 1ng/ml. Total body length was determined at 2- to 4-week intervals from 12 months of age by measuring the length from the tip of the rostrum to the notch of the tail fluke with the animal lying in dorsal recumbency adjacent to the pool edge. The measurement closest to the day of ovulation was used for determining body length at sexual maturity.
Age of 1st reproduction (AFR): wild killer whale AFR is conventionally represented as the age of the dam when a viable calf was first observed. For analysis of these reproductive parameters, we combined data from the SR and the NR populations (NSR). For NSR data, 78% of animal identifications occur from May to August, whereas the peak calving period appears to be outside of this period (Olesiuk et al. 2005). By the time calves are first observed, they are estimated to be a mean 6.7 months old (estimated range: 2–11 months—Olesiuk et al. 2005). Currently, published reports of AFR in wild populations do not include data from females giving birth to stillborn calves and likely do not include all females producing calves that died within 6 months after parturition (i.e., calves which failed to thrive, FTT). Therefore, the published estimates of AFR for wild populations should be considered a positively biased AFR unless adjustments are made (as described below). Mean (± SEM) and median AFR values were determined for SEA and NSR populations using known ages of the dams and year of birth for 1st observed calves (NSR) or actual birth dates (SEA). For comparison to published wild animal data, we also determined an estimated AFR (AFRe) using a method first described by DeMaster (1978) and modified for use with wild killer whale populations (Olesiuk et al. 2005; Matkin et al. 2013). The method is based on the proportion of wild killer whales giving birth at each age and is calculated as follows:
where f(x) is the proportion of females mature by age x, and f(x) − f(x − 1) is the proportion of females maturing at each age. Variance [Var(AFRe)] was calculated by:
where n(x) is the number of known-age females in the sample at age x.
For NSR animals, we developed a model to determine the estimated age at 1st viable conception (AFC), which included the AFR, mean gestation length (MGL), shortest known calving interval (SCI) for animals with stillborn or FTT calves of 2.67 years (Duffield et al. 1995), and the estimated probability of a first time female experiencing a stillbirth or neonatal loss prior to 6 months of age, which has been estimated at ~40% (Olesiuk et al. 1990, 2005). AFC was determined by first randomizing the numerical list of all NSR individual AFR data. Next, the first 40% of the individual AFR data was selected and the SCI of 2.67 was subtracted from each individual’s age at AFR to create the AFC value for animals that lost their 1st calf (AFCCL). The analysis was then repeated using a 20%, 30%, and 50% probability of stillbirth/neonatal loss to understand how the incidence of this parameter affects the AFCCL. For the remaining percent data in each scenario, designated as animals that did not lose a calf, the AFC was determined by AFR − MGL. The resulting values for AFCCL and AFC were then combined to determine the mean, median, and range for NSR AFC. Data for AFC for females of SEA were determined by known conception dates and ages (estimated and known age) for each animal and combined to determine the summary statistics.
To describe a measure of female fecundity for both populations, we used the parameter described by Matkin et al. (2013), the female fecundity rate (FEC; proportion of females giving birth in any year) which is based on the number of years between successive calves (calving interval):
The mean ± SEM was then determined for the population during the sampling period. In addition, we then determined age-specific fecundity rates (FECf(x)—Matkin et al. 2013), which are used to describe the proportion of females, aged x giving birth to viable calves each year:
where NCf(x) represents the number of calves born to females aged x, divided by Nf(x) which represents the total number of females aged x. To help adjust for the small sample size associated with SEA data, ages were grouped together in 3-year intervals starting from age 6.
Mortality and survivorship patterns.
A mortality rate index was created by determining the total actual mortalities over 5-year blocks of time for NR (1975–2014), SR (1975–2015), and SEA (1965–1979, then every 5 years until 2015) and dividing that number by the total expected mortalities. Specifically, for each 5-year age block, the mortalities within the 0–9, 10–19, 20–29, > 30 year age groups were determined. Next, the expected number of mortalities for each of these age blocks was calculated by multiplying the NSR age-group-specific annual mortality rate (AMR = 1 − annual survival rate [ASR; as defined in the following paragraphs]) by the total number of animal years within that period of time and age group block. The expected mortalities from each age block were then summed to determine the total expected mortalities during that 5-year period. Significant deviations from expected mortalities for each population were determined using chi-square test. Finally, a regression analysis of AMR was performed to evaluate if the mortality rate index was significantly related to time.
We compared survivorship between populations by 2 methods, with the 1st method based on the calculation of ASR. ASR has historically been used for comparisons of populations in captivity and for describing survivorship of wild populations (DeMaster and Drevenak 1988; Olesiuk et al. 1990; Olesiuk et al. 2005; DeMaster et al. 2013; Matkin et al. 2013). As such, this determination would allow for direct comparisons to previously published data. The 2nd method, Kaplan–Meier estimator of survivorship (Kaplan and Meier 1958), is a nonparametric estimator that relies on predicting the probability of survivorship over time (Cleves et al. 2010). This method, commonly used for survivorship analysis in clinical medicine (Cleves et al. 2010) and recently for analysis of captive killer whale survivorship (Jett and Ventre 2015), has been included to enable comparisons with the latter report.
ASR for SEA, SR, and NR populations was calculated from the daily survival rate (DSR) as previously described for CSR. However, to determine ASR, the DSR was raised to the 365.25th power to adjust for the average number of days in a year. Birth and death dates for wild animals were assigned as described for CSR. Free-ranging animals that were identified as calves prior to the start of 1975 (from 1972 forward) were only considered as “at risk” beginning at the age from which they had attained at the start of 1975. For comparison of age-specific mortality between free-ranging and captive populations, we modified the age class categories described by Matkin et al. (2013) into larger time periods and combined sex groups, to reduce the potential effect of the variation inherent in age estimation based on length, and to provide enough animal days within each age category for comparisons with the small SEA population. The 5 age class categories (years) were as follows: 0.5–10, 10–20, 20–30, 30–40, and 40 and above. Data were considered binomial due to only 1 of 2 outcomes possible (live or dead) per any sample year (DeMaster and Drevenak 1988). Based on the inability to determine sex prior to maturation in free-ranging populations (Olesiuk et al. 2005; Matkin et al. 2013), sex-specific ASR were determined for wild populations as follows: all animals of unknown sex were assigned a random number using the Rand function (Microsoft Excel—Microsoft Corp. 2011) and then placed in ascending order based on this number. They were then divided into equal groups at the midpoint of this list and assigned to either male or female category and combined with known-sex animals for final ASR determination. The randomization of unknown-sex animals was repeated 5 times and overall sex ASR calculated after each replicate to determine if the randomization process had a significant effect on expected versus actual ASR for each sex group.
For SEA data, animals that were transferred into the population were only added to animal day counts starting with their age at date of transfer. One animal with known chronic pulmonary disease that was transferred for welfare reasons and subsequently died within a few months post-transport was not included in the ASR calculations. For analysis of captive-born survival rates, and similar to CSR, only animals born at a SeaWorld facility and that survived beyond day 40 were included. In addition, we divided the overall SEA survival data into multiple time periods to determine if ASR had changed over time. These periods were: 1965–1985 (encompassing the period when killer whales were first placed into a zoological setting and husbandry practices were under development), 1985–2000, and 2000–2015.
Published age-specific ASR rates for the southern Alaska resident population (table 3 from Matkin et al. 2013) were combined using weighted means to determine overall and sex-specific survival rates. ASR data for sex or the overall southern Alaska resident population were then compared to results from SEA, NR, and SR data using a Z-test. In addition, average life expectancy (ALE) and median life expectancy (MLE) were calculated from the ASR for all populations as previously reported (DeMaster and Drevenak 1988):
For Kaplan–Meier modeling of daily survival rate, analyses were performed separately on each population (NR: 1975–2014, SR: 1975–2015, SEA: 2000–2015, SEA captive-born) using Stata statistical software (StataCorp LP 2015). Stata has the ability to handle delayed entry (left truncated) of individuals into the populations in the statistical analyses. Entry dates (birth or transfer dates) for animals within each population were handled as described for ASR calculations. To compare our results to recently published Kaplan–Meier analysis (Jett and Ventre 2015), we modeled the SEA populations twice: once without neonates and once to include neonates that died prior to age 40 days (n = 2). Further, to allow for direct comparisons of our results (with and without neonates that died prior to day 40) to free-ranging populations, we factored in a neonatal loss rate of 10%, 20%, or 30% for the NR and SR populations. The free-ranging neonatal loss was modeled as follows: total estimated calves (TEC) born were first determined by dividing the total observed live calves (LC) for the population across the time period by 1 minus the percent neonatal loss. For example, a 10% neonatal loss was determined as follows:
Equality of Kaplan–Meier survival curves between each group was compared using the log-rank test (Mantel and Haenszel 1959). All statistical tests were 2-tailed and differences were considered significant at P < 0.05.
Typically, life expectancy tables, based on age-specific ASR, cannot be accurately produced until the life cycle of known-age animals has been completed. Since no known-age animals have reached maximum values (all SEA, NR, and SR populations have animals in their 40s, and none who have reached > 30 years for SEA and > 40 years for NSR have died), life expectancy tables have limited value. However, we used published estimated age-specific probabilities for survival (ASR) for females (Matkin et al. 2013) to determine the odds of a female killer whale reaching the ages of 50, 60, 70, 80, 90, and 100 years. The probability of surviving (PS) from the earliest known-age class (0.5 years) to any given age (x) is equal to the product of the annual survival rates (ASRi) from 0.5 years to the age of interest (x):
Thus, the PS from age 0.5 to age 50.5 is:
Population age structure.
Since both SEA and NSR populations started with recruitments of neonatal or juvenile animals, the initial population age structure would not be representative of a normal dispersion of age groups. Thus, the population age structure was calculated for SEA and NSR only at the end of the study periods for comparison. These values were made by determining the percentage of animals within each of the following age categories: 0.5–10, 11–20, 21–30, 31–40, 41–50, and > 50 years. We also calculated the total NSRt population (NSRt = NSR + NSRe, where NSRe = all estimated age animals, or animals born prior to 1973) for comparison to both SEA and NSR.
Statistical analyses.
Statistical analyses were conducted using Sigma Plot software (Systat Software, Inc. 2012) unless otherwise noted. Age-specific reproductive data (AFC, AFR) from free-ranging animals are especially affected by outliers, for example, those animals that may have delivered a calf unobserved; therefore, age at 1st calf data from SEA and NSR were first evaluated for outliers using the interquartile range (IQR). The IQR is the difference between the 1st and 3rd quartile. The IQR is then multiplied by 1.5 and added to IQ3 and subtracted from IQ1. Any values falling outside of these intervals are considered outliers. Differences in calving interval, AFR, and AFC within and between the SEA and NSR populations were evaluated using unpaired t-tests. The best model to describe age-specific fecundity was determined by incremental polynomial regression. The curve with the best fit or the lowest order regression curve that added predictive value for the data was determined using the F-statistic significance defined as P < 0.05. The effect of age on fecundity was evaluated using a logistic regression conducted on the presence or absence of a calf by female age (ranging from 12 to 42 years) and population (NSR or SEA). A 2-tailed Z-test was used to determine if differences existed between age group and total population ASR from SEA, NR, and SR populations. Standard error (SEM) and CI for the binomial distributions were determined using Stata statistical software. Pairwise comparisons between the percentage of the population within each age category of SEA and NSR populations were made using a 2-tailed Z-test. Survival rates were compared between each population within each age category/time block and between the overall mean ASR of each population/block using the 2-tailed Z-test. Significance was defined as P < 0.05.
Results
For SEA, 33 live births from 1985 until 1 January 2015 resulted in 31 calves surviving beyond day 40. Based on these animals and the capture (n = 18) and transfer (n = 16) of animals into the SEA population as described previously (Table 1; Supporting Information S1), a total of 65 animals were held from 31 October 1965 to 2015, and 35 deaths were recorded. For the SR and NR, the total population of calves estimated to be born between 1972 and 1974 was 35. From 1 January 1975 to 2015 (based on the last assessment date of 1 January 2015 for SR, and 1 January 2014 for NR), a total of 474 births and 199 deaths of known-age animals were recorded (Table 1; Supporting Information S2).
Reproductive parameters.
The mean ± SEM, median, range, and 95% CI for gestations of known length in the SEA population were 532.2±2.8 days, 534.0 days, 473.0–567.0 days, and 526.5–537.9 days, respectively (n = 33). From the 33 live births, 2 neonates died before they reached 40 days of age (6.3% NMR). The CSR for SEA from 1985 to 2015 of 0.966 (CI: 0.903–1) was not significantly different to that of NR (0.869, CI: 0.863–1, P = 0.22) and was greater (P = 0.04) than that of SR (0.799, CI: 0.735–1). No differences (P = 0.07) in the CSR were observed between NR and SR.
Age at 1st estrus for 1st-generation SEA animals was calculated as 7.5±0.3 years (median = 7.4, range: 5.7–8.5 years, n = 9). Total body length at 1st estrus was 483.7±10.5cm (median = 485, range: 435–523cm). Within the SEA population, 5 of the 9 animals conceived at their 1st or 2nd estrus. The other animals were either separated from adult males when they came into estrus or were not in the presence of a male with prior proven fertility. Three animals within the NSR group had ages at 1st birth (23, 24, and 28 years, respectively) that were determined to be statistical outliers (outliers were < 6.8 and > 21.5 years). These data points were omitted. No other data points from either population were considered outliers. Mean AFC (years) was different (t124 = 3.52, P < 0.001) between SEA (9.8±0.61, median = 9, range: 5.9–15, n = 17) and NSR (12.1±0.25, median = 11.5, range: 8–16.8, n = 109) animals. For SEA animals, there was a significant difference (t24 = 2.62, P = 0.02) between age at 1st estrus and AFC. The inclusion of differing frequencies of stillbirth/neonatal loss (20%, 30%, 40%, 50%) in our statistical models did not significantly affect (P > 0.05) the AFC for NSR (data not shown).
A total of 112 NSR and 16 SEA females of known age had their 1st calf during the evaluation period. Significant differences (t122 = 4.6, P < 0.001) were detected between the AFR (years) as calculated from known-age animals for SEA (11.1±0.69; median: 10.0, range: 8.5–15, n = 16) and NSR (14.2±0.24; median: 14.0, range: 9.0–21.0, n = 109). Differences (t125 = 10.68, P < 0.001) were detected between AFRe (years) for SEA (11.0±0.3) and NSR (13.99±0.02) populations (Fig. 1).
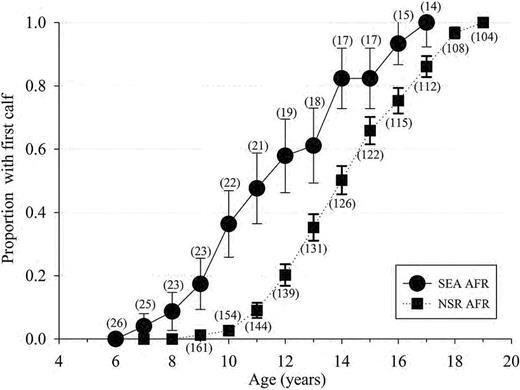
The proportion (± SE) of the female population reaching reproductive maturity as defined by the age of 1st observed calf for known-age killer whales (Orcinus orca) of the eastern North Pacific free-ranging population (NSR, northern and southern residents from 1975 to 2014) and for the captive population at SeaWorld Parks and Entertainment (SEA, 1985–2015) based on animals of known-age and at an estimated age based on length at capture. The number in parenthesis represents total number of females having attained each age group. AFR = age of 1st reproduction.
A total of 24 calving intervals were documented in 10 females for the SEA group, and 174 calving intervals were recorded in 76 NSR females. The calving intervals (years) between the 2 populations (SEA: 4.08±0.42, median = 3.3, 95% CI: 1.84–9.75; NSR: 4.97±0.18, median = 4, 95% CI: 2.0–10.0) were not significantly different (t180 = 1.81, P = 0.07) and the frequency of distribution is illustrated in Fig. 2. The mean annual calving rate or fecundity for SEA (0.27±0.02, median 0.26, 95% CI: 0.1–0.46) and NSR (0.24±0.01, median: 0.25, 95% CI: 0.1–0.5) was also not significantly different (t180 = 1.39, P = 0.16). While a slight linear relationship existed between age of cow at conception and the subsequent calving interval for NSR (r2 = 0.04, F1,157 = 6.15, P = 0.01), a strong association of these parameters was detected within the SEA population (r2 = 0.26, F1,21 = 7.27, P = 0.014).
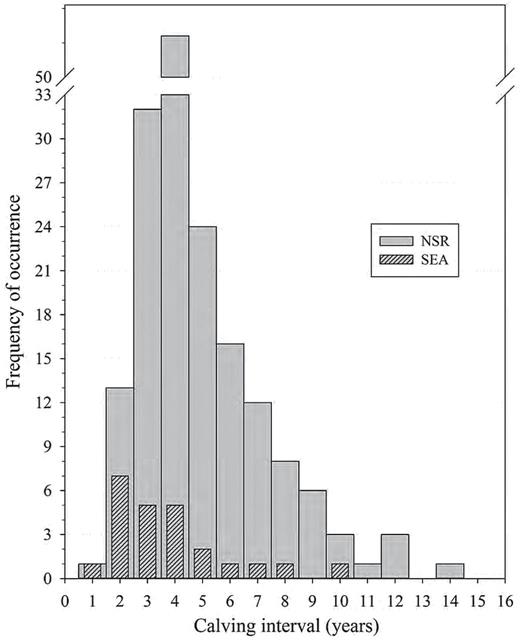
Frequency distribution of killer whale (Orcinus orca) calving intervals (CI) for known-age animals of the eastern North Pacific free-ranging population (NSR, northern and southern residents from 1975 to 2014, n = 174 CI) and for the captive population at SeaWorld Parks and Entertainment (SEA, 1985–2015, n = 24 CI) based on animals of known-age and an estimated age based on length at capture.
For NSR animals, the age-specific female fecundity rate rose rapidly from the youngest known female to have had a calf (age 9) and then underwent 2 peaks, initially at age 14 years (FEC: 0.21±0.04) then again at age 17 years (FEC: 0.25±0.04). This pattern of rapidly increasing fecundity with bimodal peaks is also evident for SEA females with the 1st calf being born at age 7.4 years and the initial fecundity peak occurring at 10 years (0.26±0.09) then again at 14 years (0.28±0.11) of age, respectively. Regression slope (F1,44 = 0.27, P = 0.61) and intercepts (F1,45 = 0.09, P = 0.78) of age-specific fecundity patterns did not differ between NSR and SEA; thus, the fecundity data were combined and logistic regression demonstrated a significant decrease with age (r2 = 0.46, P < 0.001; Fig. 3).
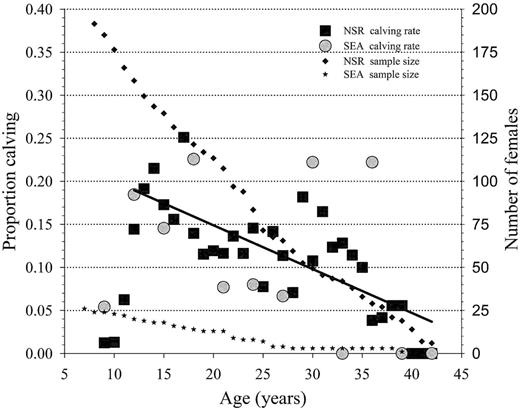
Age-specific fecundity for known-age killer whales (Orcinus orca) of the eastern North Pacific free-ranging population (NSR, northern and southern residents from 1975 to 2014) and for the captive population at SeaWorld Parks and Entertainment (SEA, 1985–2015) based on animals of known-age and an estimated age based on length at capture. The linear regression line (Y = 0.251 − 0.00509 * Age) in the figure depicts this significant (r2 = 0.46, P < 0.001) decline in observed fecundity with age.
Mortality and survivorship patterns.
Regression analysis of the SEA mortality rate index demonstrated a significant decrease (r2 = 0.86, P < 0.001) from 1980 until 2015 at a rate of −0.1/year (Fig. 4). No relationship was detected between the mortality rate index of NR (r2 = 0.18, P = 0.29) or SR (r2 = 0.02, P = 0.69) and time. No significant differences (P > 0.05) were detected in actual versus expected mortalities during any time frame within any population.
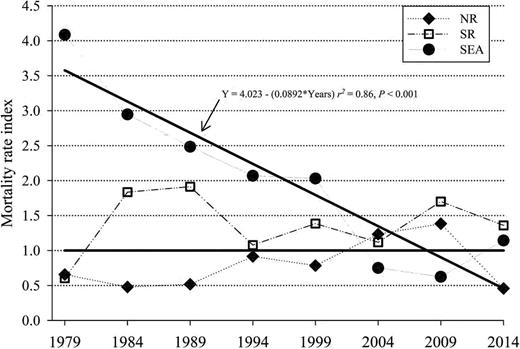
The mortality rate index (actual divided by expected mortality rates) of the northern resident (NR, ♦), southern resident (SR, □), and SeaWorld (SEA, ●) killer whales (Orcinus orca). The horizontal black line is the expected mortality rate (EMR) reference index (EMR/EMR). The EMR was determined from the age-specific (0–9.5, 10–19.5, 20–29.5, > 30 years) mortality rate of free-ranging killer whales (NR and SR from 1975 to 2015). Next, the actual mortality rates in ~5-year blocks for NR and SR (starting in 1979) and ~5-year blocks for SEA (1965–1979, then 5-year blocks) for each age group were determined and the sum of actual mortality rate was divided by sum of EMR. The solid black line marked by an arrow is the regression of the SEA mortality rate index by time and it demonstrates a significant (P < 0.001) decrease in mortality rates over time.
For the SEA population, overall survivorship, as indicated by ASR, had steady increases over each time group with 2000–2015 being significantly greater than 1965–1985 (Z = 3.32, P < 0.001) and 1985–2000 (Z = 2.21, P = 0.03; Table 2). The SEA captive-born ASR of 0.979 was significantly higher (Z = 2.32, P = 0.02) than that of wild-caught SEA animals (ASR: 0.944) during the 1985–2015 time block, and the captive-born ASR of 0.979 was not significantly (Z = 0.28, P = 0.78) higher when compared to the whole SEA population (ASR: 0.976, 2000–2015). Overall survivorship patterns of SEA animals from 2000 to 2015 did not differ from that of the SR (Z = 1.05, P = 0.29) or NR (Z = 0.05, P = 0.96) population nor the southern Alaska resident population as reported by Matkin et al. (2013; Z = 0.35, P = 0.73; Table 2). However, the survival rate of the SR population was significantly lower that of the NR (Z = 2.64, P = 0.008) and the southern Alaska resident (Z = 2.16, P = 0.03) populations. Based on the ASR, the MLE and ALE for SEA (2000–2015), SR, NR, and the southern Alaska residents are listed in Table 2. Age-group-specific ASR did not differ (P ≥ 0.13) among the 3 populations (NR, SR and SEA; Table 3).
Annual survival rate (ASR), median life expectancy (MLE), and average life expectancy (ALE) for captive (SEA, total population SeaWorld Parks and Entertainment; SEA CB, captive-born at SEA) and known-age free-ranging (SR, southern residents, NR, northern residents) and the southern Alaska residents (SAR) killer whale (Orcinus orca) populations. ASR for SEA, SR, and NR was derived from the daily survival rate (DSR) by raising the DSR to the 364.25th power (DeMaster and Drevenak 1988). SEM = standard error of the mean.
| Population | Date range | ASR (± SEM) | ASR 95% CI | MLE (years)a | ALE (years)a |
|---|---|---|---|---|---|
| SEA | 1965–1985 | 0.906±0.026, n = 111c | 0.854–0.960 | 7.0 | 10.1 |
| SEA | 1985–2000 | 0.941±0.015, n = 231c | 0.912–0.972 | 11.4 | 16.4 |
| SEA | 2000–2015 | 0.976±0.008, n = 367d,e | 0.961–0.992 | 28.8 | 41.6 |
| SEA CB | 1985–2015 | 0.979±0.007, n = 376d,e | 0.965–0.999 | 33.1 | 47.7 |
| SR | 1975–2015 | 0.966±0.004, n = 2098d | 0.959–0.974 | 20.1 | 29.0 |
| NR | 1975–2014 | 0.977±0.002, n = 5330e | 0.973–0.981 | 29.3 | 42.3 |
| SARb | 1984–2010 | 0.979±0.004, n = 1261e | 0.970–0.986 | 32.7 | 47.1 |
aMLE = Ln(0.5)/Ln(ASR); ALE = −1/Ln(ASR).
bWeighted means were used to determine overall ASR from data reported in table 3 of Matkin et al. (2013).
c,d,eASR values within the same column in different rows with different superscripts are significantly different (P < 0.05).
Comparisona,b of age-specific annual survival rates (ASR) of animals (male and female) between captive (SEA, SeaWorld Parks and Entertainment) and free-ranging (SR, southern residents; NR, northern residents; SAR, southern Alaska residents) killer whale (Orcinus orca) populations.
| Age class (years) | SR 1975–2014 | SEA 2000–2015 | NR 1975–2014 | |||
|---|---|---|---|---|---|---|
| L(x)c | ASR(x)d | L(x)c | ASR(x)d | L(x)c | ASR(x)d | |
| 0.5–10 | 1,014 | 0.957a | 159 | 0.988a,b | 2,756 | 0.976b |
| 10–20 | 656 | 0.983a | 103 | 0.963a | 1,545 | 0.983a |
| 20–30 | 308 | 0.962a | 63 | 0.955a | 787 | 0.972a |
| 30–40 | 110 | 0.956a | 34 | 1.000a | 230 | 0.957a |
| > 40 | 9 | 1.000 | 7 | 1.000a | 7 | 1.000a |
| Overall | 2,098 | 0.966a | 367 | 0.976a,b | 5,321 | 0.977b |
a,b Values within the same row in different columns with different superscripts are significantly different (P < 0.05) using a 2-tailed Z-test for proportions.
cL(x) = total number of animal years (total animal days divided by 365.25) within each age group.
dASR was derived from the daily survival rate (DSR) by raising the DSR to the 365.25th power (DeMaster and Drevenak 1988).
Sex-related differences in survivorship patterns were only observed for SR killer whales, with males having a significantly lower ASR than females (SR: Z = 2.46, P < 0.01). No other significant sex differences were detected (Table 4).
Annual survival rate (ASR), median life expectancy (MLE), and average life expectancy (ALE) of males and females for captive-born (SEA, SeaWorld Parks and Entertainment) and free-ranging (NR, northern residents; SR southern residents; SAR, southern Alaska residents) killer whale (Orcinus orca) populations. SEM = standard error of the mean.
| Population | Date range | ASR (± SEM)a | ASR 95% CI | MLE (years)a | ALE (years)a |
|---|---|---|---|---|---|
| Male | |||||
| SR | 1975–2015 | 0.956±0.007, n = 972f | 0.943–0.967 | 15.3 | 22.1 |
| SEAb | 1985–2015 | 0.982±0.01, n = 167f,g | 0.941–0.996 | 38.7 | 55.8 |
| NR | 1975–2014 | 0.975±0.003, n = 2,540g | 0.969–0.981 | 25.5 | 36.8 |
| SARc | 1984–2010 | 0.976±0.006, n = 591g | 0.961–0.987 | 28.5 | 41.2 |
| Norwayd | 1986–2003 | 0.971±0.008 | 0.950–0.983 | 23.6 | 34.0 |
| Indian Oceane | 1977 | 0.935 | 0.817–0.979 | 10.3 | 14.9 |
| Female | |||||
| SR | 1975–2015 | 0.975±0.005, n = 1,143g | 0.966–0.984 | 27.3 | 39.4 |
| SEAb | 1985–2015 | 0.976±0.012, n = 198f,g | 0.954–0.996 | 28.9 | 41.7 |
| NR | 1975–2014 | 0.981±0.003, n = 2,858g | 0.976–0.986 | 34.7 | 50.1 |
| SARc | 1984–2010 | 0.980±0.005, n = 671g | 0.965–0.989 | 34.3 | 49.5 |
| Norwayd | 1986–2003 | 0.977±0.009 | 0.951–0.989 | 29.8 | 43.0 |
| Indian Oceane | 1977 | 0.942 | 0.742–0.966 | 11.6 | 16.7 |
aASR was derived from the daily survival rate (DSR) by raising the DSR to the 365.25th power (DeMaster and Drevenak 1988). MLE = Ln(0.5)/Ln(ASR); ALE = −1/Ln(ASR).
bAnimals born at SeaWorld Parks and Entertainment.
cWeighted means were used to determine overall ASR for males or females from data reported in table 3 of Matkin et al. (2013). For the calculations, a 50% sex ratio was assumed for the animals from age 0.5 to 14.5 years.
dData from table 2 of Kuningas et al. (2013). Includes adult animals only. Direct statistical comparisons could not be conducted between the populations because animal years were not provided.
eData from Poncelet et al. (2010). Direct statistical comparisons could not be conducted between the populations because animal years were not provided.
f,gSignificance (P < 0.05) between populations determined by using a Z-test, values within the same column with different superscripts are different.
Significant differences (χ2 = 8.56, P = 0.04) in survivorship were detected by the log-rank comparisons between Kaplan–Meier survival curve results (Fig. 5), whereby pairwise comparisons of groups indicated that, similar to ASR Z-test analysis, significant differences were only detected between NR and SR populations (χ2 = 7.53, P = 0.006). The Kaplan–Meier survival estimates and expected versus actual mortalities are listed in Table 5. The MLE for captive-born SEA animals of 25 years remained unchanged with and without the inclusion of neonatal losses in the model. As expected, animal age for captive-born SEA at the 75% survival probability estimate dropped when neonatal deaths were included (from 14.1 to 12.3 years; Table 5). When estimated neonatal losses were included in wild population analyses, the MLE significantly (P < 0.05) declined within each population at each subsequent percentage of calf loss (10%, 20%, and 30% loss, respectively) from 23 to 10 years for SR and from 30 to 21 years for NR (Table 5).
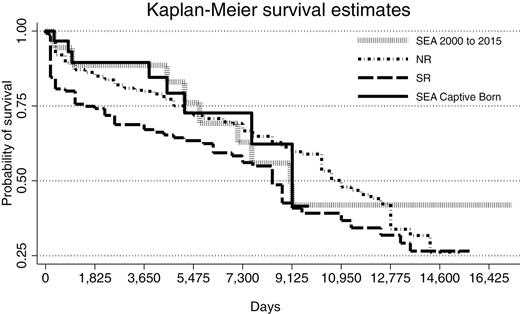
Kaplan–Meier survival curves for the proportion of killer whales (Orcinus orca) alive over time (days) for northern resident 1975–2014 (NR, n = 363), southern resident 1975–2015 (SR, n = 146), SEA (2000–2015, n = 39), and captive-born at SeaWorld Parks (SEA captive-born, 1985–2015, n = 31) killer whales. Significant differences (χ2 = 7.3, P = 0.007) were only detected between SR and NR populations.
Kaplan–Meier survival analysis results for captive (SEA, SeaWorld Parks and Entertainment) and free-ranging (NR, northern residents; SR southern residents) killer whale (Orcinus orca) populations. CB = captive-born.
| Group | Age (years) at 75% survival probability (± SEM, 95% CI) | Age (years) at 50% survival probability (± SEM, 95% CI) | Observed deaths | Expected deaths |
|---|---|---|---|---|
| SEA 2000–2015 (n = 39) | 15.6±2.2, 0.9 to 24.9 | 24.8±1.1, 14.1 to --- | 9a–g | 9.5 |
| SEA captive-born (CB) (n = 31) | 14.1±1.9, 2.7 to 25.0 | 25.0±1.3, 14.1 to --- | 120a–d,f | 136.2 |
| NR 1975–2014 (n = 358) | 14.0±1.9, 11.0 to 19.0 | 29.0±1.3, 28.0 to 35.0 | 71a | 52.9 |
| SR 1975–2015 (n = 144) | 3.0±1.7, 1.0 to 14.0 | 23.0±1.1, 16.4 to 26.0 | 8b–f | 9.5 |
| Groups modeled with neonatal loss (NL) included in analysis.i | ||||
|---|---|---|---|---|
| SEA 2000 to 2015 (n = 39)j | 15.6±2.2, 0.9 to 24.9 | 24.8±1.1, 14.1 to --- | 9a–g | 11.3 |
| SEA CB + NL (2 animals, n = 33) | 12.3±2.1, 0.9 to 25.0 | 25.0±1.1, 14.1 to --- | 10a–f | 12.7 |
| NR (10% NL, n = 397) | 6.3±2.0, 2.9 to 12.0 | 28.0±1.5, 23.0 to 35.0 | 87c | 67 |
| NR (20% NL, n = 443) | 1.0±0, 0.5 to 3.0 | 23.0±2.1, 18.0 to 30.1 | 106d | 87 |
| NR (30% NL, n = 465) | 0.5±0, 0.1 to 1.0 | 21.0±2.7, 14.0 to 26.0 | 227e | 222 |
| SR (10% NL, n = 160) | 1.0±0.5, 0.5 to 3.0 | 20.0±2.3, 12.0 to 24.0 | 159f–h | 174 |
| SR (20% NL, n = 179) | 0.5±0.1, 0.1 to 0.5 | 14.0±4.1, 6.0 to 23.0 | 205g | 224 |
| SR (30% NL, n = 189) | 0.1±0.1, 0.05 to 0.5 | 10.0±4.2, 3.0 to 20.0 | 116h | 96 |
a–hSignificant differences between rows within the same column were determined by log-rank test with significance set at P < 0.05.
iNeonatal loss (NL, loss prior to 6 months of age) has been estimated to be ~40% in free-ranging killer whale populations (Olesiuk et al. 1990, 2005). NL in free-ranging animals was modeled as follows: total estimated calves (TEC) born were first determined by dividing the total observed calves (LC) for the population across the time period by 1 minus the % NL. For example, a 10% NL was determined as follows: NL = (LC/1 − 0.1) − LC.
jNo neonatal loss was experienced for this group.
“---” represents values that cannot be determined owing to the fact that no animals in the upper age groups (> 30 years) have died.
Life expectancy cannot be determined from the data for any of the populations as the oldest known-age animals are still living. The oldest known-age animals from NR and SR are all females aged 42 years (n = 6), while the oldest animal from SEA is a founder female, with an estimated age based on length at capture of 47 years. The oldest males from both populations are estimated to be 37 years. Until life expectancy data become available, the estimated probability or odds of reaching ages 60, 70, 80, 90, and 100 years as calculated for females were 1 in 37, 1 in 431, 1 in 4,980, 1 in 57,487, and 1 in 663,673, respectively.
Population structure.
The percentage of live animals in the age group 31–40 years at the end of the study did not differ (P > 0.30) among for NSRt (estimated + known animals, n = 337), NSR (n = 313), and SEA (n = 30). The percentage of live animals within the population that were from 41 to 50 years was not significantly different (P > 0.05) between NSR (1.5%) and SEA (3.5%), nor between NSRt (6.3%) and SEA (3.5%), but differences were detected between NSRt and NSR (Fig. 5; Z = 3.06, P = 0.002). For NSRt, the percentage of animals aged 51–60 years, 61–70 years, and over 71 years were 0.9%, 0.6%, and 0.9%, respectively (Fig. 6).
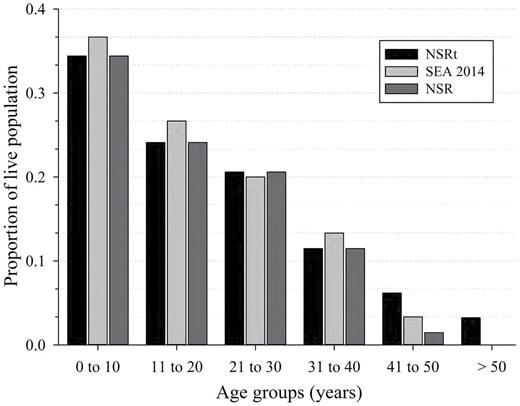
The population age structure for free-ranging killer whales (Orcinus orca) of the eastern North Pacific (NSR, northern and southern resident population from 1975 to 2015) for males and females of known-age (NSR) and for all NSR animals (estimated age + known age, NSRt) as reported on 31 December 2014. The population age structure of captive killer whales at SeaWorld Parks and Entertainment (SEA) includes known-age animals and animals whose age was estimated based on length at capture. No differences (P > 0.05) were detected in the distribution patterns of age group categories among the 3 population types prior to the 41- to 50-year category. In that category, the number of animals present as a proportion of the living population for NSR was lower than that of the value for animals of estimated age NSRt (Z = 2.38, P = 0.017).
Discussion
One of the primary measures of population health is survivorship, which can be determined for the overall population, and/or within age or sex classes. The importance of determining a baseline of expected ASR or ASR for use as a metric for detection of possible health issues in killer whale populations is illustrated by the recent Exxon Valdez oil spill, which led to an estimated 33–41% loss in local resident populations within a year of the spill (Matkin et al. 2008). Given the ASR and associated 95% CI for that population, that rate of loss can be conclusively shown to have been well outside the bounds of chance. Another example includes the decline of killer whale populations in the Crozet Archipelago apparently due to depleted fish stocks where the ASR for females decreased from 0.94 in 1977 to 0.90 in 2002 (Poncelet et al. 2010).
In addition to their role as warning systems for free-ranging populations, survivorship patterns have been recommended for evaluating the overall health of captive populations (DeMaster and Drevenak 1988; Small and DeMaster 1995). As suggested by Small and DeMaster (1995), and using methodologies described by their work, we analyzed trends in ASR over ~15-year intervals and demonstrated significant improvements in survivability of the captive SEA population. These improvements reached a point where over the last 15 years, the ASR of SEA (0.976) is not significantly different to that of the known-age NR (0.977) and SR (0.966) populations and is also not significantly different from the combined sex data ASR for the southern Alaska residents (0.979) and from recent estimates of ASR from adult males (0.971) and females (0.977) off the coast of Norway (Kuningas et al. 2013). The consistent increase in ASR for the captive population over time that our data illustrate is most likely due to advancements in husbandry practices, veterinary care, and improvements in facilities (for review, see Brando 2010). As the existing group of captive killer whales continue to be managed under the current standard of care, it is possible that the ASR will rise above that observed in wild populations, as has been reported for the bottlenose dolphin (Venn-Watson et al. 2011a). This prediction is supported by recent preliminary analyses of data for the world captive killer whale population indicating that the ASR has increased to a current value of 0.983 (DeMaster et al. 2013). Conversely, it is also possible that the ASR of the SEA population may have reached its maximum value. The oldest captive-born animals in this cohort will soon be reaching the > 30-year age category at which time the ASR for both males and females typically begins to decrease (Matkin et al. 2013).
The overall captive ASR for subsequent generation killer whales has never been described prior to this analysis, primarily due to inadequate numbers for comparison. We found that the ASR of killer whales captive-born at SEA (0.979) was significantly improved over founder animals (0.944: at-risk founder age range beginning in 1985 was 7–18, median 9 years) during the period of 1985–2015. For captive bottlenose dolphin populations, the ASR of founder animals tended to be lower than that of 1st-generation animals, but differences were not significant (Small and DeMaster 1995). The difference in ASR between founders and captive-born killer whales may reflect the older age of founders during this time period, a reduced ability of founders to acclimate to their new environment, or insufficient time for founders to benefit from improved care that has been continually evolving since 1985—a year which coincides with the birth of the 1st successful killer whale calf.
In addition to direct comparisons between populations, we used the ASR of known-age animals to determine MLE and ALE. The MLE and ALE for the SEA (28.8 and 41.6 years, respectively) and NR (29.3 and 42.3 years, respectively) populations were not significantly different from that of the combined estimated and known-age southern Alaska residents (32.7 and 47.1 years, respectively—Matkin et al. 2013). In contrast, the MLE and ALE of the SR population (20.1 and 29.0 years, respectively) were significantly reduced compared to both aforementioned values for NR and to the southern Alaska resident populations (1984–2010—Matkin et al. 2013). Values of MLE and ALE for SEA captive-born animals (33.1 and 47.7 years, respectively) were comparable to, if not greater than, all other analyzed populations. Because MLE and ALE values are calculated using the ASR for the overall population, they do not describe the changes that occur in ASR with age. However, the relative ease in which they are calculated and the summary survival data that they represent often makes them useful for comparisons between populations. While life tables would provide a more accurate age-specific estimation of longevity, they are inappropriate for the 3 populations analyzed in this study since no known-age animals have died in the older age groups (> 30 years for SEA and > 40 years for NR and SR). Thus, for the time being, MLE and ALE based on overall population ASR may be the most accurate measure of longevity.
While current age-specific survival data available in the older population ranges are insufficient for analysis, patterns in the younger categories (< 30 years) can be evaluated statistically and comparisons between SEA (2000–2015), NR (1975–2014), and SR (1975–2015) did not detect any significant differences. In direct contrast to a recent report whereby survivability estimates were reported to be lower for captive killer whales during their 1st decade of life (Jett and Ventre 2015), we show that the ASR of the SEA population during this age category was equivalent to (and numerically greater than) their free-ranging counterparts. For the next decade of life (10- to 20-year age group), the ASR of SEA animals was statistically similar to but numerically lower than that determined for free-ranging populations. Until further data can be collected, this nonsignificantly decreased ASR for the 10- to 20-year age group may indicate that this is a potentially vulnerable life stage for our captive population and this information should be considered during any future management decisions affecting this age group.
The median age for survivorship as determined by the Kaplan–Meier analysis was reduced compared to survivorship estimates calculated from the ASR for captive-born SEA animals (from 33.1 to 25.0 years) and for all SEA animals from 2000 to 2015 (from 28.8 to 24.8 years); however, Kaplan–Meier median age survivorship estimates for SEA animals remained not significantly different from those for NR (29.0 years) and SR (23.0 years) killer whale populations. This reduction in SEA median survival age using Kaplan–Meier analysis compared to that derived from the ASR is likely a function of small animal numbers in each age group within the SEA population and the fact that Kaplan–Meier analysis accounts for the changes which occur in the probability of survivorship at each age.
Our Kaplan–Meier survivability results for all SEA killer whales (2000–2015, 24.8 years) and SEA captive-born animals (25.0 years) were almost 2-fold higher than the values recently reported by Jett and Ventre (2015). Those authors report an overall (captive killer whales worldwide) median age of survival after 1985 of 11.8 years and for all captive-born of 14.1 years. The discrepancy in our findings with that of the aforementioned study is considerable. The initial steep drop in survivorship reported by those authors suggests that they have included all calf births (including calves that died within minutes of birth) in their calculations, a methodology which disallows comparisons of captive and free-ranging survivability data owing to the lack of observational data for determining survivorship of calves less than 6 months of age (Olesiuk et al. 1990, 2005). If comparisons to free-ranging populations were to be made that include using day 1 at birth for at-risk days, a correction factor for wild population to account for neonatal and early calf loss must be included. When including neonatal loss in the wild population Kaplan–Meier analysis models, we found that at just a 30% incidence of neonatal loss (only ~75% of what has been predicted in the literature—Olesiuk et al. 1990, 2005), the median survivorship of free-ranging populations significantly dropped from 23 to 10 years (SR) and from 29 to 21 years (NR). These estimates are well within the aforementioned range reported for captive killer whales by Jett and Ventre (2015). For SEA captive-born animals, if live birth data include the 2 neonates that died prior to 40 days, the median age for survivorship based on Kaplan–Meier analysis remained at 25 years.
We did not attempt to calculate longevity using life tables as described by Olesiuk et al. (1990, 2005) because, as previously stated, the oldest known-age animals are still living in both the SEA and NSR populations and none have had time to reach age 50. However, if we look at all NSRt animals, which include animals of estimated age (Olesiuk et al. 1990, 2005), we find that only 3.2% of the total number of animals are greater than 50 years of age. This result is similar to the approximate number of animals reaching greater than age 50 in table 3 from Matkin et al. (2013) and parallels the population structure of known-age NSR and SEA animals where only 2.1% and 3.5%, respectively, of living animals are 40 years and over. Despite only 3.2% of the total NSRt population being over age 50, three of these animals alive today have been given estimated ages (as of 1 January 2014) of 79 (W03), 86 (L25), and 103 (J02) years (Bigg et al. 1987; Olesiuk et al. 1990). Based on cumulative probability data from Matkin et al. (2013), the odds that these females have reached the aforementioned ages are 1 in 3,052 (W03), 1 in 16,919 (L25), and 1 in 1,382,511 (J02). Given these odds and the population structure, it appears more likely that the estimated ages assigned to these animals at the start of the study period (1973—Bigg et al. 1987; Olesiuk et al. 1990) were inaccurate. Our analysis supports a proposed longevity of between 60 and 70 years for females and 50 and 60 years for males, with the vast majority (> 97%) of animals dying by age 50. This is substantially less than the longevity of 80–90 years for females and 60–70 years for males that have been previously suggested by Olesiuk et al. (1990, 2005). The long-standing question of longevity for the killer whale will be answered definitively only as data from known-age animals continue to be collected.
Reduced male survivability has been well documented in the wild for both killer whales and the bottlenose dolphin (Bigg 1982; Olesiuk et al. 2005; Wells 2009; Matkin et al. 2013; Wells et al. 2013). Based on findings in the present study and those of Wells and Scott (1990) and Wells (2009), sex differences in not only survivability but also population structure and predicted survivability between these 2 species are remarkably similar. However, in contrast to these studies, our analyses of captive and free-ranging killer whale populations indicate that significant reductions in male survivability were only detected in the SR population.
The mortality rate index in the SEA population significantly decreased from a high of 4.1 from 1965 to 1979 to a low of 0.6 from 2005 to 2009. Mortality rates of all three 5-year time blocks over the last 15 years for SEA were less than or equal to the expected mortality rates for wild killer whales. The steady decrease in SEA mortality rates over time emphasizes the importance of closely monitoring this statistic, in conjunction with ASR, as a potential indicator of overall population health.
Female sexual maturity as determined by urinary or serum hormone monitoring has previously been reported for founder animals (animals of estimated ages) to occur from 8.3 to 9.0 years of age (Robeck et al. 1993; Katsumata 2010). However, with the maturation of known-age animals in the SEA population (n = 9), we were able to accurately establish a minimum (5.7 years) and mean (7.5 years) age at which reproductive maturation can occur. The mean and range of total body length of these animals at sexual maturation was 484cm and 435–523cm, respectively. These findings are in agreement with previous postmortem analyses of killer whales from Norwegian waters where animals were observed to be pregnant as early as 15 feet (457.2cm) in length and based on tooth analysis were estimated to be sexually mature from 6 to 8 years in age (Christensen 1984).
All SEA females (n = 5) that were with a proven male at the time of their 1st or 2nd estrus became pregnant. Thus, for wild animals, age at sexual maturity should also approximate age at 1st conception (AFC). However, the AFC for females in the SEA (~10 years) and NSR (~12.1 years) populations were significantly greater than the mean age at sexual maturity for the known-age SEA animals and the AFC reported by Christensen (1984) for adult Norwegian female killer whales. In that population, 50% of all adult Norwegian females were pregnant or lactating between 16 and 17 feet in length or an estimated 8–9 years of age. For SEA animals, this difference in sexual maturation and AFC reflects the fact that just under half of the animals were either not with a breeding male when they first began to cycle or were intentionally separated from a male during estrus (also determined by urinary or serum hormone monitoring). The difference between estimated AFC for NSR killer whales and the observed AFC of Norwegian killer whales may reflect a greater incidence of 1st calf loss for the NSR animals than what has been estimated (i.e., 40%, Olesiuk et al. 1990, 2005) and therefore by underestimating the percentage of 1st calf loss in our formula to estimate the AFC for NSR animals, it is possible that we overestimated the AFC.
However, an alternate hypothesis is that the observed increase in AFC for the NSR population may represent a true delay in sexual maturation as a result of environmental or biological (ecotype) variations, or a combination of the two. Nutritional deficiencies, resulting in decreased postweaning growth rates, are the only consistent environmental-derived factor known to delay the age of puberty across a range of animal species (Kennedy and Mitra 1963; Frisch and McArthur 1974; Ellis and Lawrence 1978; Schillo et al. 1992; Prunier et al. 1993). While reduced food availability has been used as a possible explanation of higher mortality rates in the NSR (Olesiuk et al. 2005; Ford et al. 2009), no evidence was found for prey availability affecting age at maturity in NSR populations (Ward et al. 2009a); however, those authors stated that time intervals may have been insufficient to detect such changes.
The bimodal pattern of fecundity (births) peaking at age 14 and 17 observed for the NSR was similar to that reported by Olesiuk et al. (2005) for the NR population. They attributed the 2nd peak as the point when the youngest animals were having their 2nd calf. We observed the same phenomena with the SEA population. However, the age of the initial peak (~10 years) was earlier than that of the NSR and reflects the differences in age 1st calves were born. In addition, both free-ranging and captive populations in the present study exhibited a significant linear decrease in fecundity until age 40, as has been reported previously for NSR (Olesiuk et al. 2005; Ward et al. 2009a, 2009b) and for the southern Alaska residents (Matkin et al. 2013). This decline in reproductive potential is believed to represent reproductive senescence and is also supported by a significant relationship between increased calving intervals with age in both the SEA and NSR populations evaluated herein. Reproductive senescence in killer whales, often erroneously termed menopause, has been proposed as a relatively unique strategy for the transmission of information related to population fitness (Foster et al. 2012; Brent et al. 2015; Whitehead 2015) or reproductive success (Ward et al. 2009b). However, reproductive and actuarial senescence is common in mammalian species studied to date (for review, see Nussey et al. 2013) and it therefore should not be considered an unexpected finding in killer whales.
Significant differences in AFR based on the mean age at birth of 1st calf were detected between the study populations by using estimated ages (AFR: SEA, 11.1; NSR, 14.5 years) or using the estimation method (AFRe) as previously described (Olesiuk et al. 2005; Matkin et al. 2013). The SEA AFRe of 11.0 years was also less than that previously reported for the NSR during a “period of unrestrained growth” (AFRe: 14.1±0.2 years) or during a “period of stability” (AFRe: 15.4±0.2 years—Olesiuk et al. 2005). These earlier estimates for the NR and the value we obtained for the NSR (AFR NSR: 14.0±0.02 years) were greater than that which has been observed for the known-age females in the southern Alaska resident population (12.8±0.2 years—Matkin et al. 2013). While the differences in AFR between southern Alaska resident and NSR populations might be attributed to environmental factors, the substantially higher biological potential observed for SEA animals and the North Atlantic killer whales (estimated to occur between 8 and 9 years from Christensen 1984) compared to the NSR animals seem to warrant further investigation. In addition to the nutritional factors previously discussed, environmental contaminants are believed to affect recruitment rates, possibly through increasing the incidence of abortions or early neonatal or calf loss (Ridgway and Reddy 1995; Reijnders 2003), and the NSR are known to have some of the highest concentrations of polychlorinated biphenyls contaminates among marine mammals (Ross et al. 2000). Thus, if the true AFR can be determined for the North Atlantic population, and then compared to the median age at sexual maturity (~8 years—Christensen 1984), it would provide some clues as to the normal rate of fetal and neonatal loss for primiparous cows in the North Atlantic, and consequently help to determine if the gap observed between the AFR of the North Atlantic Type 1 ecotypes (SEA animals) and North Pacific Residents are due to biological variations in maturation rates, or to fetal or neonatal loss in the latter as a result of anthropogenic stressors.
As expected, the MGL of 532 days (range: 473–567 days) in the captive population was similar to previous reports of gestation length from a subset of this population (Duffield et al. 1995; Robeck and Nollens 2013). A mean gestation of 545 days (n = 4) was reported for 2 killer whales in another captive population (Katsumata 2010) and falls within the range observed for SEA animals. While no data exist for early neonatal loss in wild killer whales, the 6.5% loss reported herein for SEA is low when compared to a captive population of bottlenose dolphins (2 of 14, 14.3%; under the most current management practices—Venn-Watson et al. 2011a), beluga (3 of 21, 14.3%—Robeck et al. 2005), and to other mammalian species (cattle: 11.7%—Raboisson et al. 2013; horse: 11%—Morley and Townsend 1997; giraffe: 14%—Bercovitch et al. 2004; Asian elephant: 26–29%, African elephant: 12–37%—Saragusty et al. 2009). The CSR to 2 years of age for SEA animals (0.966) was significantly higher than that observed for the SR population (0.799) and but not significantly greater when compared to the NR (0.869). As discussed previously, the differences in neonatal loss and calf survival between captive and free-ranging killer whale populations may be due to a number of factors including nutrition, pollution, or other anthropogenic stressors such as whale watching or other vessel traffic (Ayres et al. 2012).
Our findings provide evidence for the similarity in life-history parameters of known-age animals from captive and free-ranging killer whale populations. These results have application for use in future research concerning the overall health of both populations and provide support for the utility of captive populations as models for understanding the impacts of anthropogenic stressors on free-ranging population physiology and long-term sustainability. Future research with captive populations can be directed toward evaluating methods for detecting early pregnancy and the development of sex-specific fertility potential tests, which if successful, will help population managers further characterize if, when, and how anthropogenic stressors are affecting reproduction in wild killer whales.
Supporting Information
The Supporting Information documents are linked to this manuscript and are available at Journal of Mammalogy online (jmammal.oxfordjournals.org). The materials consist of data provided by the author that are published to benefit the reader. The posted materials are not copyedited. The contents of all supporting data are the sole responsibility of the authors. Questions or messages regarding errors should be addressed to the author.
Supporting Information S1—A list of animals that have lived at SeaWorld Parks from 1965 until through 20 April 2015.
Supporting Information S2—A current list of killer whales in the northern (1 January 2014) and southern resident (1 January 2015) populations as determined from available publications and online resources.
Acknowledgments
We acknowledge the efforts of R. Baird, K. Balcomb, M. Bigg, G. Ellis, and J. Ford for collecting and disseminating data on wild killer whale populations, without their initial and continued efforts this comparative work could not have been possible. We thank Ms. H. Robeck for her editorial comments. We thank the animal training, animal care, and veterinary staff of SeaWorld Parks and Entertainment and Mr. B. Andrews for their support for this project. This is a SeaWorld technical contribution number 2014-05-C.
Literature Cited
Author notes
Associate Editor was Jeanette A. Thomas.

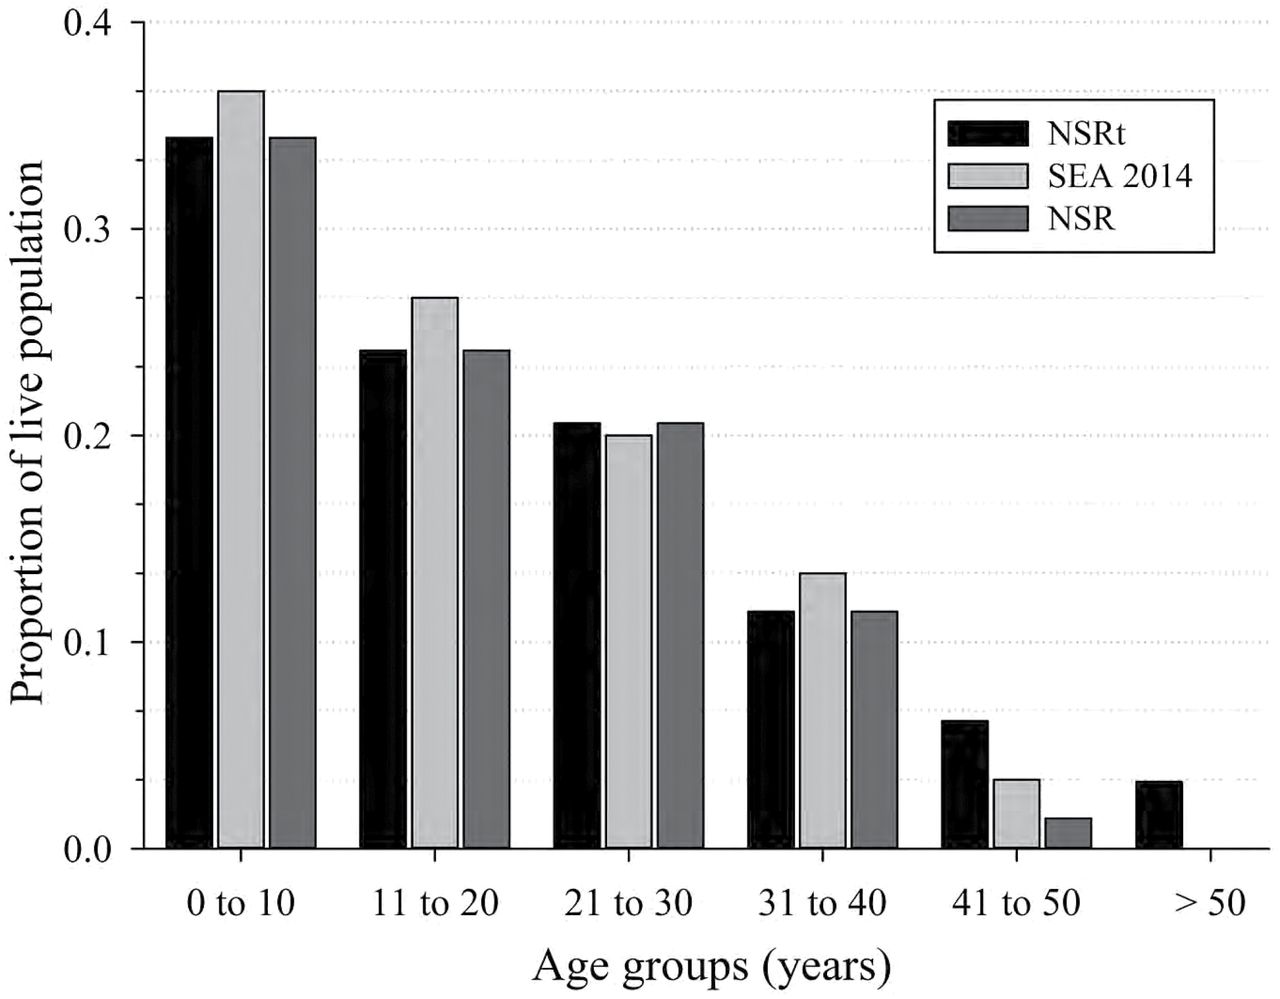
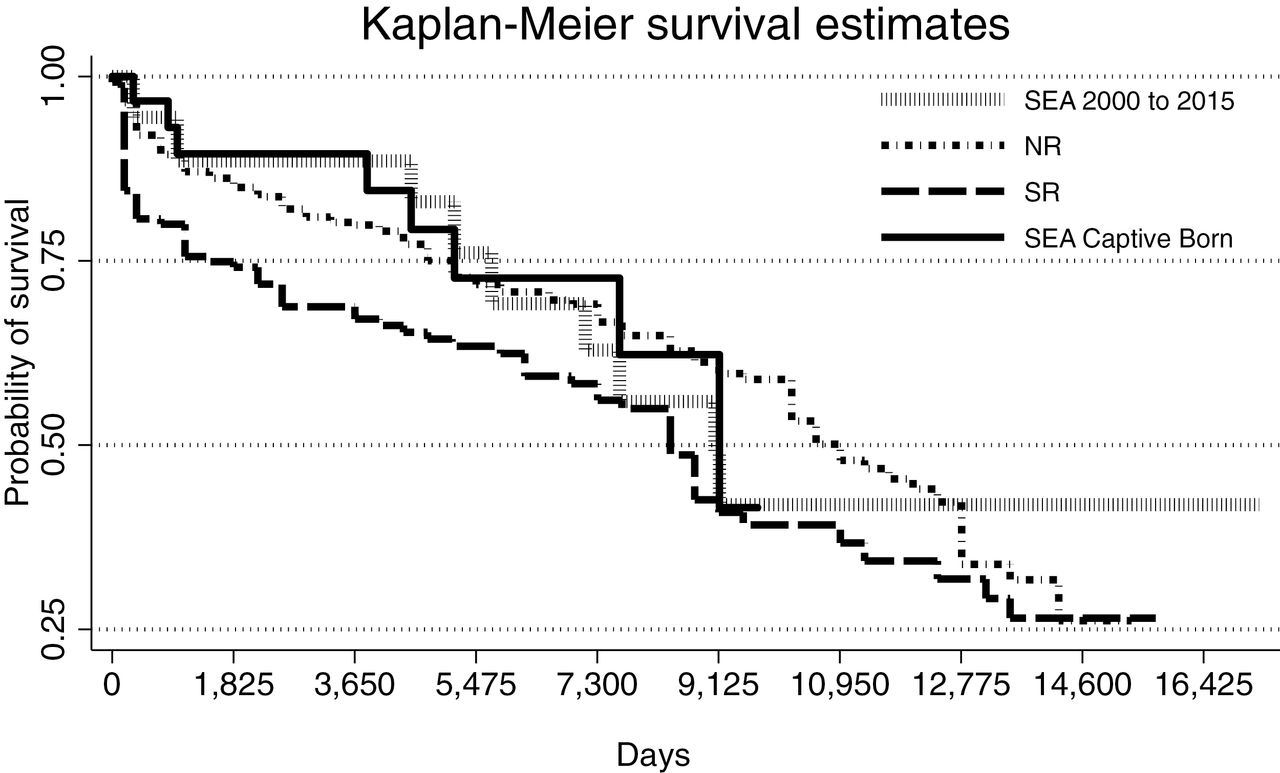
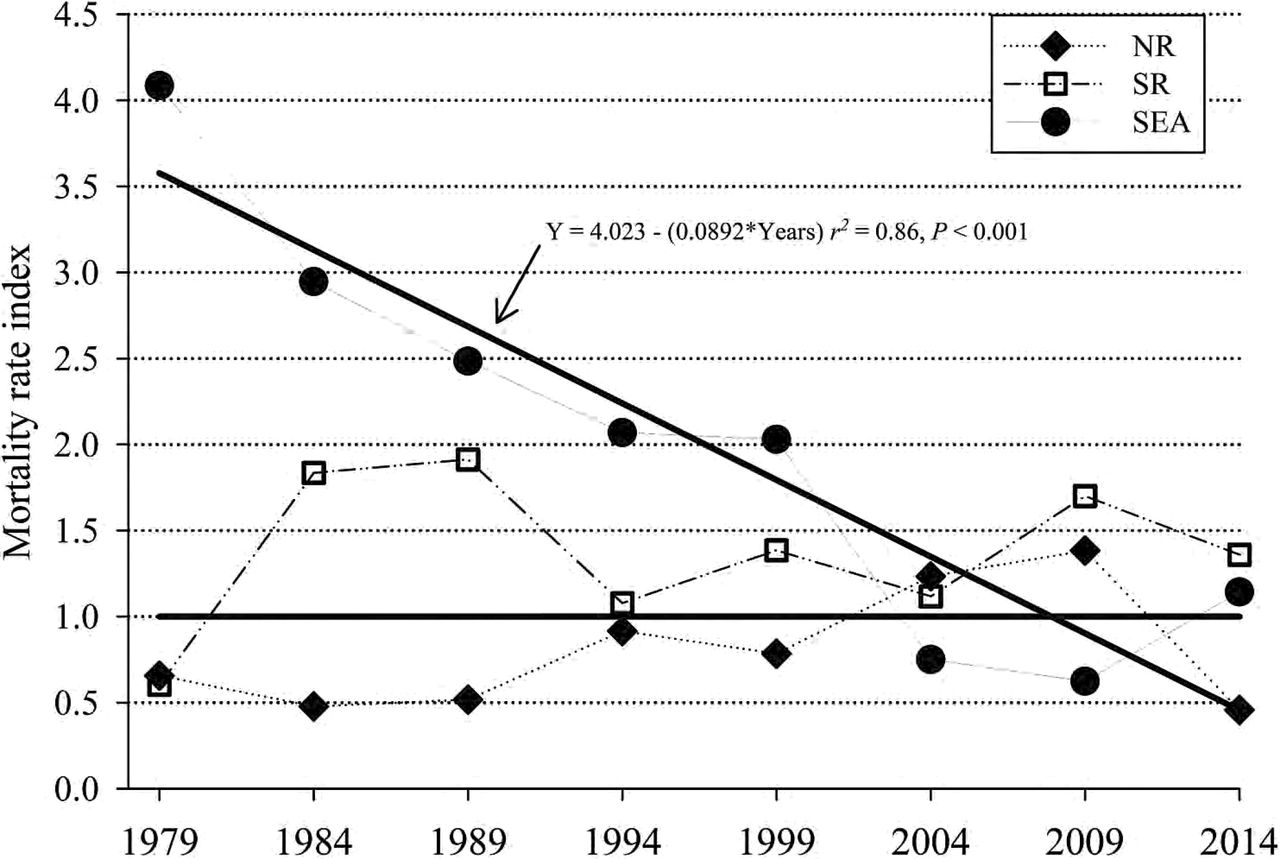
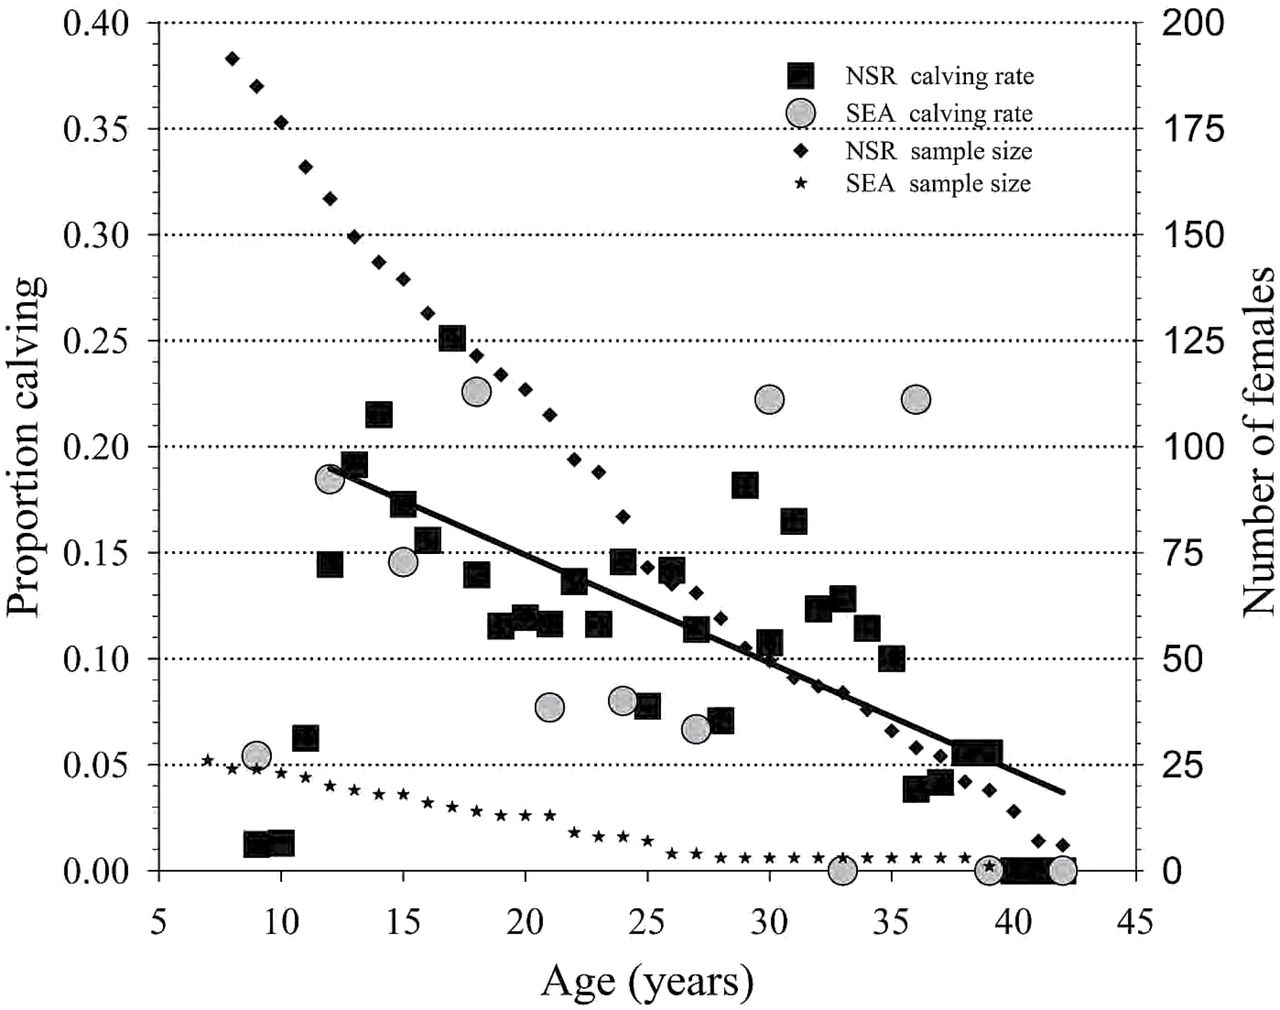