


Abstract
Lion manes represent a compromise between social benefits and ecological costs. Mane development of Panthera leo varies geographically with prevailing climate, but varying genetics, behavior and social systems, and nutrition may all influence such broad-scale correlations. We studied captive lions housed comparably across 12 degrees of latitude in North America and correlated mane variation with climatic, life-history, and husbandry variables. As predicted from heat-load considerations, mane length and density were inversely correlated with temperature; color variation was unrelated. Mane development was correlated with January but not July conditions, suggesting a stronger response to cold than to heat. Climate-induced variation in manes of captives accounted for up to 50% of variation seen. Developmental effects of climate appear to be responsible for many of the taxonomic names applied to African lions and may signify important biological differences between modern and Pleistocene lions.
Mammalian behavior, physiology, and ecology are known to be evolutionarily labile, exhibiting great plasticity among individuals and populations (Blomberg et al. 2003; Boesch et al. 2002; Hammond et al. 2001; Komers et al. 1994; Nussey et al. 2005; Réale et al. 2003; Rezende et al. 2004). Although individual history, such as nutrition and exercise, can be clearly manifested in mammalian morphology (Anderson 2000; Brin et al. 2005; Patton and Brylski 1987; Pette and Staron 2001; Zuccarelli 2004), examples of environmentally induced plasticity are less common (cf. West-Eberhard 2003). Certainly, homeostasis and determinate growth typify mammals and limit such morphological variability (Vaughan et al. 2000; Young 1957). Some of the clearest examples involve temperature effects on pelage, such as the “pointed” coloration of Siamese cats (Lyons et al. 2005) and hair density increasing at higher latitudes (e.g., Fooden 2005). Plastic responses of morphology should be especially apparent in sexually selected characteristics, if these traits are to honestly reflect the quality of the individual (Atmar 1991; Badyaev 2004b; Kodric-Brown and Brown 1984). For example, supplemental feeding can appreciably affect antler size and quality in red deer, Cervus elaphus, but typically has limited effects on body weight or fecundity (Putman and Staines 2004). Badyaev (2004a) discussed the specialized developmental requirements and genetic architecture of a trait that must simultaneously be exaggerated yet honest.
The lion's mane has been called “the only really striking example of sexual dimorphism in the Carnivora” (Ewer 1973:78). Lions (Panthera leo) are the only cats with manes. Males typically develop manes at maturation but lose them if castrated or chronically dominated, so manes appear to be dependent on androgens (Guggisberg 1961; West 2005). Manes are used exclusively in lion interactions, communicating a lion's physical condition to intimidate other males and intimidate or attract females (Bertram 1978; Patterson 2004; Pusey and Packer 1983; Schaller 1972). But manes are costly in terms of natural selection: they entail growth and maintenance, make lions more conspicuous to prey and cumbersome in maneuvering, harbor parasites, and impede heat exchange (Patterson 2004; West and Packer 2002; Yamaguchi et al. 2004).
There is substantial variation in the morphology of manes across the lion's geographic range, as well as within single populations. In northern Tanzania, mane condition is not heritable but reflects an individual's recent nutrition and intrasexual fighting success; manes were also found to increase thermoregulatory costs (West and Packer 2002). Elsewhere in Africa, lions vary in density, sex roles, social systems, and mane development (both larger and smaller than in northern Tanzania), making it difficult to generalize these relationships with confidence (Funston et al. 1998; Kat and Harvey 2000; Kays and Patterson 2002; Spong et al. 2002; Yamaguchi et al. 2004). Study of broader geographic variation in manes is surprisingly dated and anecdotal, primarily based on travelogues and sportsmen's accounts dating to the 19th century (but see Hemmer 1962, 1974). Nonetheless, an emerging pattern confirms the temperature effect, with extensively maned lions at higher latitudes and elevations and essentially maneless animals in hot, dry areas (Kays and Patterson 2002; Patterson 2004; Yamaguchi et al. 2004).
For free-living lions, manes represent a compromise between social advantages and ecological or physiological costs that is influenced by various genetic and environmental factors. To untangle these complications we examined a situation where nutrition and social system were effectively controlled and genetic population structure randomized. We assessed the geographic variation in manes of lions in zoological parks. We predicted that mane variation among zoo lions would reflect the climatic regimens in which each lives, showing especially strong correlations with temperature. Because earlier studies emphasized the heat-stress costs of manes, we predicted a negative relationship between summer temperatures and mane development.
Materials and Methods
We evaluated mane condition across a broad transect of American zoos in which lions are comparably maintained and managed, with daily access to indoor and outdoor enclosures, unlimited water, and similar diets and maintenance schedules. One of us (BDP) visited 23 zoos housing lions during a 3-week period in spring (31 March through 18 April 2004) and took numerous 6-megapixel color photographs of male lions, documenting all mane fields (see Fig. 1). Interviews and subsequent correspondence with keepers, curators, registrars, and directors supplied information on age, reproductive condition, diet, personal history, and social groupings. Six zoos housed lions of known ancestry (P. l. krugeri) and 16 zoos exhibited 18 male lions considered by International Species Information System (ISIS) to be P. leo hybrids (www.isis.org). To reduce possibilities for lineage-specific effects, we studied mane variation in 18 hybrids and 1P. l. krugeri. Although their pedigrees have not been documented and their genetic relatedness is unknown, the hybrid population should exhibit genetic structure that is random with respect to geographic location.
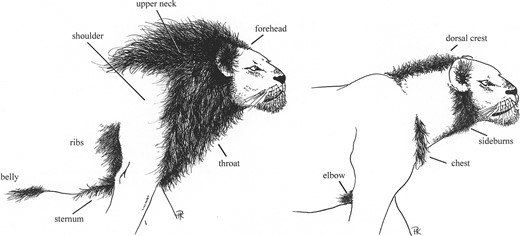
Components of the lion's mane, identifying the 11 fields analyzed in this study. The diagram, modified from Kays and Patterson (2002), originally depicted variation among free-living lions in Kenya; the captives we studied were at least as well maned as the lion on the left.
Mane development was evaluated by a standard protocol. For each lion, we created a plate of 6–8 color photos depicting the mane's 11 identifiable fields (Fig. 1; one such plate is shown in the Online Supplement at http://fml.fieldmuseum.org/aa/Files/patterso/J_Mamm_supplement.pdf). We then generated random groupings of 10 lions or plates. Former volunteers of Earthwatch Institute's “Lions of Tsavo” project and a handful of others, “blind” both to the study's purpose and the lion's identities, were asked to gauge manes. Using a 10-page file of coded plates, a data score sheet, and written instructions, 26 volunteers ranked the 11 mane fields of each lion according to 3 attributes: length, density, and color, from longest, densest, and darkest (rank 1) to shortest, sparsest, and palest (10). Despite the inherent subjectivity, volunteers were asked to avoid duplicate scores and provide explicit rankings (forced rankings) based solely on their interpretation of the photos. The 33 field-attribute rankings were set-dependent, but, because each lion was evaluated in 10–19 trials (mean 13.0), lions were eventually ranked alongside each of the other 18 lions in the study. We multiplied the volunteer-assigned rankings by —1, so that positive correlations with environmental factors would be associated with larger, denser, and darker manes, and used nonparametric statistics (rank-correlation and Mann-Whitney U-test) on median scores for individual fields. Means of rankings over 11 fields and 10–19 volunteers served for generalized estimates of “length,” “density,” and “color”; all 33 ranks contributed to “overall” mane scores. Parametric statistics (correlation and regression) were performed on these composite variables. In view of the numerous correlations involved, a sequential Bonferroni correction (using the program MacBonferroni-w by Marley Watkins; http://www.ed.psu.edu/researchandfunding/search.asp?fac=309) was applied to assess experiment-wide significance levels.
Besides accessible life-history variables (age, weight, reproductive status), we assembled climate records from the National Climate Data Center, using “climate normals” (monthly averages for the period 1971–2000) for the weather station closest to each zoo. This database provided monthly minimum, maximum, and mean temperatures; precipitation; and heating and cooling degree-days. Degree-days tally average temperature departures from 65±F (18.3±C), a reference point for human comfort—each degree F of temperature above 65±F is counted as 1 cooling degree-day, whereas each degree below 65±F is counted as 1 heating degree-day, so that a day whose average temperature equals 80±F represents 15 cooling degree-days. These cannot be converted to degrees Celsius.
To examine the robustness of our scores to outliers, we reran all analyses using a pruned dataset, in which we discarded the 2 highest and 2 lowest rankings for each field attribute and recalculated medians and means; there were negligible differences in the resulting analyses.
Results
The 19 lions and 17 zoos (Table 1) were situated in 8 states, spanning 12 degrees of latitude (29±57′N to 41±33″N) and 32 degrees of longitude (89±35′W to 122±15″W). They varied in mean January temperature from − 6.4±C to 12.4±C, in mean July temperature from 18.3±C to 30.3±C, and in annual precipitation from 528 to 1618 mm. They ranged in heating degree-days (days below 65±F) from 1,174 to 6,436 and in cooling degree-days from 377 to 3,179. As expected, January temperatures were strongly correlated with each other and with heating degree-days (all r > 0.96), whereas July temperatures were strongly correlated with each other and with cooling degree-days (all r > 0.85). Precipitation was correlated with July temperatures, latitude, longitude, and cooling degree-days (r > 0.60), but less so with heating degree-days. Latitude was correlated with each of the climatic variables, inversely with all save heating degree-days (all r > 0.50). However, only those r > 0.68 are judged to be significant by a Bonferroni correction (P < 0.05). Correlations among climatic and geographic variables appear in the Online Supplement.
Locations where zoo lions were evaluated in this study and their variation in mean climate normals, mean monthly temperatures and annual precipitation, 1971–2000. Heating degree-days record day-by-degree Fahrenheit deviations below 65±F (18.3±C) and cooling degree-days record day-by-degree deviations for temperatures above 65±F. Climate data are from nearest station and National Climatic Data Center database; coordinates are in decimal degrees from zoo address.
| Mean monthly temperature (±C) | |||||||||||
|---|---|---|---|---|---|---|---|---|---|---|---|
| Precipitation | January | July | Heating | Cooling | |||||||
| City | Latitude | Longitude | (mm) | Maximum | Mean | Minimum | Maximum | Mean | Minimum | degree-days | degree-days |
| Zoo location | |||||||||||
| Alexandria, Louisiana | 31.29 | −92.46 | 1,561 | 14.5 | 8.9 | 3.3 | 33.8 | 28.5 | 23.2 | 1,908 | 2,602 |
| New Orleans, Louisiana | 29.92 | −89.99 | 1,619 | 17.1 | 12.2 | 7.4 | 33.1 | 28.5 | 23.9 | 1,208 | 3,016 |
| Des Moines, Iowa | 41.55 | −93.62 | 882 | −1.6 | −6.4 | −11.3 | 30.0 | 24.5 | 18.9 | 6,436 | 1,052 |
| Tyler, Texas | 32.36 | −95.31 | 1,150 | 14.0 | 8.6 | 3.2 | 34.2 | 28.6 | 22.8 | 1,958 | 2,521 |
| Dallas, Texas | 32.75 | −96.81 | 941 | 13.0 | 7.7 | 2.4 | 35.6 | 30.3 | 24.9 | 2,219 | 2,878 |
| Lufkin, Texas | 31.34 | −94.76 | 1,184 | 15.1 | 9.2 | 3.3 | 34.2 | 28.1 | 22.1 | 1,900 | 2,480 |
| Peoria, Illinois | 40.71 | −89.58 | 915 | −0.7 | −5.3 | −9.8 | 29.8 | 23.9 | 18.1 | 6,097 | 998 |
| Houston, Texas | 29.70 | −95.40 | 1,371 | 17.4 | 12.4 | 7.3 | 34.2 | 29.2 | 24.1 | 1,174 | 3,179 |
| Monroe, Louisiana | 32.46 | −92.09 | 1,355 | 13.3 | 7.8 | 2.2 | 34.6 | 28.6 | 22.6 | 2,190 | 2,517 |
| Memphis, Tennessee | 35.15 | −89.97 | 1,388 | 9.2 | 4.4 | −0.4 | 33.4 | 28.1 | 22.7 | 3,041 | 2,187 |
| Coal Valley, Illinois | 41.44 | −90.43 | 966 | −1.2 | −6.1 | −10.9 | 30.1 | 24.1 | 18.1 | 6,415 | 969 |
| Oakland, California | 37.76 | −122.16 | 583 | 13.9 | 10.5 | 7.1 | 22.6 | 18.3 | 13.9 | 2,400 | 377 |
| Oakland, California | 37.76 | −122.16 | 583 | 13.9 | 10.5 | 7.1 | 22.6 | 18.3 | 13.9 | 2,400 | 377 |
| Salina, Kansas | 38.83 | −97.62 | 818 | 3.9 | −1.7 | −7.3 | 34.1 | 27.4 | 20.7 | 4,952 | 1,600 |
| Salina, Kansas | 38.83 | −97.62 | 818 | 3.9 | −1.7 | −7.3 | 34.1 | 27.4 | 20.7 | 4,952 | 1,600 |
| Sacramento, California | 38.51 | −121.49 | 583 | 13.9 | 10.5 | 7.1 | 22.6 | 18.3 | 13.9 | 2,400 | 377 |
| St. Louis, Missouri | 38.62 | −90.26 | 987 | 3.2 | −1.4 | −6.0 | 32.5 | 27.1 | 21.6 | 4,650 | 1,633 |
| Vallejo, California | 38.15 | −122.25 | 672 | 13.7 | 8.8 | 4.0 | 28.1 | 20.3 | 12.5 | 2,689 | 529 |
| Topeka, Kansas | 39.06 | −95.71 | 905 | 2.9 | −2.7 | −8.2 | 31.7 | 25.8 | 19.8 | 5,225 | 1,357 |
| X̄ | 36.12 | −99.46 | 1,014.79 | 9.44 | 4.54 | −0.36 | 31.12 | 25.54 | 19.92 | 3,379.68 | 1,697.32 |
| SD | 4.01 | 12.25 | 324.45 | 6.61 | 6.74 | 6.94 | 4.27 | 3.98 | 3.89 | 1,796.49 | 957.98 |
All 19 male lions had large manes (a plate showing a “near-average” lion is depicted in the Online Supplement). All had water ad libitum, were fed 6 days weekly with 7–10 kg of horse-meat or beef diets, were penned with or adjacent to lionesses, and had access to indoor and outdoor enclosures year-round. None had recently sired offspring owing to a Species Survival-Taxon Advisory Group moratorium on breeding of genetically unknown animals (T. Wagener, pers. comm.). To assess age-related variation in development, we included lions ranging in age from 1.7 to 18 years in age (mean 11.1, SD = 4.8), but only 2 were younger than 7 years and age was un-correlated with any median ranking (−0.23 < r < 0.23). Mass ranged from 148 to 220 kg (mean 183 kg; SD = 19.75). Mass was positively correlated (r > 0.6) with several variables (neck and chest length, chest density, and chest and throat color), but only the last was significant (P < 0.05). Mass was uncorrelated with climatic and geographic variables. Nine lions were re-productively competent and 9 had vasectomies, but manes did not differ between groups (Mann-Whitney test; all P > 0.05).
Correlations of the suite of climatic and geographic variables with the 33 attribute fields (Table 2) were uniformly non-significant when a Bonferroni correction was applied. However, correlations were as high as rs= 0.76; 20 of those involving length fields exceeded rs > 0.5, as did 20 of those involving density, and 7 of those with color. Sternum, ribs, and belly fields were involved in 38 of these 47 higher correlations.
Spearman rank-correlation coefficients between medians of mane fields and climatic and geographic variables (n = 19). All of the values are judged to be nonsignificant by sequential Bonferroni tests; with size of correlations marked to indicate pattern: * r > 0.50, ** r > 0.60, and *** r > 0.70.
| Fields | |||||||||||
|---|---|---|---|---|---|---|---|---|---|---|---|
| Attributes | Forehead | Crest | Neck | Shoulder | Sideburns | Throat | Chest | Elbow | Sternum | Ribs | Belly |
| Length | |||||||||||
| Precipitation | 0.23 | 0.14 | 0.12 | 0.18 | 0.09 | 0.03 | 0.04 | 0.10 | −0.08 | −0.04 | −0.31 |
| January maximum | −0.41 | −0.11 | −0.08 | −0.31 | −0.26 | −0.32 | −0.02 | −0.39 | −0.61* | −0.50* | −0.65** |
| January mean | −0.56* | −0.22 | −0.06 | −0.31 | −0.33 | −0.38 | −0.04 | −0.52* | −0.59* | −0.53* | −0.57* |
| January minimum | −0.60** | −0.25 | −0.08 | −0.31 | −0.38 | −0.41 | −0.07 | −0.52* | −0.58* | −0.49 | −0.53* |
| July maximum | 0.43 | −0.01 | −0.34 | −0.23 | −0.06 | −0.12 | −0.21 | 0.17 | −0.25 | −0.28 | −0.45 |
| July mean | 0.38 | 0.03 | −0.21 | −0.13 | −0.07 | −0.12 | −0.14 | 0.13 | −0.30 | −0.30 | −0.52* |
| July minimum | 0.29 | 0.05 | −0.12 | −0.02 | −0.05 | −0.06 | −0.06 | 0.16 | −0.25 | −0.24 | −0.52* |
| Heating degree-days | 0.24 | 0.07 | 0.10 | 0.31 | 0.27 | 0.34 | 0.08 | 0.38 | 0.62** | 0.59 | |
| Cooling degree-days | 0.28 | 0.08 | −0.12 | −0.03 | −0.04 | −0.05 | −0.06 | 0.13 | −0.32 | −-0.26 | −0.54* |
| Latitude | 0.25 | 0.12 | 0.15 | 0.31 | 0.33 | 0.40 | 0.15 | 0.38 | 0.55* | 0.50* | 0.68** |
| Longitude | 0.35 | 0.34 | 0.38 | 0.45 | 0.27 | 0.29 | 0.22 | 0.17 | 0.29 | 0.18 | 0.06 |
| Density | |||||||||||
| Precipitation | 0.10 | 0.09 | 0.05 | 0.20 | 0.46 | 0.11 | −0.08 | 0.37 | −0.16 | −0.18 | −0.24 |
| January maximum | −0.40 | −0.38 | −0.33 | −0.41 | −0.16 | −0.36 | −0.50* | −0.36 | −0.59* | −0.62** | −0.67** |
| January mean | −0.42 | −0.45 | −0.30 | −0.43 | −0.26 | −0.45 | −0.46 | −0.45 | −0.51* | −0.57* | −0.57* |
| January minimum | −0.45 | −0.50* | −0.33 | −0.42 | −0.30 | −0.49 | −0.48 | −0.42 | −0.49 | −0.53* | −0.52* |
| July maximum | 0.10 | −0.03 | −0.25 | −0.14 | 0.03 | −0.05 | −0.37 | 0.14 | −0.49 | −0.31 | −0.48 |
| July mean | 0.10 | −0.09 | −0.26 | −0.09 | 0.09 | −0.08 | −0.36 | 0.20 | −0.48 | −0.35 | −0.51* |
| July minimum | 0.09 | −0.09 | −0.15 | 0.03 | 0.19 | −0.05 | −0.25 | 0.25 | −0.39 | −0.29 | −0.47 |
| Heating degree-days | 0.27 | 0.32 | 0.34 | 0.42 | 0.13 | 0.35 | 0.56* | 0.34 | 0.67** | 0.68** | 0.76*** |
| Cooling degree-days | 0.06 | −0.10 | −0.18 | −0.03 | 0.20 | −0.05 | −0.31 | 0.25 | −0.45 | −0.34 | −0.48 |
| Latitude | 0.31 | 0.36 | 0.32 | 0.33 | 0.10 | 0.39 | 0.56* | 0.23 | 0.61** | 0.59* | 0.69** |
| Longitude | 0.34 | 0.41 | 0.39 | 0.49 | 0.70*** | 0.35 | 0.38 | 0.45 | 0.21 | 0.11 | 0.13 |
| Color | |||||||||||
| Precipitation | −0.13 | 0.15 | 0.14 | 0.24 | −0.22 | −0.28 | 0.02 | 0.16 | −0.03 | −0.20 | −0.32 |
| January maximum | −0.20 | 0.26 | 0.19 | 0.03 | −0.10 | 0.02 | −0.02 | −0.12 | −0.49 | −0.41 | −0.66** |
| January mean | −0.22 | 0.23 | 0.22 | 0.06 | −0.10 | 0.09 | 0.02 | −0.18 | −0.47 | −0.41 | −0.59* |
| January minimum | −0.20 | 0.22 | 0.25 | 0.08 | −0.06 | 0.11 | 0.03 | −0.16 | −0.47 | −0.39 | −0.56* |
| July maximum | −0.17 | 0.10 | 0.04 | −0.08 | −0.42 | −0.44 | −0.27 | 0.10 | −0.20 | −0.16 | −0.34 |
| July mean | −0.15 | 0.16 | 0.15 | 0.03 | −0.36 | −0.37 | −0.20 | 0.12 | −0.23 | −0.25 | −0.46 |
| July minimum | −0.10 | 0.21 | 0.22 | 0.21 | −0.36 | −0.27 | −0.12 | 0.09 | −0.18 | −0.21 | −0.46 |
| Heating degree-days | 0.25 | −0.23 | −0.22 | 0.01 | 0.22 | 0.11 | 0.11 | 0.12 | 0.51* | 0.50* | 0.76*** |
| Cooling degree-days | −0.13 | 0.18 | 0.16 | 0.16 | −0.32 | −0.31 | −0.16 | 0.06 | −0.23 | −0.28 | −0.46 |
| Latitude | 0.24 | −0.27 | −0.25 | −0.04 | 0.21 | 0.15 | 0.08 | 0.03 | 0.42 | 0.42 | 0.70*** |
| Longitude | 0.12 | 0.13 | 0.20 | 0.39 | −0.06 | −0.07 | 0.26 | 0.15 | 0.29 | 0.01 | 0.03 |
Mean rankings of the 3 attributes across 11 mane fields were correlated with these same variables (Table 3). Density fields showed significant inverse correlations with “coldness” variables (January temperatures and heating degree-days), as did length variables (albeit more weakly), whereas color fields were not correlated with climatic or geographic variables. When plotted against mean January temperature (Fig. 2), regressions for length and density were significant (P < 0.01) and descriptive, describing 41% and 48%, respectively, of variation in those attributes (adjusted R2 values). The regression of mean color was nonsignificant and described essentially no variation (adjusted R2 = 0.1%). Mean January temperature alone described 35% of overall mane variation (P < 0.005).
Product-moment correlations between composite mane variables and climatic and geographic variables. Significance levels, as assessed by sequential Bonferroni trials, are indicated by plus symbol (+) for P < 0.1 and by asterisk (*) for P < 0.05.
| Length | Density | Color | |
|---|---|---|---|
| Precipitation | 0.07 | 0.09 | 0.03 |
| January maximum | −0.67+ | −0.72* | −0.27 |
| January mean | −0.67+ | −0.71* | −0.24 |
| January minimum | −0.66+ | −0.69* | −0.21 |
| July maximum | 0.05 | 0.06 | −0.12 |
| July mean | 0.05 | 0.05 | −0.10 |
| July minimum | 0.05 | 0.05 | −0.06 |
| Heating degree-days | 0.65+ | 0.69* | 0.26 |
| Cooling degree-days | −0.15 | −0.17 | −0.15 |
| Latitude | 0.44 | 0.49 | 0.23 |
| Longitude | 0.43 | 0.46 | 0.11 |
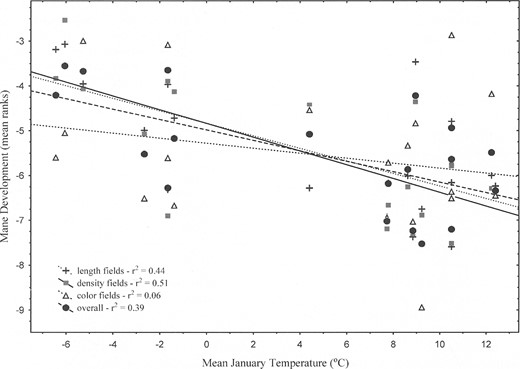
Mean rankings of 19 lions for mane length, density, and color, and overall mean score for all 33 rankings, plotted against mean January temperature (TJan). The simple linear regressions describe 6–51% of variation in mane characteristics. The equations are as follows: Length = −4.83351676 − 0.140007748 × TJan (P < 0.05); Density = −4.83579946 − 0.153794886 × TJan (P < 0.05); Color = −5.27678674 − 0.0558061256 × TJan (n.s.); and Overall = −4.98173776 − 0.116564463 × TJan (P < 0.05).
Discussion
Zoo lions have larger manes than is typical of wild lions, as has been recognized for some time (Hollister 1917). Better nutrition, higher testosterone levels, less abrasion or wear, and stronger climatic effects (see below) could all contribute to this difference. Supplemental feeding commonly produces larger antlers in managed populations of white-tailed deer, Odocoileus virginianus (Perkins 1991), and zoo lions undoubtedly feed better and more frequently than their wild counterparts. Body mass was positively correlated with mane development in 26 of the 33 fields analyzed, quite strongly in some, although only 1 correlation was judged significant.
Accordingly, mane variation was assessed differently in zoos than in the field (cf. Kays and Patterson 2002). Virtually all these captives would have received near-maximal scores by our earlier method. More subtle differences among captives required finer-scaled assessments (rankings from 1–10, not 1–3) and the inherent subjectivity of such rankings required higher replication (up to 19 evaluators, not 1). The ribs and belly fields, which are seldom maned in free-ranging lions, were added to reflect variation among captives. Climate variables were more frequently correlated with sternum, rib, and belly fields than with fields (e.g., neck, throat, and shoulder) that are more consistently hairy in wild lions. This may reflect hetero-topy, or progressive recruitment of additional pelage fields to form the mane (cf. West-Eberhard 2003). Analyzing geographic and ontogenetic variation in how mane components are assembled or recruited might help to elucidate the developmental mechanisms involved.
Significant correlations between mane development and climatic variables (Fig. 2) corroborate inferences from field studies that temperature affects mane development (Kays and Patterson 2002; Nagel et al. 2003; West and Packer 2002). Although confirming both conventional wisdom and legions of anecdotes, this is the 1st quantitative correlation of mane variation with climate over a regional or continental scale. This geographic pattern apparently exists in the absence of underlying genetic differentiation. Although genetic differentiation of African lions is modest (Dubach et al. 2005), the potential in nature for population substructuring (Spong and Creel 2002; Spong et al. 2002) and for local genetic adaptation (Garant et al. 2005) is real. Because the genetics of these captive lions should be homogenized through cross-breeding and translocations, their mane development patterns must be due to individual plasticity, not local adaptation.
We found that climate per se explains a substantial part—up to half—of observed variation in manes. However, this probably represents an upper limit to the effects of climate in nature, owing to our experimental controls. Manes of free-ranging lions are affected by genetics, social context, nutrition, and history all interacting with climate to reflect an individual's condition (cf. Larsen 2004). Because our captives had similar genes, diets, and rearing conditions, these factors contributed less in our study than they might normally in the wild.
Climatic variables showed stronger correlations with length and density fields than with color, and all significant correlations involved temperature. This accords with interpretations that temperature stress is a primary influence on mane development. Both hair length and density affect insulation, but color variation in free-living lions more closely reflects age, hormones, and nutrition (West and Packer 2002). The only strong correlations with color fields involved the sternum, ribs, and belly; lions lacking guard hairs in these fields were evaluated as being pale or background-colored. The correlations in Table 2 may result from this covariation. We find no evidence for the temperature-sensitive pigmentation patterns seen in Himalayan rabbits and Siamese cats, where pelage fields with lower temperatures, such as the extremities, become more highly mela-nized (cf. Levinton 1988; Lyons et al. 2005).
Cold January temperatures showed stronger correlations with mane variation than did hot July temperatures. This is remarkable because heat stress is usually considered the driving force behind mane loss in lions (Kays and Patterson 2002; Patterson 2004; West and Packer 2002). However, those studies spanned a tiny portion of the lion's geographic and climatic range and may not be relevant to understanding the evolution or development of manes in temperate regions, such as the recently extirpated lions of the Mediterranean and Cape regions of Africa or Quaternary populations in Eurasia and North America (Nagel et al. 2003; Yamaguchi et al. 2004; Yamaguchi and Haddane 2002). January temperatures for many of our lions lie below the thermoneutral zone of 9±C to 33±C (McNab 2000), and therefore constitute cold stress. Yet manes do not represent an adaptation to reduce heat loss, or else smaller lionesses (and other species of temperate-zone cats) would grow manes (cf. Nagel et al. 2003).
In hot, arid landscapes, manes are reduced by an unidentified physiological mechanism presumably triggered by thermoregulatory stress (Kays and Patterson 2002; West and Packer 2002). Our results suggest that low temperatures stimulating mane development may be an equally or more important trigger. In any case, the mane's ‘norm of reaction’—the range of possible phenotypes for any genotype (Dobzhansky 1970) — to temperature is extremely broad, extending from the extensive manes and dense woolly coats of lions in northern menageries to the scant manes and sparse coats of equatorial, arid-land lions (Nagel et al. 2003). The developmental mechanisms involved in environmental controls on gene expression (Gilbert 2005) and on the inheritance of epigenetic traits (Jablonka and Lamb 2002) remain elusive. Future studies of developmental variation in manes should also track the length and density of body pelage as a covariate.
Stronger correlation of “coldness” indicators (January temperatures and heating degree-days) with mane development may simply reflect the fact that we assessed manes during the spring, before summer heat stress commenced. Certainly, all the captives we studied have manes large enough to interfere with heat loss in summer. We have observed that mane length and density vary seasonally (see also West and Packer 2002), and the condition of the mane in autumn may better correlate with July temperatures. However, captive lions have unlimited access to water and can cool themselves by panting freely, which may lessen the reduction of mane size in hot weather.
Finally, many of the 23 scientific names proposed for African lions are based on variations in the color and size of manes (Meester and Setzer 1971 [as revised 1977]; Patterson 2004; Yamaguchi et al. 2004). West and Packer (2002) showed that manes have very low heritabilities, befitting a sexually selected character that must be resistant to cheating. Concurrently, Dubach et al. (2005) documented very modest genetic differentiation of African lions. It is reasonable to hypothesize that most regional variation in manes reflects climate and other environmental influences, rather than demarcating evolution-arily significant units within P. leo. This may also have been true for Pleistocene lions, whose Holarctic range exposed them to colder temperatures than at present (Turner and Anton 1997). Pleistocene lions are thought to have had small manes, because of low population density (Guthrie 1990) and the absence of manes in Ice Age artifacts and cave paintings (Packer and Clottes 2000; Yamaguchi et al. 2004). However, cold temperatures elicit larger, more extensive manes in modern lions over the same geographic range. Differential response of manes to cold temperate environments may be a significant biological difference between populations of modern lions, P. leo, and their Pleistocene relatives in Eurasia and North America, which are usually treated as distinct subspecies (P. l. spelaea and P. l. atrox, respectively). Conceivably, this developmental difference could be marshaled to justify their allocation to separate species (Burger et al. 2003; Hemmer 1974). Certainly, climate has exposed novel phenotypic variation in manes to the combined actions of natural and sexual selection (West-Eberhard 2005).
Acknowledgments
We wish to thank the numerous persons, mainly Earthwatch volunteers on our “Lions of Tsavo” teams, who aided this project by the essential but very time-consuming job of evaluating lion manes: A. Bell, D. Beringer, P. Cialdella, L. Couvert, K. Evans, E. Fernandez, A. French, J. Garvin, H. Golden, L. Hansen, Shawn M., C. Mehta, L. Michaels, B. Murray, A. Mwazo, S. Palmer, T. Patterson, F. Pillsbury, N. Powers, M. Rowe, J. Sarmiento, K. Street, J. Tucker, and D. Verlench. The senior author thanks the following persons for expediting his visits to zoos housing lions: S. Bircher, B. Brown, E. Calcagno, L. Caratti, J. Clauson, B. Dresser, M. Evans, C. Falzone, L. Field, E. Harris, B. Hill, K. Kaemmerer, G. Karr, A. Kouba, S. Lubianski, M. Miller, V. Musselman, M. Reed, J. Schweitzer, S. Stainback, P. Stanley, T. Stalf, T. Wagener, and especially L. Whitt. We owe a special debt of gratitude to A. Garoza, who painstakingly assembled the photographic plates, hounded volunteers, and compiled the ranking sheets; to K. Deering who proofed them; and to J. Knittle for copious clerical assistance. This project was supported by the Earthwatch Institute (5123) and the Barbara E. Brown Fund of The Field Museum, with travel support from the Oakland Zoo and Memphis Zoo. W. Atmar, J. Fooden, H. Golden, B. Harney, M. Kearney, M. West-Eberhard, N. Yamaguchi, and 2 anonymous reviewers offered helpful suggestions on the manuscript.
Literature Cited
Author notes
Present address of VMS: Department of Geography, Pennsylvania State University, University Park, PA 16802, USA
Associate Editor was Rodrigo A. Medellín.
