


Abstract
Seasonal food habits and activity patterns were examined for grizzly bears (Ursus arctos) in west-central Alberta, Canada, to better understand habitat requirements in a threatened population. Food habits were based on an analysis of 665 feces collected from 18 grizzly bears between April and October 2001–2003. Trends in the use of foods were comparable to those of other central Rocky Mountain populations, with minor differences likely reflecting regional habitat and forage availability. Five activities (bedding, sweet vetch digging, insect feeding, frugivory, and ungulate kills) were identified for each of 1,032 field-visited global positioning system radiotelemetry locations from 9 female grizzly bears. We predicted the probability of each activity during relevant periods by time of day (crepuscular, diurnal, and nocturnal) and habitat. Selection ratios were used to assess which habitat and time periods were selected. Activity patterns changed considerably over a 24-h period, with foraging activities occurring mostly during diurnal and crepuscular periods and bedding at night. Habitats were important predictors of activity. Forested areas were selected for bedding areas, whereas digging, insect-foraging, and frugivory activities were associated with herbaceous, recently disturbed forest and open-canopy forests. We suggest that researchers consider behavior and time of day in analyses of habitat selection to improve explanations of habitat use and mechanisms of selection.
In western North America, habitat loss caused by increases in human population and associated land-use pressures has threatened numerous wildlife species (Woodruffe 2000). Extirpations from historic areas often occur before habitat requirements are recognized and appropriate conservation measures instigated (Soulé and Kohm 1989). Grizzly bears (Ursus arctos) well represent this group (Mattson and Merrill 2002; McLellan 1998) because of low reproductive rates and densities, making them susceptible to population decline (Purvis et al. 2000; Russell et al. 1998). Given such vulnerabilities and large area requirements, grizzly bears have been considered a focal or flagship species for conservation planning (Carroll et al. 2001; Noss et al. 1996, 2002). To provide management and conservation recommendations, however, recognition of specific habitat requirements is needed. Nowhere in Canada is this more imperative than Alberta, where grizzly bear populations face risk of population decline because of oil and gas exploration and development, timber harvesting, mining, and human recreation (Ross 2002).
Grizzly bear diet and use of seasonally abundant, nutrientrich food sources has been well documented throughout their range in North America (Craighead et al. 1995; Hamer and Herrero 1987; Hamer et al. 1991; Mattson et al. 1991; McLellan and Hovey 1995). A wide diversity of foods is consumed, reflecting the species' omnivorous and generalist nature. Food-habit relations are therefore often locally variable, making extrapolations from other populations difficult. Even within a population, annual and seasonal variations in food productivity can alter behavior and demography (Bunnell and Tait 1981; Jonkel and Cowan 1971; Rogers 1987). When autumn food productivity is low, bears travel great distances to locate high-quality foods (Garshelis and Pelton 1981; Rogers 1977, 1987), potentially impacting survival and future reproduction (Pease and Mattson 1999). Even without annual and seasonal variation, discrimination of foods can occur between sexes. Larger males rely more on animal protein to sustain their large body mass, whereas females can persist on vegetative diets alone (Hobson et al. 2000; Jacoby et al. 1999; Rode et al. 2001). Therefore, food distribution and abundance influence use of habitats (Hatler 1967; Jonkel and Cowan 1971).
Grizzly bear habitat use has been widely documented within the Central Rockies of Canada (Apps et al. 2004; Gibeau 1998; Hamer and Herrero 1987; Hamer et al. 1991; McLellan and Hovey 2001; Mueller et al. 2004; Nielsen et al. 2002, 2003, 2004a; Stevens 2002; Theberge 2002). Although providing useful information on selection of habitats, such studies do not consider the activity of the animal (i.e., bedding, root digging, frugivory, etc.) to be important (however, see Hamer and Herrero 1987). Consequently, interpretations are generalized and our understanding of the important differences among activities is lost. As well as considering animal activity, few have also considered time of day, despite probable difference in habitat use. In fact, to our knowledge no one has reported on activity patterns for grizzly bears relative to both habitat and time of day in the Central Rockies region. Finally, although general diet studies have been completed for areas of the Central Rockies, no large-scale study has been completed for west-central Alberta. Grizzly bear populations here are unique in that they occupy both mountainous and foothill (boreal) environments. Although much is known of diets in mountainous areas, little is known of the diets of grizzly bears living in boreal forests managed for multiple human uses. Here we describe seasonal food habits and activity patterns of grizzly bears in west-central Alberta, Canada, to help provide information on habitat needs for a threatened population.
Materials and Methods
Study area.—The study area encompasses 10,000 km2 of the Canadian Rocky Mountains (∼25%) and foothills (∼75%) of west-central Alberta, Canada (Fig. 1). In the mountains, forests consist of spruce (Picea englemanii × glauca), lodgepole pine (Pinus contorta), and subalpine fir (Abies lasiocarpa), with alpine meadows and rock outcrops at higher elevations. On the other hand, foothill environments are composed of lodgepole pine stands; black spruce (Picea mariana) and tamarack (Larix laricina) bogs; mixed aspen (Populus tremuloides), lodgepole pine, and white spruce (Picea glauca) forests; open marshes; and low-gradient riparian areas. Human activities in the foothills include oil and gas exploration and development, forestry, mining, hunting, human settlements, and recreation activities. The mountains, although having much less human activity, contain extensive recreational use.
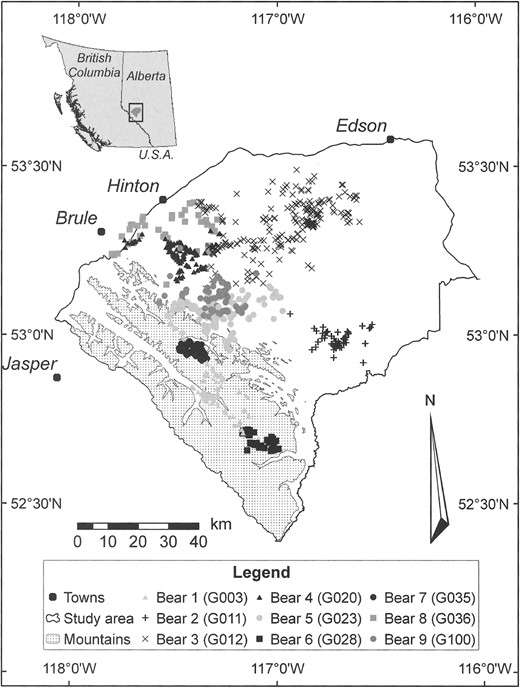
Map of west-central Alberta, Canada, study area showing study boundary, towns, mountains (> 1,700 m elevation), and visited grizzly bear (by individual) global positioning system (GPS) radiotelemetry locations from 2001 to 2003. Location of study area (black rectangle) with respect to Alberta and British Columbia illustrated at upper left.
With wide variation in habitats and geography, potential prey for grizzly bears is diverse. Moose (Alces alces), elk (Cervus elaphus), white-tailed deer (Odocoileus virginianus), mule deer (O. hemionus), and American beaver (Castor canadensis) are common. Mountainous areas also support hoary marmot (Marmota caligata), bighorn sheep (Ovis canadensis), and Columbian ground squirrels (Spermophilus columbianus). Other large carnivores common to the area include cougar (Puma concolor), wolf (Canis lupus), and American black bear (Ursus americanus).
Field methods.—Between spring 2001 and 2003, adult and subadult bears were captured using standard aerial-darting and leg-snaring techniques. Captured bears were fitted with either a Televilt (Lindesburg, Sweden) global positioning system (GPS)-Simplex radiocollar or ATS (Advanced Telemetry Systems, Isanti, Minnesota) GPS radiocollars. Radiocollars were programmed to acquire locations at fixed 4-h intervals. All capture and collaring efforts followed procedures reviewed and revised by the Canadian Council on Animal Care for the safe handling of bears. Our research protocols were further approved by the Animal Care Committee at the Western College of Veterinary Medicine in Saskatoon, Saskatchewan. All capture and handling methods also were consistent with the guidelines of the American Society of Mammalogists (Animal Care and Use Committee 1998).
During April-October 2001–2003, we collected 665 feces from 6 (4 female and 2 male) subadult (2-4 years old) and 12 (9 female and 3 male) adult (>5 years old) grizzly bears during field investigations of GPS radiotelemetry locations. An attempt was made to obtain a representative sample size given the constraints on available personnel, access to study area, and available radiocollared animals. Individual bears were stratified into either mountain or foothills based on home-range location. Mountain bears were defined as those having >80% of their home range within the mountains (elevations > 1,700 m), with the remaining being classified as foothills bears. For each bear, 1 location per day was randomly selected for field visitation. We used truck, helicopter, and foot travel to access GPS bear locations that had presence of bears in the previous 2 weeks, and searched for fecal deposits. We navigated to each use location using uploaded waypoints in handheld GPS units. At each location, personnel performed an intensive and systematic search for feces over a 20-m-radius area representing the average error of Televilt and ATS GPS collars (Fraer et al. 2004). Feces collected at each location were assumed to belong to the bear whose location we were investigating and were collected only if the fecal sample appeared fresh (i.e., <2 weeks old). Often multiple feces were found at a site. However, to minimize the bias associated with oversampling and subsequently overrepresenting any 1 particular use location, only 1 fecal sample was collected per site. Occasionally more than 1 fecal sample was collected at a location if it was established, through visual investigation, that each sample contained obvious dietary differences. All collected fecal samples were frozen until subsequent analyses of diet were performed. For overall assessments of diet, fecal samples were pooled across individuals and years for each of the foothills and mountain groups.
In addition to collection of fecal samples, a subsample of grizzly bear GPS locations from 9 females (7 adults and 2 subadults) was assessed for bear activity (Fig. 1). As with fecal deposits, personnel systematically searched a 20-m-radius area for evidence of bear sign. Five signs of activities were considered: bedding (depression in vegetation and soil), sweet vetch digging (disturbed soil at sweet vetch sites), frugivory (shrub damage, berries missing or on ground, etc.), insect feeding (dug-up ant mounds or turned-over logs, stumps, rocks, etc.), and ungulate kills (presence of bones and hair). Other activities, such as herbaceous feeding and movement, left little if any obvious sign or were too ephemeral in nature to consistently identify. We concentrate instead on the assessment of the 5 primary activities that left the most obvious and, therefore, the most easily identifiable signs.
Laboratory analysis of diet (feces).—Scat analysis follows the methods of Mealey (1975). Samples were thawed and rinsed in a 2-mm sieve until only macroscopic components remained. Any loss of small seeds or other items was noted at this time. Remaining components were placed in a 1-liter container and agitated with water to disperse food items. Subsamples were drawn, transferred to a shallow pan, and visually estimated to determine relative percentage volume of each food item. Correction factors from Hewitt and Robbins (1996) were applied to estimates to account for biases in differences of recognizable fecal residue produced by different foods and converted to actual digestible dry matter. Because correction factors are subject to error depending on the volume of identifiable, nondigestible animal remains, animal matter may be underestimated (Hewitt and Robbins 1996).
Probability of activity by time of day and habitat.—At each use location, we defined the activity (1 for activity present, 0 if not present) of the animal (bedding, root digging, frugivory, insect feeding, and ungulate kills). Some locations contained multiple activities at a site and thus had multiple activity records. Because some activities can occur only during a particular time of the year, we defined relevant seasons for each activity based on threshold amounts of digestible dry matter of selected foods from assessments of diet. Sunrise, sunset, and civil twilight tables (http://www.cmpsolv.com/los/sunset.html, accessed 20 November 2005) were used to define crepuscular (morning twilight to sunrise and sunset to evening twilight), diurnal (sunrise to sunset), and nocturnal (evening twilight to morning twilight) time periods. All tables were based on expected conditions for the center of the study area (Robb, Alberta, Canada; 53°N, 117°W) and a Mountain Time zone. For each activity, we estimated a random effect (using a random intercept for individual animal) logistic regression model using the 3 time-of-day categories as predictors of activity (Skrondal and Rabe-Hesketh 2004). Indicator contrasts were used with the diurnal period chosen as reference group (Long and Freese 2003). For each activity, probabilities were estimated with 90% confidence intervals and significance (P < 0.1) was compared among categories. Resulting probabilities reflected the likelihood of an activity by time of day relative to all other activities.
After determining the significance of time of day, we estimated probability of activity relative to significant time-of-day groups and each of 10 habitat types (Nielsen et al. 2004a; Table 1). Closed forest was chosen as the reference category in indicator contrasts of habitat type. For final models, probability of activity and 90% confidence intervals were estimated for each activity, significant time-of-day period, and habitat type. Using predicted probabilities of activity for habitats, we estimated habitat selection ratios (ŵ—Manly et al. 2002). Probability of activity was assumed to represent use, whereas the proportions of habitats within 100% minimum convex polygon home ranges (Samuel and Fuller 1994) were used to assess habitat availability. Selection ratios were standardized (Bi) so that selection summed to 1, allowing an estimate of probability of use, given the condition of all habitats being equally available.
Habitats (Nielsen et al. 2004a) used to assess grizzly bear activity and selection in west-central Alberta, Canada. Habitat availability (percentage) was based on the average composition of habitats in individual multiannual grizzly bear home ranges using minimum convex polygons.
| Habitat type | Description | Habitat availability (%) |
|---|---|---|
| Alpine—subalpine | Herbaceous areas > 1,700 m where clusters of trees (<20% crown closure) are mixed with grasses, sedges, and forbs | 2.7 |
| Open forest | Coniferous or deciduous forests with <60% crown closure | 4.7 |
| Closed forest | Coniferous or deciduous forests with >60% crown closure | 40.1 |
| Mixed forest | Forested areas having both coniferous and deciduous trees with less than 80% dominance of either type | 10.7 |
| Wet forest | Wet treed areas (semiopen to closed) typically dominated by black spruce (Picea mariana) and tamarack (Larix laricina) | 1.5 |
| Regenerated forest | Open or partially timbered site where timber harvest has disturbed natural vegetation | 11.7 |
| Herbaceous | Herbaceous areas < 1,700 m including mine site reclamation. | 1.1 |
| Shrub | Areas greater than 50% shrub cover | 7.1 |
| Anthropogenic | Areas altered by humans, including residential and industrial (well sites, pipelines, and transmission lines) sites | 3.0 |
| Nonvegetated | Nonvegetated areas including rock, water, ice, shadow, and cloud | 17.4 |
Results
Grizzly bear diets.—Diets of grizzly bears were diverse, varying both temporally and spatially. In total, 40 separate food items exceeding 1% digestible matter in feces were identified. We combined individual food items into 9 primary groups, examining each for seasonal patterns of use and differences among mountain and foothills environments (Table 2). Sweet vetch (Hedysarum) root digging dominated early-spring or pre-green-up (den emergence to the end of May) diets. Use of ungulate matter was greatest during late spring (late May to late June), although differences in ungulate use among foothills and mountain bears were substantial (Table 2). During peak use in early June, the amount of ungulates in diets was much greater in the foothills (49%) than in mountains (20%). Although scat analyses did not distinguish species of ungulates, site investigations revealed that moose were most common (83%), particularly neonates (54%), with white-tailed and mule deer (16%) and elk (1%) more minor in composition. Rodents, insects (primarily ants), and birds also were consumed (Fig. 2a). Green vegetation, which included horsetails (Equisetum), graminoids, and forbs, dominated early summer (July) diets. Cow parsnip (Heracleum lanatum), clover (Trifolium), and peavine (Lathyrus ochroleucus) were consumed most frequently, with alfalfa (Medicago sativa), dandelions (Taraxacum officinale), and willow (Salix) being relatively minor overall (Fig. 2b). As fruit ripened in early August (late summer), diet increasingly consisted of soopolallie (Shepherdia canadensis)and mountain huckleberry (Vaccinium membranaceum). Although less dominant, 4 other fruits were identified in the diets of bears (Fig. 2c). These included lingonberry (Vaccinium vitis-ideae), bearberry (Arctostaphylos uva-ursi), raspberry (Rubus idaeus), and wild sarsaparilla (Aralia nudicaulis). Berries were consumed until mid-September, at which time sweet vetch roots once again increased in dominance (Table 2). Bears used this root until den entry.
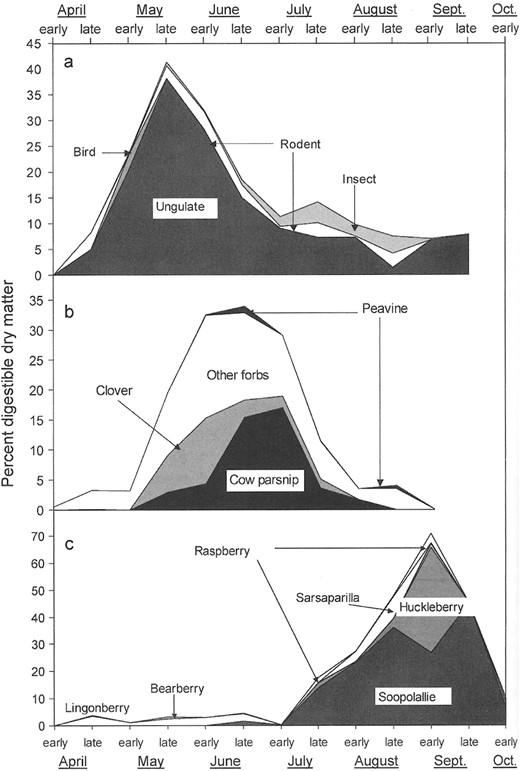
Seasonal trends in amount of digestible dry matter content of dominant food items found in grizzly bear feces collected in west-central Alberta between 2001 and 2003 as classified within 3 major food categories: a) animal matter, b) forbs, and c) fruit.
A comparison of the percentage of digestible dry matter consumed for major food items in grizzly bear feces collected in bimonthly periods in the foothills (Ft) and mountains (Mtn) of west-central Alberta, Canada, with total number of feces (n) collected representing a multiannual composite of 3 years of sampling from 2001 to 2003.
| n | Grasses | Horsetails | Sedges | Forb | Fruit | Roots | Insects | Ungulate | Miscellaneous | |||||||||||
|---|---|---|---|---|---|---|---|---|---|---|---|---|---|---|---|---|---|---|---|---|
| Ft | Mtn | Ft | Mtn | Ft | Mtn | Ft | Mtn | Ft | Mtn | Ft | Mtn | Ft | Mtn | Ft | Mm | Ft | Mm | Ft | Mm | |
| Late April | 23 | 3 | 7 | 6 | 1 | 0 | 0 | 0 | 16 | 0 | 7 | 0 | 54 | 93 | 0 | 1 | 15 | 0 | 0 | 0 |
| Early May | 20 | 4 | 3 | 1 | 7 | 0 | 0 | 0 | 0 | 0 | 2 | 0 | 78 | 99 | 0 | l | 10 | 0 | 0 | 0 |
| Late May | 45 | 19 | 10 | 13 | 6 | 0 | 0 | 0 | 4 | 3 | 4 | 2 | 53 | 61 | 1 | 1 | 21 | 17 | 0 | 2 |
| Early June | 49 | 13 | 25 | 8 | 5 | 4 | 0 | 0 | 5 | 0 | 5 | 1 | 11 | 71 | 0 | 0 | 49 | 20 | 0 | 0 |
| Late June | 43 | 7 | 35 | 32 | 3 | 1 | 0 | 0 | 22 | 9 | 7 | 0 | 2 | 56 | 3 | 1 | 27 | 0 | 0 | 0 |
| Early July | 79 | 15 | 36 | 17 | 3 | 8 | 0 | 0 | 30 | 57 | 0 | 0 | 1 | 6 | 5 | 0 | 20 | 0 | 0 | 7 |
| Late July | 42 | 16 | 11 | 14 | 0 | 6 | 4 | 0 | 30 | 24 | 30 | 1 | 0 | 35 | 6 | 10 | 14 | 1 | 1 | 0 |
| Early August | 72 | 34 | 12 | 12 | 0 | 1 | 0 | 0 | 18 | 33 | 42 | 10 | 11 | 30 | 3 | 7 | 12 | 5 | 1 | 0 |
| Late August | 33 | 18 | 4 | 1 | 0 | 1 | 0 | 0 | 13 | 4 | 44 | 62 | 24 | 14 | 4 | 4 | 8 | 7 | 1 | 7 |
| Early September | 36 | 7 | 16 | 0 | 0 | 0 | 0 | 0 | 3 | 0 | 63 | 80 | 5 | 4 | 0 | 0 | 8 | 2 | 3 | 13 |
| Late September | 9 | 1 | 3 | 0 | 0 | 0 | 0 | 0 | 6 | 0 | 28 | 78 | 46 | 0. | 0 | 0 | 11 | 0 | 4 | 22 |
| Early October | 10 | 0 | 5 | — | 0 | — | 0 | — | 0 | — | 10 | — | 79 | — | 0 | — | 8 | — | 0 | — |
Differences in diet between mountain and foothill regions.— The most apparent difference between mountain and foothills regions was the reduction in or lack of ungulate matter in the diets of bears in the mountains (Table 2). Bears in the mountains had higher root content in their diet. In the mountains, root consumption lasted 2 weeks longer in the early summer and began 2 weeks earlier in the late summer and early fall. Large elevation gradients also facilitated longer root-digging seasons by extending the availability of desired root conditions before leaf emergence and after leaf senescence. Although we did not quantify the availability of ungulates, it appeared that ungulate density was greater in the foothills. This delay or shift in food item use between regions also extended to other foods including the forbs and fruits.
Probability of grizzly bear activity.—In total, 1,032 GPS radiotelemetry locations were field visited between 2001 and 2003. Based on diet analyses and specified thresholds, we defined specific seasons for each of the 5 examined activities before estimating probability of activity (Table 3). All of the activity models were highly significant. Because bedding occurred for all seasons and was not based on diet, we used all 1,032 locations to estimate the probability of bedding. Of 1,032 locations, bedding was detected at 179 sites. Bears were significantly more likely to bed during the nocturnal period (27.9%) than either the diurnal (13.0%) or crepuscular (8.2%) periods (Table 4). There was no detectable difference in the probability of bedding between diurnal and crepuscular periods (Table 4). Bedding probability was highest in forested habitats, including closed, open, mixed, and wet forests (Table 5). When the proportion of available habitats was considered, wet forest was selected more often than other habitats (Table 5).
Seasonal delineation of activities based on diets of grizzly bears, as determined by fecal analysis, in the mountains or foothills of west-central Alberta, Canada. Analyses of animal activity were only considered when diets exceeded threshold values.
| Activity type | Mountains | Foothills | Threshold rule |
|---|---|---|---|
| Bedding | Year-round | Year-round | None |
| Sweet vetch digging | Late April through late June; late July through late August | Late April through early June; early August through early October | ≥10% dry matter |
| Frugivory | Early August through late September | Late July through early October | ≥ 10% dry matter |
| Ungulate kill | Late May through early June | Late April through late July | ≥10% dry matter |
| Insect feeding | Late July through late August | Late June through late August | ≥3% dry matter |
Estimated probability (Prob.) of activity (with lower and upper 90% confidence intervals [CI ]) by time of day (crepuscular, diurnal, or nocturnal) for field-visited female grizzly bear global positioning system locations in west-central Alberta, Canada. Different lowercase letters indicate significant (P < 0.1) differences among temporal groups.
| Grizzly bear use activity | No. locations | Crepuscular | Diurnal | Nocturnal | |||
|---|---|---|---|---|---|---|---|
| Prob, of activity | 90% CI | Prob, of activity | 90% CI | Prob, of activity | 90% CI | ||
| Bedding | 1,032 | 0.082a | 0.048-0.136 | 0.130a | 0.101-0.165 | 0.279b | 0.221-0.346 |
| Ungulate kill | 620 | 0.076a | 0.033-0.165 | 0.069a | 0.043-0.108 | 0.059a | 0.031-0.112 |
| Frugivory | 391 | 0.236ab | 0.151-0.349 | 0.262a | 0.212-0.320 | 0.157b | 0.106-0.229 |
| Insect foraging | 529 | 0.133ab | 0.079-0.215 | 0.217a | 0.168-0.276 | 0.137b | 0.090-0.201 |
| Root digging | 703 | 0.367a | 0.263-0.485 | 0.349a | 0.282-0.423 | 0.238b | 0.174-0.318 |
Probability (Prob.) of bedding and digging (90% confidence intervals [CI ]), selection ratios (ŵi) of estimated probability of bedding and digging to proportion available, and standardized selection ratios (Bt) of bedding and digging summing to 1 by time of day and habitat type in west-central Alberta, Canada. Probabilities are interpreted as the likelihood of bedding or digging by habitat and time of day compared to all other activities or undefined activity sites. Anthropogenic habitats are those areas altered by humans (e.g., roads, pipelines, etc.).
| Crepuscular and diurnal | Nocturnal | ||||||||
|---|---|---|---|---|---|---|---|---|---|
| Activity | Habitat type | Prob. | 90% CI | Ŵi | Bi | Prob. | 90% CI | Ŵt | Bi |
| Bedding | Alpine-subalpine | 0.095 | 0.057–0.154 | 3.5 | 0.139 | 0.228 | 0.142–0.344 | 8.41 | 0.156 |
| Anthropogenic | 0.025 | 0.010–0.060 | 0.83 | 0.033 | 0.067 | 0.028–0.153 | 2.23 | 0.041 | |
| Closed forest | 0.213 | 0.161–0.278 | 0.53 | 0.021 | 0.433 | 0.342–0.528 | 1.08 | 0.02 | |
| Herbaceous | 0 | — | 0 | 0 | — | 0 | |||
| Mixed forest | 0.153 | 0.089–0.250 | 1.43 | 0.057 | 0.336 | 0.210–0.492 | 3.14 | 0.058 | |
| Nonvegetated | 0 | — | 0 | 0 | — | 0 | |||
| Open forest | 0.192 | 0.139–0.260 | 4.08 | 0.162 | 0.401 | 0.306–0.505 | 8.51 | 0.158 | |
| Regenerating forest | 0.062 | 0.035–0.109 | 0.54 | 0.021 | 0.158 | 0.091–0.259 | 1.35 | 0.025 | |
| Shrub | 0.027 | 0.005–0.131 | 0.38 | 0.015 | 0.072 | 0.014–0.300 | 1.02 | 0.019 | |
| Wet forest | 0.212 | 0.142–0.305 | 13.87 | 0.551 | 0.431 | 0.313–0.558 | 28.19 | 0.523 | |
| Digging | Alpine-subalpine | 0.589 | 0.505–0.668 | 21.74 | 0.291 | 0.491 | 0.386–0.597 | 18.12 | 0.311 |
| Anthropogenic | 0.071 | 0.026–0.175 | 2.33 | 0.031 | 0.049 | 0.017–0.128 | 1.61 | 0.028 | |
| Closed forest | 0.197 | 0.138–0.274 | 0.49 | 0.007 | 0.142 | 0.091–0.214 | 0.35 | -0.006 | |
| Herbaceous | 0.269 | 0.107–0.531 | 24.01 | 0.321 | 0.198 | 0.072–0.440 | 17.71 | 0.303 | |
| Mixed forest | 0.21 | 0.116–0.349 | 1.96 | 0.026 | 0.151 | 0.077–0.277 | 1.41 | 0.024 | |
| Nonvegetated | 0.183 | 0.058–0.451 | 1.05 | 0.014 | 0.131 | 0.039–0.360 | 0.75 | 0.013 | |
| Open forest | 0.225 | 0.163–0.304 | 4.78 | 0.064 | 0.164 | 0.108–0.241 | 3.47 | 0.06 | |
| Regenerating forest | 0.366 | 0.271–0.473 | 3.14 | 0.042 | 0.28 | 0.187–0.396 | 2.4 | 0.041 | |
| Shrub | 0.727 | 0.574–0.841 | 10.3 | 0.138 | 0.642 | 0.460–0.791 | 9.09 | 0.156 | |
| Wet forest | 0.076 | 0.032–0.171 | 4.96 | 0.066 | 0.052 | 0.021-0.126 | 3.42 | 0.059 | |
Root digging was the only activity with an early and late season. In the foothills, the early season was defined as the period from late April to early June, whereas the late season was defined as the period between early August and early October (Table 3). In the mountains, the early root-digging season occurred from late April to late June, and the late season from late July to late August (Table 3). Based on these seasonal delineations, 703 locations were considered potential root-digging sites and of these, rooting activity was detected at 253 sites. Root digging was more common during diurnal and crepuscular periods. Bears were more likely to dig for roots during daylight (diurnal, 34.9% and crepuscular, 36.7%), than nighttime periods (23.8%; Table 4). Sweet vetch digging was most prevalent in shrub, alpine, and subalpine habitats (Table 5). Although alpine and subalpine habitats also contained high selection ratios, selection for shrub habitats during sweet vetch digging was less than that of herbaceous habitats (Table 5).
Insect foraging began 1 month earlier in the foothills than in the mountains, occurring from late June to late August in the foothills compared with late July to late August for the mountains (Table 3). In total, 529 locations were considered potential insect-foraging sites and of these, sign was detected at 213 sites. Although insect feeding was most likely to occur during the diurnal time period (21.7%; Table 4), there was no detectable difference in the probability of insect feeding between either crepuscular and diurnal or crepuscular and nocturnal periods. Insect foraging occurred most frequently within regenerated forests (Table 6). However, when the availability of habitats was considered, wet forest was selected more often than other habitat types (Table 6).
Probability (Prob.) of frugivory and insect foraging (90% confidence intervals [CI ]), selection ratios (ŵi) of estimated probability of frugivory and insect foraging to proportion available, and standardized selection ratios (Bi) of frugivory and insect foraging summing to 1 by time of day and habitat type in west-central Alberta, Canada. Probabilities are interpreted as the likelihood of frugivory or insect foraging by habitat and time of day compared to all other activities or undefined activity sites. Anthropogenic habitats are those areas altered by humans (e.g., roads, pipelines, etc.).
| Crepuscular | Diurnal | Nocturnal | |||||||||||
|---|---|---|---|---|---|---|---|---|---|---|---|---|---|
| Activity | Habitat type | Prob. | 90% CI | ŵi | Bt | Prob. | 90% CI | Ŵi | Bt | Prob. | 90% CI | Ŵt | Bi |
| Frugivory | Alpine-subalpine | 0.119 | 0.049-0.262 | 4.39 | 0.066 | 0.098 | 0.042-0.210 | 3.61 | 0.063 | 0.064 | 0.025-0.152 | 2.34 | 0.059 |
| Anthropogenic | 0.104 | 0.028-0.319 | 3.46 | 0.052 | 0.086 | 0.025-0.254 | 2.84 | 0.05 | 0.055 | 0.015-0.183 | 1.83 | 0.046 | |
| Closed forest | 0.168 | 0.081-0.319 | 0.42 | 0.006 | 0.14 | 0.075-0.246 | 0.35 | 0.006 | 0.092 | 0.045-0.181 | 0.23 | 0.006 | |
| Herbaceous | 0.353 | 0.133-0.661 | 31.5 | 0.471 | 0.305 | 0.120-0.585 | 27.2 | 0.475 | 0.215 | 0.075-0.483 | 19.21 | 0.481 | |
| Mixed forest | 0.489 | 0.279-0.703 | 4.57 | 0.068 | 0.435 | 0.281-0.602 | 4.06 | 0.071 | 0.325 | 0.178-0.517 | 3.03 | 0.076 | |
| Nonvegetated | 0.168 | 0.081-0.319 | 0.97 | 0.014 | 0.14 | 0.075-0.246 | 0.8 | 0.014 | 0.092 | 0.045-0.181 | 0.53 | 0.013 | |
| Open forest | 0.425 | 0.261-0.608 | 9.03 | 0.135 | 0.373 | 0.261-0.500 | 7.92 | 0.138 | 0.271 | 0.162-0.417 | 5.76 | 0.144 | |
| Regenerating forest | 0.275 | 0.142-0.467 | 2.36 | 0.035 | 0.234 | 0.133-0.377 | 2.01 | 0.035 | 0.16 | 0.078-0.302 | 1.38 | 0.034 | |
| Shrub | 0.317 | 0.137-0.574 | 4.48 | 0.067 | 0.271 | 0.124-0.496 | 3.84 | 0.067 | 0.189 | 0.074-0.403 | 2.68 | 0.067 | |
| Wet forest | 0.08 | 0.024-0.272 | 5.68 | 0.085 | 0.071 | 0.020-0.219 | 4.64 | 0.081 | 0.046 | 0.012-0.155 | 2.98 | 0.075 | |
| Insects | Alpine-subalpine | 0.118 | 0.052-0.245 | 4.35 | 0.109 | 0.145 | 0.076-0.257 | 5.34 | 0.112 | 0.089 | 0.041-0.182 | 3.28 | 0.105 |
| Anthropogenic | 0.155 | 0.075-0.294 | 5.15 | 0.129 | 0.189 | 0.107-0.311 | 6.25 | 0.132 | 0.118 | 0.059-0.223 | 3.92 | 0.125 | |
| Closed forest | 0.077 | 0.037-0.153 | 0.19 | 0.005 | 0.096 | 0.054-0.164 | 0.24 | 0.005 | 0.058 | 0.029-0.111 | 0.14 | 0.005 | |
| Herbaceous | 0 | — | 0 | 0 | — | 0 | 0 | — | 0 | ||||
| Mixed forest | 0.288 | 0.150-0.481 | 2.68 | 0.067 | 0.338 | 0.214-0.489 | 3.15 | 0.066 | 0.228 | 0.121-0.386 | 2.12 | 0.068 | |
| Nonvegetated | 0 | — | 0 | 0 | — | 0 | 0 | — | 0 | ||||
| Open forest | 0.243 | 0.133-0.402 | 5.16 | 0.129 | 0.289 | 0.198-0.400 | 6.13 | 0.129 | 0.19 | 0.113-0.301 | 4.03 | 0.129 | |
| Regenerating forest | 0.55 | 0.393-0.697 | 4.72 | 0.118 | 0.607 | 0.508-0.697 | 5.21 | 0.11 | 0.471 | 0.346-0.600 | 4.04 | 0.129 | |
| Shrub | 0.244 | 0.090-0.513 | 3.46 | 0.087 | 0.29 | 0.119-0.552 | 4.11 | 0.087 | 0.191 | 0.067-0.436 | 2.71 | 0.086 | |
| Wet forest | 0.218 | 0.113-0.380 | 14.25 | 0.357 | 0.261 | 0.153-0.408 | 17.03 | 0.359 | 0.169 | 0.087-0.303 | 11.05 | 0.353 | |
Frugivory started earlier and lasted longer in the foothills than in the mountains. In the foothills, frugivory occurred between late July and early October compared with an early August to late September period for the mountains (Table 3). In total, 97 of 391 potential locations were known to have been frugivory sites. Temporally, frugivory was highest during diurnal (26.2%) and crepuscular (23.6%; Table 4) periods.
However, only diurnal and nocturnal (15.7%) periods were significantly different from one another (Table 4). Frugivory occurred across a variety of habitat types, but was most prevalent within mixed and open forests (Table 6). However, based on habitat selection ratios, herbaceous habitats were selected (Table 6).
Duration of seasonal ungulate kills was dependent on region (Table 3). Ungulate use occurred later and was of shorter duration in the mountains than in the foothills. In the mountains, ungulate feeding occurred between late May and early June, whereas in the foothills it started in late April and continued until late July (Table 3). Based on these seasonal delineations, a total of 620 locations were considered potential kill locations and of these, kills were located at 54 sites. No temporal trend in time of day was evident for ungulate carcass use (Table 4). Ungulate feeding sites were more likely to be located in closed forests, open forests, wet forests, and nonvegetated areas (Table 7). Selection ratios suggested that female grizzly bears selected wet forest sites most for ungulate feeding (Table 7).
Probability (Prob.) of an ungulate kill site (90% confidence intervals [CI ]), selection ratios (ŵi) of estimated probability of an ungulate kill site to proportion available, and standardized selection ratios (Bi) of kill sites summing to 1 for all times of day (crepuscular, diurnal, and nocturnal) combined and by habitat type in west-central Alberta, Canada. Probabilities are interpreted as the likelihood of a kill site in that habitat compared to all other activities or undefined activity sites. Anthropogenic habitats are those areas altered by humans (e.g., roads, pipelines, etc.).
| Habitat type | Prob. | 90% CI | ŵi | Bi |
|---|---|---|---|---|
| Alpine-subalpine | 0.021 | 0.005–0.077 | 0.77 | 0.043 |
| Anthropogenic | 0.015 | 0.003–0.080 | 0.51 | 0.029 |
| Closed forest | 0.113 | 0.064–0.191 | 0.28 | 0.016 |
| Herbaceous | 0.04 | 0.007–0.195 | 3.59 | 0.203 |
| Mixed forest | 0.094 | 0.028–0.275 | 0.88 | 0.05 |
| Nonvegetated | 0.151 | 0.027–0.536 | 0.87 | 0.049 |
| Open forest | 0.128 | 0.069–0.228 | 2.72 | 0.154 |
| Regenerating forest | 0.043 | 0.018–0.099 | 0.37 | 0.021 |
| Shrub | 0.074 | 0.013–0.326 | 1.05 | 0.06 |
| Wet forest | 0.101 | 0.044–0.217 | 6.61 | 0.375 |
Discussion
Throughout their range in North America, grizzly bears rely on a variety of plant and animal species to satisfy their nutritional requirements. In pur study, we documented the diet of grizzly bears in west-central Alberta over 3 years. With the previous lack of information relevant to foothills, our study has made an important contribution to the understanding of grizzly bear ecology in the region. Similar to other foraging studies on bears in the Rocky Mountains (Craighead et al. 1995; Hamer and Herrero 1987; Hamer et al. 1991; Mattson et al. 1991; McLellan and Hovey 1995; Mealey 1980), individuals in west-central Alberta exhibited seasonal shifts of diet in response to changes in food availability and plant phenology (Hamer and Herrero 1987). Broadly speaking, the diet of bears in our study area was similar to that of some continental divide populations (Hamer and Herrero 1987; Hamer et al. 1991; McLellan and Hovey 1995). Bears 1st dug for roots after den emergence followed by hunting of ungulates in late May to early June. As the growth of green vegetation emerges in late spring (early to mid-June in west-central Alberta), graminoids, and forbs began to dominate diets. With the onset of fruit ripening in late summer, bears shifted immediately to frugivory. Finally, as fruit productivity and other edible species declined in availability nearing the onset of winter, bears returned to digging roots. Despite these similarities, there are some notable differences in diet when compared to other interior populations. In Banff National Park (hereafter Banff—Hamer and Herrero 1987) and Waterton Lakes National Park (Hamer et al. 1991) in Alberta, ungulate matter was not consumed to the same extent as bears in our study. Further south, whitebark pine (Pinus albicaulis) seeds became an important autumn food source, with berries more rarely consumed in some populations such as those in Yellowstone National Park in Wyoming, Montana, and Idaho (Mattson et al. 1991). Roots also were a very small part of spring diets in Yellowstone; bears tended to scavenge on ungulate remains instead (Mattson et al. 1991).
The trends in the use of general foods from our study were most comparable to those of Hamer and Herrero (1987), an ecologically similar area 200 km south in Banff. In both areas, sweet vetch roots dominated early-spring and late-autumn diets, providing a dependable pre-and post-growing-season food. In late spring, bears in both areas foraged on grasses, sedges (Carex), horsetails, and a numerous forbs. In Banff, cow parsnip and mountain sorrel (Oxyria digyna) were common summer forage items (Hamer and Herrero 1987). We found cow parsnip to be important, but not mountain sorrel, which was limited in availability. Bears instead fed on clover, peavine, dandelions, and alfalfa, species associated with recently disturbed sites such as clear-cuts, roadsides, abandoned gas and oil well pads, and reclaimed slopes of open-pit coal mines (Haeussler et al. 1999; Nielsen et al. 2004b; Roberts and Zhu 2002). The use of such disturbance-evolved forbs in our area was indicative of the large amount of human activity, consistent with observations made by McLellan and Hovey (1995) in the Flathead River drainage in southeastern British Columbia, Canada, a region of intensive resource development that included timber harvesting and coal extraction. The importance of ants in the diet of bears during summer months was comparable between Banff and west-central Alberta. In Banff, ants occurred in 41% of the feces analyzed (Hamer and Herrero 1987), whereas ants were found in 23% of the feces analyzed in west-central Alberta. The use of ants in the Banff area tended to be associated with xeric sites having coarse woody debris and although ant use in our study area also could be found in the more xeric regenerating stands associated with coarse woody debris, grizzly bears tended to select wet forest habitats for ant feeding. In contrast, ants occurred in only 6% of feces in Waterton Lakes National Park in southwestern Alberta (Hamer et al. 1991). During late summer and early fall, soopolallie dominated diets of grizzly bears with secondary use of Vaccinium fruit, similar to observations made by Hamer and Herrero (1987) in Banff.
Despite several similarities between Banff and west-central Alberta, a difference in the use of animal matter was apparent. In our study area, moose, particularly neonates, were a dominant food item in feces from late May through late June. Deer also comprised a large proportion of the diet, whereas elk appeared to be a relatively unimportant prey species. In contrast, in Banff, elk was the dominant prey species, although the exact contribution that elk made to the diet of bears in Banff was unclear (Hamer and Herrero 1987). Differences in ungulate use between the areas likely reflect differences in availability of ungulates. Elk were more common to Banff, whereas moose and deer were more common to the boreal foothills of west-central Alberta. The presence of ungulates in the diets of bears in west-central Alberta also showed spatial variation. The diet of bears in the foothills had nearly 2.5 times the amount of animal matter that is in diets of bears in the mountains. We suspect this reflects differences in ungulate availability. Ungulate populations were noticeably larger in the foothills, due perhaps to clear-cut disturbances and bog networks. In contrast, bears in the mountains were exposed to expansive alpine meadows giving rise to use of ground squirrels, marmots, and sweet vetch roots.
Finally, phenology differences between foothills and mountains were important determinants of seasonal patterns of food use. Cooler, high-elevation sites were typified by a delayed green-up in the spring and earlier frosts in the fall.
To our knowledge, we are the 1st to quantify grizzly bear activity by time of day and habitat in the Central Rockies. We found that despite high levels of human activity, especially in the foothills, bears were most active during diurnal and crepuscular periods, with bedding occurring most frequently at night. This supports the generally held belief that bears are primarily diurnal throughout their range in North America (Craighead et al. 1995; Gilbert and Lanner 1995). However, it contradicts studies that have shown bears to be more nocturnal in areas where human activity is high (Beckman and Berger 2003; Gibeau et al. 2002). This suggests that the level of human activity in the foothills and mountains of west-central Alberta is not high enough to disrupt the typical daylight activity pattern of bears.
Overall, no single habitat characterized all grizzly bear activities but rather bears used different habitats for specific activities. Root digging was more likely to occur in herbaceous and alpine habitats, insect feeding was concentrated in regenerating forests and bogs, whereas frugivory tended to occur in mixed and open forests. Furthermore, bears were more likely to bed in forested communities, whereas selection ratios indicated that bears fed on ungulates primarily in wet forests. These findings reveal the complexity of grizzly bear habitat selection, suggesting that activity and time of day be considered in analyses of habitat use. Examination of habitat selection based on bear behavior allowed for mechanistic explanations of grizzly bear habitat selection and assessments of the seasonal importance of different habitats.
Managing habitats and foods for grizzly bears is complicated given the diverse nature of food resources (as well as annual and seasonal variations) and habitats used by bears. We therefore suggest that grizzly bear habitat models consider more directly the spatial and temporal nature of food resources and activity patterns. Such information offers insight into why and when bears use different resources, which is a considerable advance over merely reporting a bear's presence. We further suggest that, when possible, food models be developed and combined into composite seasonal habitat maps that score the importance of individual seasonal food items (e.g., Nielsen et al. 2003), habitats, and activities. Maps derived from such models are likely to provide further insight into the needs of bears.
Acknowledgments
We thank J. Bell, M. Cattet, N. Caulkett, M. Dupuis, B. Goski, J. Lee, G. MacHutchon, C. Mamo, J. Saunders, M. Urquhart, and a number of Alberta Conservation Officers and Jasper National Park wardens who provided expertise and support during bear capture. We also are grateful to vegetation crew members C. Aries, E. Bainbridge, A. Iglesias, T. Larsen, M. McLellan, E. Moore, M. Piper, and S. Robertson and GIS staff member J. Duval. A special thank you goes to R. Riddell for his assistance with the scat analysis. A full list of funding partners for this project can be found at http://www.fmf.ca/partners.html.
Literature Cited
Author notes
Associate Editor was Floyd W. Weckerly.
