


Abstract
The mosquitoes Aedes (Stegomyia) aegypti (L.)(Diptera:Culicidae) and Ae. (Stegomyia) albopictus (Skuse) (Diptera:Culicidae) transmit dengue, chikungunya, and Zika viruses and represent a growing public health threat in parts of the United States where they are established. To complement existing mosquito presence records based on discontinuous, non-systematic surveillance efforts, we developed county-scale environmental suitability maps for both species using maximum entropy modeling to fit climatic variables to county presence records from 1960–2016 in the contiguous United States. The predictive models for Ae. aegypti and Ae. albopictus had an overall accuracy of 0.84 and 0.85, respectively. Cumulative growing degree days (GDDs) during the winter months, an indicator of overall warmth, was the most important predictive variable for both species and was positively associated with environmental suitability. The number (percentage) of counties classified as environmentally suitable, based on models with 90 or 99% sensitivity, ranged from 1,443 (46%) to 2,209 (71%) for Ae. aegypti and from 1,726 (55%) to 2,329 (75%) for Ae. albopictus. Increasing model sensitivity results in more counties classified as suitable, at least for summer survival, from which there are no mosquito records. We anticipate that Ae. aegypti and Ae. albopictus will be found more commonly in counties classified as suitable based on the lower 90% sensitivity threshold compared with the higher 99% threshold. Counties predicted suitable with 90% sensitivity should therefore be a top priority for expanded mosquito surveillance efforts while still keeping in mind that Ae. aegypti and Ae. albopictus may be introduced, via accidental transport of eggs or immatures, and potentially proliferate during the warmest part of the year anywhere within the geographic areas delineated by the 99% sensitivity model.
Aedes (Stegomyia) aegypti (L.) and Ae. (Stegomyia) albopictus (Skuse) transmit the viruses that cause yellow fever, dengue, chikungunya, and Zika (Rigau-Perez et al. 1998, Weaver and Lecuit 2015, Fauci and Morens 2016, Amraoui et al. 2016). In the Americas, yellow fever remains a persistent threat (Vasconcelos 2017), dengue has expanded in recent decades (Gubler 2002, Lambrechts et al. 2010, Bhatt et al. 2013), and chikungunya and Zika have been introduced in the past few years (Cauchemez et al. 2014, Zanluca et al. 2015, Fauci and Morens 2016). In the contiguous United States, local transmission of dengue, chikungunya, or Zika viruses has occurred recently in Florida and Texas and is a growing public health concern (Ramos et al. 2008, Radke et al. 2012, Kendrick et al. 2014, Dinh et al. 2016, McCarthy, 2016, CDC 2017).
Aedes aegypti and Ae. albopictus are found primarily in the tropics and subtropics, but occur seasonally also in mid-latitude regions (Kraemer et al. 2015a). Of the two species, Ae. albopictus is more tolerant of temperate climatic conditions and its range therefore extends further poleward than Ae. aegypti. The broad geographic ranges of Ae. aegypti and Ae. albopictus are determined in large part by temperatures allowing for development and survival (Christophers 1960, Fischer et al. 2011, Capinha et al. 2014, Khormi and Kumar 2014, Kraemer et al. 2015a, Erguler et al. 2016, Monaghan et al. 2016a) and precipitation to fill container habitats (Mogi et al. 1988, Barrera et al. 2011), though in some areas human water storage practices can diminish the need for precipitation (Beebe et al. 2009, Barrera et al. 2011). Locally, these species can often find thermally suitable microclimatic habitats which enable them to survive in what might otherwise be an unsuitable macroclimate (Hayden et al. 2010, Lima et al. 2016). Both species inhabit urban areas, and Ae. albopictus is also commonly found in peri-urban and rural environments (Gratz 2004, Eisen et al. 2014, Faraji and Unlu 2016).
Aedes aegypti is thought to have been present in the United States since at least the 1640s and seasonal reintroductions occurred as far north as New York and Philadelphia by the 1660s; this species persists across much of the southern tier of the country today (Tabachnick 1991, Patterson 1992, Eisen and Moore 2013). In contrast, Ae. albopictus was first recorded in Harris County, Texas in 1985 and became established there in the following years (Sprenger and Wuithiranyagool 1986). This mosquito subsequently proliferated throughout much of the eastern United States and continues to expand its range (Farajollahi and Nelder 2009, Kraemer et al. 2015b). Both species have recently become established in California – Ae. albopictus since 2011 and Ae. aegypti since 2013 – and are found in an increasing number of communities there (Gloria-Soria et al. 2014, Porse et al. 2015, Metzger et al. 2017). Since 1995, Ae. aegypti has been reported in 220 counties in 28 states and the District of Columbia, and Ae. albopictus in 1,368 counties in 40 states and the District of Columbia (Hahn et al. 2017). The county-based maps presented by Hahn et al. (2017) revealed extensive spatial gaps where no records for Ae. aegypti or Ae. albopictus exist but where it seems likely that intensified surveillance may reveal the mosquitoes to be present. Our objective was to predict the possible geographic ranges of these mosquitoes based on county-level presence records and climatic variables likely to be associated with county-level environmental suitability. The findings of this study can inform enhanced surveillance efforts in counties where Ae. aegypti or Ae. albopictus has not yet been recorded but where the environment appears to be favorable for establishment, or at least survival during summer months if mosquitoes are introduced.
Materials and Methods
Ae. aegypti and Ae. albopictus Data
We used a comprehensive dataset of county level Ae. aegypti and Ae. albopictus occurrence records from 1995 to 2016 published by Hahn et al. (2016), more recent records from a survey conducted in fall 2016 (Hahn et al. 2017), and historical records back to 1960 compiled from multiple sources (supp Table S1 [online only]). A full description of species data collection, presence classifications, compilation, and data management is provided by Hahn et al. (2016, 2017). In short, Ae. aegypti or Ae. albopictus was considered “present” in a county if at least one mosquito of any life stage was collected and reported during the included time period.
Based on 3,111 Federal Information Processing Standard (FIPS) codes for the contiguous United States, which represent counties or county equivalents (henceforth referred to as counties), we separately compiled county records for the presence of Ae. aegypti (291 counties) and Ae. albopictus (1,568 counties). A presence record was defined as a reported record for at least 1 year from 1960 through 2016 (supp Table S1 [online only]). A shapefile representing the centroid of each county was created and Ae. aegypti and Ae. albopictus presence information was joined with county centroids using FIPS codes (ArcGIS version 10.4, Environmental Systems Resource Institute; ESRI, Redlands, CA).
Climate Variables
Daily temperature and precipitation fields for 1980–2015 with 1 km × 1 km spatial resolution were obtained from version 3 of Daymet (Thornton et al. 1997, 2016). Daily temperature values were used to compute GDDs, a measure of the magnitude by which daily average temperatures exceed a baseline temperature of 10°C. Cumulative GDDs during December–February were then computed as a measure of total warmth during winter, and averaged for the 1980–2015 period. Next, long-term (1980–2015) monthly average temperature and precipitation variables were computed from the daily fields, and used to compute the 19 bioclimatic variables frequently used in ecological modeling studies (Nix 1986) using version 1.1 of the ‘dismo’ package in R (Hijmans et al. 2016). The Zonal Statistics tool in ArcGIS version 10.4 was used to compute county-level averages for the climate variables using all pixels with centroids in a given county. In early stages of model development, we considered including indices of enhanced vegetation and percentage of urban areas per county. However, neither provided significant improvements to model performance and therefore were not considered further.
Typically, bioclimatic variables are highly correlated. Inclusion of highly correlated variables in statistical models can lead to spurious results (Baldwin 2009, Byers et al. 2013), therefore, we kept the variables we considered most biologically relevant and excluded others that were strongly correlated with retained variables. All variables were tested for correlation in ArcGIS using the multivariate band collection statistics tool. A Pearson’s correlation matrix was generated for all pairs of variables. We excluded all highly correlated (r > 0.80) variables from analysis. Variables ultimately included in the final models were those considered to be most meaningful to the biology of Ae. aegypti and Ae. albopictus, based on a literature review of prior modeling studies of the two species (Table 1).
Predictor variables considered as candidate variables in Ae. aegypti and Ae. albopictus environmental suitability models
| Variable | Permutation importance (%) | ||
|---|---|---|---|
| Abbreviation | Ae. aegypti | Ae. albopictus | |
| Maximum temperature of warmest month | BIO5 | 5.7 | – |
| Minimum temperature of coldest month | BIO6 | – | – |
| Temperature annual range (BIO5–BIO6) | BIO7 | – | – |
| Precipitation of wettest month | BIO13 | – | – |
| Precipitation of driest month | BIO14 | – | 47.3 |
| Precipitation seasonality (coefficient of variation) | BIO15 | – | – |
| Cumulative GDDs during December–February | GDDs | 94.3 | 52.7 |
Permutation importance values are given for variables selected in the final models.
Modeling Ae. aegypti and Ae. albopictus using MaxEnt
We used a maximum entropy modeling approach (MaxEnt, 2016) to estimate the geographical distribution of Ae. aegypti and Ae. albopictus based on environmental constraints. MaxEnt, a machine learning algorithm, is designed for use with presence-only data and has been widely used for modeling species distributions and regularly outperforms similar models (Elith et al. 2011). MaxEnt has been employed to model the ranges of Ae. aegypti and Ae. albopictus for numerous regions (Medley 2010, Fischer et al. 2011, Rochlin et al. 2013, Campbell et al. 2015). MaxEnt detects non-random relationships between geocoded locations that represent where vector species are found, and raster data representing environmental, demographic or land use or other potential explanatory variables, to estimate the species’ potential occurrence in the study area (Phillips et al. 2006). Model accuracy depends on careful selection of explanatory variables and model parameters, the quality and quantity of presence records and background point selection (Phillips et al. 2009).
Due to the resolution (county) of our presence data, modifications were made within MaxEnt so that pseudo replication of counties with no records (background points) did not occur. Of the 3,111 counties in the contiguous United States, 50% have records of Ae. albopictus and only 9% have records of Ae. aegypti. We modified the basic and advanced setting in MaxEnt to exclude presence counties from being added to available background points and to set the number of background points used for each species. For every county where Ae. aegypti was recorded as present (n = 291), two counties lacking species records were randomly selected as background (n = 582) from the remaining 2,280 counties. Likewise, for Ae. albopictus models, we limited the number of counties that could be chosen as background counties to the 1,543 counties with no presence records, roughly a 1:1 ratio of presence (n = 1568) to background observations.
Initially, a full model including all variables with correlation coefficients <0.80 and all default MaxEnt settings, except background points as described above, was created for each species. Based on results given by full models, we created reduced models for each species by removing variables that had a permutation importance, i.e. the percent reduction in model fit when each variable is randomly permuted, of <5%. We also changed default settings as described below. Reduced models with pertinent variables identified from full models were prepared for each species. Ten replicate models were run for each species and 10-fold cross validation was used to ensure that all data points were used in model building and evaluation. The number of iterations was set to 1,500 to allow adequate time for model convergence. Feature settings were changed from the default to include only hinge features, which generally improve model performance and smooth the fit of the data (Phillips and Dudik 2008; Elith et al. 2010, 2011).
To determine how each variable impacts the predicted presence of each species, we considered three measures of variable contribution. Permutation importance was used to determine the most influential variables in each model, while jackknife plots and response curves were used to determine how the model changes with the inclusion, exclusion, and permutation of each variable, i.e. response curves. MaxEnt provides permutation importance to determine the importance of input variables in the model (Phillips 2006). This measures the contribution for each variable by randomly permuting the values of that variable among the training points (both presence and background) and measuring the resulting decrease in the area under the receiver operating characteristic curve (ROC). It is essentially a measure of the impact of a variable on accuracy. Response curves show how the logistic prediction changes as each variable is changed while keeping all other variables at their average sample value. Jackknife plots are used to determine which variables are contributing unique information not represented by other variables.
Finally, to assess overall model fit, or overall accuracy, we used the area under the curve (AUC) of the ROC curve. The ROC curve indicates the true positive rate (sensitivity) versus the false positive rate (1−specificity) across the spectrum of model probabilities when each is used as a threshold to predict a binary outcome (in this case predicted suitable or not suitable) (Liu et al. 2005). The AUC is often used as a single threshold-independent measure of model accuracy and to compare performance between multiple models. The AUC can range between perfect (AUC = 1.0) and no better than random (AUC = 0.50).
To visualize species distribution models, we dichotomized the continuous probability values generated by the models based on three different cut-off probabilities that represented 90, 95, and 99% sensitivity. County-level results were mapped in ArcGIS 10.4.
Results
The models predict widespread environmental suitability for Ae. aegypti in both the eastern and western United States (Fig. 1a), with the highest degree of suitability across the south and lower suitability along the northern margins of the range. Counties classified as suitable for Ae. albopictus were primarily in the eastern part of the country, though areas of suitability were indicated also along the west coast. The lower predicted suitability for Ae. albopictus in western counties may be partly due to the outsized influence of presence observations from eastern counties used for model fitting (Fig. 1b). The number (percentage) of counties classified as environmentally suitable, based on models with 90 or 99% sensitivity, ranged from 1,443 (46%) to 2,209 (71%) for Ae. aegypti and from 1,726 (55%) to 2,329 (75%) for Ae. albopictus.
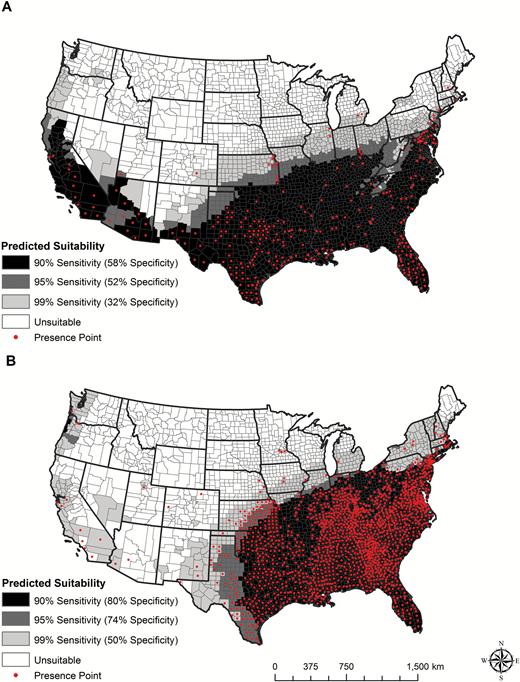
Modeled suitability maps for (a) Ae. aegypti and (b) Ae. albopictus. The red points show the presence records from 1960 to 2016 used to build the models. Darker shading indicates a higher probability of suitability, as described in the text. Cut-off probabilities for Ae. aegypti are 0.36, 0.22, and 0.057 and for Ae. albopictus are 0.33, 0.25, and 0.03, for the 90, 95, and 99% sensitivity thresholds, respectively.
Based on models with 99% sensitivity, a total of 2,146 counties (69%) were predicted to be suitable for both species, and 2,392 counties (77%) were predicted to be suitable for at least one species. Some counties, primarily in the Northeast, upper Midwest and Pacific Northwest were predicted to be suitable for Ae. albopictus but not Ae. aegypti. Conversely, several counties, primarily in the Southwest and California were predicted to be suitable for Ae. aegypti but not Ae. albopictus. In total, 719 counties (23%), mainly in the upper Midwest, northern Great Plains and Mountain West, were predicted as not suitable for either species.
The predictive model for Ae. aegypti had an AUC of 0.84. Among the variables considered, the best model for Ae. aegypti was based on two variables: winter (December–February) cumulative GDDs >10°C and maximum temperature during the warmest month (Bio5). Winter cumulative GDDs >10°C was the more important variable (permutation importance = 94.3%) but the maximum temperature during the warmest month also contributed significantly (permutation importance = 5.7%). The response curve indicated that any county in which winter GDDs were more than zero had moderate–to-high suitability (Fig. 2a). In a practical sense, this result can be interpreted as meaning that a county is predicted to be suitable for Ae. aegypti if at least 1 d, on average, during the 90-d December–February period has an average temperature exceeding 10°C. Suitability increases between 0 and 700 GDD, and then levels off for higher values, which are not common (areas with 700 or more GDDs in winter are mainly in south Texas and Florida). Suitability increased with increasing maximum temperatures from 15 to 36°C during the warmest month (i.e., mid-summer) but decreased as temperatures increased thereafter (Fig. 2b).
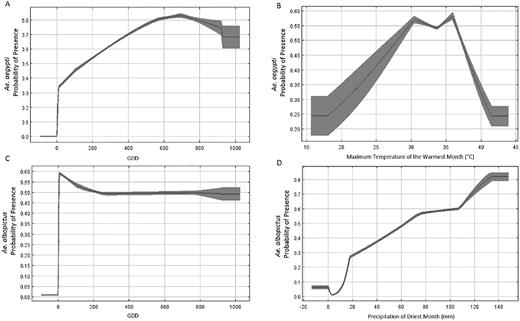
Model response curves for Ae. aegypti suitability in relation to (a) winter GDDs and (b) maximum temperature during the warmest month; and for Ae. albopictus suitability in relation to (c) winter GDDs and (d) precipitation during the driest month. Each curve shows the mean response of the ten replicate MaxEnt runs (black line) and the mean ± 1 standard deviation (dark shading) and represents how the logistic probability changes as each variable is changed while keeping all other variables at their average sample value.
The AUC for the Ae. albopictus model was 0.85. Two predictors contributed to the distribution of Ae. albopictus, winter (December–February) cumulative GDDs >10°C (52.7%) and precipitation in the driest month (BIO14; 47.3%). The response curve for winter GDDs for Ae. albopictus was similar to the response curve described above for Ae. aegypti: any county in which average winter GDDs were more than zero had high suitability (probability > 0.50) (Fig. 2c). Suitability increased nearly linearly as average precipitation in the driest month increased beyond 10 mm (Fig. 2d).
Discussion
Using county-level presence records for Ae. aegypti and Ae. albopictus from 1960 to 2016, we developed environmental suitability maps for these two species across the contiguous United States as a function of climatic variables. Cumulative GDDs during the winter months, an indicator of overall warmth, were the most important predictive variable for both species and was positively associated with suitability. For Ae. aegypti, summer temperatures also had an overall positive influence on the likelihood of a county being classified as suitable, but contributed substantially less to the model compared with winter GDDs. For Ae. albopictus, total rainfall during the driest month was also a significant predictor of suitability with a permutation importance only ~5% less than GDDs. The fact that GDDs are the most important predictor in both models is a noteworthy result, because the response curves for GDDs indicate that the probability of presence for both species strongly increases if at least 1 d, on average, during the 90-d December–February period has an average temperature exceeding 10°C. Based on our models, we estimate that up to 77% of counties in the contiguous United States are suitable under current climate conditions for at least one of these medically important vector species to survive and reproduce at least during the warm part of the year.
A recent survey of mosquito records from 1995 through 2016 revealed that Ae. aegypti and Ae. albopictus have been reported from 220 and 1,368 counties, respectively (Hahn et al. 2017). However, recognizing that vector surveillance was not conducted in all counties or with equal intensity across counties where surveillance occurred, and that surveillance methods often differ among counties, the reported records likely underestimate the actual number of counties where either species currently exists (Hahn et al. 2017). Indeed, historical presence records dating back to 1960 for Ae. aegypti and the introduction event in 1985 for Ae. albopictus (Fig. 1 and Table S1 [online only]) show a broader geographic distribution than what is revealed by more contemporary collection records from 1995 onwards (Hahn et al. 2017). Although this change for Ae. aegypti may have resulted in large part from improved sanitation and decreased residential water storage over the last 50 years, the older records underscore the need for vigilance as they clearly indicate climatic suitability for the mosquito. Competition with other, more recently introduced mosquito species that exploit containers as larval development sites, including satyrization from Ae. albopictus (Bargielowski et al. 2013, 2015), could also impact local populations of Ae. aegypti (O’Meara et al. 1995, Juliano et al. 2004, Lounibos et al. 2010) and thus may be a confounder in climate-only based models.
The maps presented here identify counties that may be suitable for either species but where recent collection records are lacking. Specifically, our models indicate that, depending on the threshold used to classify counties as suitable (99 or 90% sensitivity), from 1995 through 2016 Ae. aegypti was reported from between 10 and 15% of counties classified as suitable for Ae. aegypti, whereas Ae. albopictus was reported between 59 and 79% of counties classified as suitable for Ae. albopictus. Thus, intensified surveillance efforts for these species launched in response to the ongoing Zika outbreak are likely to produce many more county records. As illustrated in Fig. 1, increasing model sensitivity results in more counties classified as suitable from which there are no mosquito records. We anticipate that Ae. aegypti and Ae. albopictus will be found more commonly in counties classified as suitable based on the lower 90% sensitivity threshold compared with the higher 99% threshold. Counties predicted suitable with 90% sensitivity should therefore be a top priority for expanded mosquito surveillance efforts. However, because eggs or immatures of Ae. aegypti and Ae. albopictus can be transported over long distances in tires and other sundry water-holding containers it also should be noted that they can suddenly appear and most likely also proliferate during the warmest part of the year anywhere within the geographic areas delineated by the 99% sensitivity model. Based on these considerations we chose to present multiple models with sensitivities ranging from 90 to 99%. Comparing the reported species distributions from Hahn et al. (2017) to our suitability models, records of Ae. aegypti are particularly sparse in the eastern United States north of Florida (Fig. 3a). By comparison, counties predicted to be suitable for Ae. albopictus, but where recent records are lacking primarily in the Great Lakes region, the Northeast, parts of the Midwest, and the central and southern Great Plains (Fig. 3b).
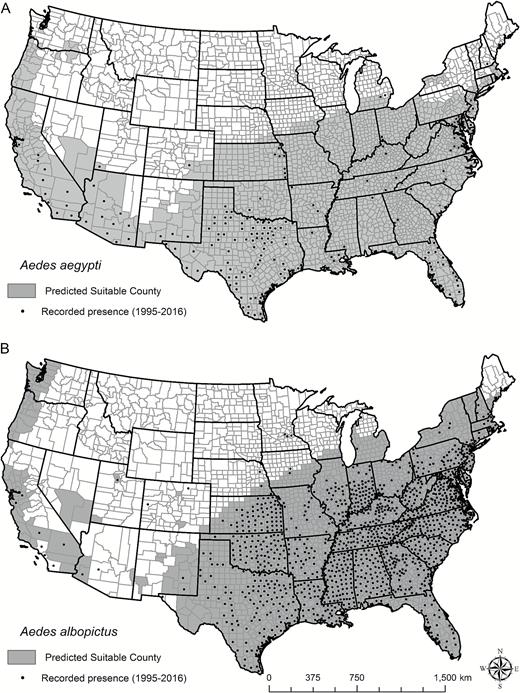
Environmental suitability models based on 99% sensitivity and presence records from 1995 to 2016 (Hahn et al. 2017) for (a) Ae. aegypti and (b) Ae. albopictus.
Despite a small number of presence records, our Ae. aegypti model obtained an AUC of 0.84. Our finding that winter GDDs >10°C (December–February) are predicted to largely define the range for this mosquito in the United States is consistent with the global range of Ae. aegypti being bounded by the winter 10°C isocline (Christophers 1960). More specifically, the model’s response curve indicated that suitability increased with increasing GDDs up to ~700 GDDs. This finding is consistent with previous studies based on observations showing that Ae. aegypti presence/suitability is positively associated with average cold-season temperatures in North America (Lozano-Fuentes et al. 2012, Eisen et al. 2014). For example, Eisen et al. (2014) showed that cities with year-round suitability for Ae. aegypti have average temperatures during the coldest month that are >20oC, such as Key West, Florida. In addition to GDDs, the finding that environmental suitability for Ae. aegypti is also positively associated with temperatures during the warmest month is also consistent with the observation-based findings of Eisen et al. (2014). The shape of the model’s response curve, showing highest suitability between 30 and 36°C, is likely due to the combination of optimal conditions for immature development – development rates for larvae and pupae increase up to about 33–36°C but decrease at higher water temperatures (Focks et al. 1993, Eisen et al. 2014) – and survival rates at all life stages, which typically peak between 20 and 30oC but can still be high at temperatures >30oC (Focks et al. 1993, Brady et al. 2013, Eisen et al. 2014).
Our prediction map for suitability of Ae. aegypti is generally consistent with other recent prediction maps (Capinha et al. 2014, Khormi and Kumar 2014, Campbell et al. 2015, Kraemer et al. 2015a, Monaghan et al. 2016a, b). Overall, our model predicted more extensive suitability in the western United States compared with these previous efforts, a result that may be related to the inclusion of very recent records following the introduction and spread of the mosquito in California. Although Ae. aegypti occurs most commonly in high-density urban settings, we chose not to employ human population data as a model predictor because even rural counties typically have population centers able to support Ae. aegypti if the climate is suitable.
Our model indicates higher suitability for Ae. albopictus in much of the eastern tier of the United States compared with the west, which is consistent with the presence records (Fig. 1b) and other published studies (Benedict et al. 2007, Medley 2010, Fischer et al. 2011, Ogden et al. 2014, Campbell et al. 2015, Kraemer et al. 2015a, Proestos et al. 2015). Suitability was based almost equally on winter GDDs and precipitation during the driest month of the year. Although availability of water is required for both species, the strong eastern bias in presence points for Ae. albopictus compared with Ae. aegypti may help to explain why precipitation was significant in predicting the suitable range for the former, but not the latter species.
Studies report that Ae. albopictus can survive in temperatures ranging from –5 to 40.6°C (Gao et al. 1984, Smith et al. 1988). We excluded minimum temperature of the coldest month (BIO6) and mean temperature of the coldest quarter (BIO11) because both variables are strongly correlated with winter GDDs (correlation coefficients >0.7 and 0.8, respectively). Our model indicates that winter GDDs are associated with the presence of Ae. albopictus, a result that is consistent with previous studies (Hawley 1988, Brady et al. 2014). Our models indicate that the probability of presence for Ae. albopictus is greater than for Ae. aegypti for “colder” counties with winter GDDs between 0 and 175 (Fig. 2c vs Fig. 2a). This may be related to the fact that Ae. albopictus eggs have the ability to diapause (Hawley 1988), whereas Ae. aegypti eggs do not (Christophers 1960); diapause may enhance survival in areas with cooler winters (Thomas et al. 2012). Our model also identified precipitation in the driest month as another key limiting factor for suitability of Ae. albopictus, a result that is supported by others (Alto and Juliano 2001, Rochlin et al. 2013, Cunze et al. 2016). In the absence of human-mediated water sources, precipitation in dry seasons is necessary for egg deposition and increases the availability of suitable breeding habitats (Medlock et al. 2015). A greater reliance of Ae. albopictus, as compared with Ae. aegypti, on water sources filled exclusively by precipitation rather than in part by human action (Faraji and Unlu 2016) may partially explain why it is not widespread in the largely arid and semi-arid western United States. Additionally, humid air masses are generally associated with precipitation (e.g., Higgins et al. 1997), and thus dry-season rainfall may be a proxy of the lower limits of humidity which largely impact the egg and adults stages of Ae. albopictus (Waldock et al. 2013).
A limitation of both models is that they are trained using macroclimatic (county-level) data. Previous studies indicate that Aedes (Stegomyia) mosquitoes have the ability to inhabit suitable microclimates when macroclimatic conditions may be otherwise unsuitable (Hayden et al. 2010, Lima et al. 2016). This could apply either to cooler and moister microhabitats in very hot and dry areas in the southwestern United States or especially warm habitats, such as urban heat islands, in more northern parts of the country. This characteristic suggests that our models may underestimate suitable ‘pockets’ for Aedes (Stegomyia) presence within counties deemed unsuitable by our models; this effect may be particularly plausible near the geographic margins of suitability where macroclimatic conditions are just beyond the suitable range.
An additional limitation is that presence records used to inform our models did not differentiate between introduced or transient populations and established populations because no such information is available across the United States. Our model was not overly sensitive to geographic outliers, but nonetheless, areas on the margins of where the mosquitoes can survive year-round without repeated introductions cannot be separated from those in which the climate was classified as suitable for year-round survival. Despite these limitations, the map is useful for highlighting areas that are climatically suitable at least for summer survival of mosquitoes (Monaghan et al. 2016), if introduced, and highlight areas where additional surveillance may be indicated, particularly in high-risk settings for introductions such as tire piles (Yee 2008).
We caution that our models provide information on where mosquitoes could survive and reproduce, but they do not provide estimates of mosquito abundance within suitable counties. Moreover, they should not be interpreted as predictive of risk for human exposure to primarily human-borne chikungunya, dengue and Zika viruses, as this requires the establishment of local human-mosquito transmission cycles and other factors in addition to the simple presence of a mosquito vector in unknown numbers. Nonetheless, our predictive maps of climate suitability may aid in prioritizing mosquito surveillance to areas where Ae. aegypti or Ae. albopictus have not been reported, but where climatic conditions are suitable for establishment. Counties predicted suitable with 90% sensitivity should be a top priority for Aedes (Stegomyia) vector surveillance, as they are more likely than counties classified as suitable at 99% sensitivity to yield mosquitoes. If human mediated water sources are available anywhere in the Ae. aegypti range, it is possible to also encounter Ae. albopictus because winter temperatures are high enough to support mosquito populations and the precipitation deficit may be overcome by alternative water sources. Finally, as additional surveillance data become available, these models should be refined to improve accuracy of predictions.
Disclaimer: The findings and conclusions in this report are those of the authors and do not necessarily represent the official position of the Centers for Disease Control and Prevention (CDC).
Acknowledgments
We thank the state and local health departments, mosquito control agencies, and universities that submitted records to the U.S. Stegomyia survey. This work was funded by the Climate and Health Program of the National Center for Environmental Health, U.S. Centers for Disease Control and Prevention. The National Science Foundation sponsors the National Center for Atmospheric Research. The authors declared no conflict of interest.
Supplementary Data
Supplementary data are available at Journal of Medical Entomology online.
References Cited
Author notes
Both authors contributed equally.
