


Abstract
In a previous Child Health and Development Studies report, p, p’-DDT was associated with a fivefold increased risk of premenopausal (before age 50 years) breast cancer for women first exposed before puberty. Here we extend our observation to breast cancer diagnosed during early postmenopause (ages 50–54 years) to determine whether age at diagnosis modifies the interaction of DDT with age at exposure.
We conducted a second prospective, nested case-control study in the Child Health and Development Studies (153 incident breast cancer cases diagnosed at ages 50–54 years and 432 controls matched to cases on birth year). These were analyzed separately and pooled with our previous study (129 breast cancer cases diagnosed at ages 31–49 years and 129 controls matched on birth year). Blood samples were obtained during pregnancy (median age, 26 years), 1–3 days after delivery from 1959 to 1967 in Oakland, California. Serum was assayed for p, p’-DDT, o, p’-DDT, and p, p’-DDE. Odds ratios (ORs) below are given for doubling of serum p, p’-DDT. All statistical tests were two-sided.
For early postmenopausal breast cancer, p, p’-DDT was associated with risk for all women (ORDDT 50–54 = 1.99, 95% CI = 1.48 to 2.67). This association was accounted for by women first exposed to DDT after infancy (ORDDT 50–54 for first exposure after infancy = 2.83, 95% CI = 1.96 to 4.10 vs ORDDT 50–54 for first exposure during infancy = 0.56, 95% CI = 0.26 to 1.19; Pinteraction DDT x age at first exposure = .01). In contrast, for premenopausal breast cancer, p, p’-DDT was associated with risk among women first exposed during infancy through puberty, but not after (ORDDT<50 for first exposure during infancy = 3.70, 95% CI = 1.22 to 11.26, Pinteraction DDT x age at first exposure x age at diagnosis = .03).
p, p’-DDT was associated with breast cancer through age 54 years. Risk depended on timing of first exposure and diagnosis age, suggesting susceptibility windows and an induction period beginning in early life. DDT appears to be an endocrine disruptor with responsive breast targets from in utero to menopause.
Prior findings in the Child Health and Development Studies (CHDS) are consistent with experimental evidence showing that timing of environmental exposures during susceptible windows including in utero, childhood, puberty, and pregnancy cause varying dysregulation of breast/mammary gland development that can result in cancer later in life (1–4). We previously observed a statistically significant 2.8-fold increased risk of maternal breast cancer before age 50 years associated with high p, p’-DDT during pregnancy in a prospective case-control study of 129 cases and 129 controls, matched on year of birth (5). Moreover, we also observed that the p, p’-DDT-breast cancer association was substantially stronger (>fivefold) in women exposed before puberty (Pinteraction= .02), with the strongest association observed for exposure in utero or infancy (5). In a subsequent study of CHDS daughters, we observed that o, p’-DDT exposure in utero also increased daughter’s breast cancer before age 50 years (P = .004) (6). In contrast, most prior epidemiological studies have been based on exposures measured in mid-life blood samples obtained after DDT use was banned and did not show an association between DDT and breast cancer (7). This difference in when the exposure is measured in human studies likely contributes to less accurate estimation of exposure to the active insecticide, p, p’-DDT. Findings in other studies may also differ due to measurement outside of the window when breast tissue is rapidly changing (5,8).
Variation of risk by outcome windows has also been recognized for endocrine disruption (9). Perimenopause and menopause may be particularly relevant to assessing breast tissue changes and mammary carcinogenesis because this is a period when the breast tissue is changing in structure and function (10–12). Consistent with this concept, we have observed that both timing of exposure and timing of outcome affect risk relationships in the CHDS cohort for other outcomes, including cardiovascular disease and ovarian cancer (13–15).
Our prior study of maternal breast cancer (5) considered the contribution of exposure windows but also tightly controlled the outcome window. Cases were diagnosed prior to age 50 years. In the present study, we extend our observation to cases diagnosed between ages 50 and 54 years, a period when most women have recently completed the menopause transition.
Methods
Study Population
The CHDS recruited more than 98% of women receiving obstetric care from the Kaiser Foundation Health Plan in the San Francisco East Bay area from 1959 to 1967. In all, 15 528 women were enrolled (16). The CHDS is racially and socioeconomically diverse with access to health care. Blood samples were collected at each trimester and in early postpartum, usually within 3 days of delivery. Serum has been archived at −20°C. Demographics and behavior were collected from in-person interviews at enrollment, generally early in the first trimester. Medical records were abstracted beginning 6 months prior to pregnancy and through labor and delivery. The institutional review board of the Public Health Institute approved the study protocol for this research, and participants gave oral informed consent as was customary in the 1960s.
Cohort Surveillance
Surveillance of CHDS participants has continued for 6 decades by annual linkage to the California Department of Motor Vehicles to identify the population at risk for cancer; the California Department of Vital Statistics, for identifying deaths and cause (13,15,17); and the California Cancer Registry (CCR), for identifying cancer diagnoses (14,18–22). CHDS mothers and their families are regularly matched to these sources using an accumulated name and address history. This protects against establishing false matches and failing to identify true matches. Surveillance efforts routinely identify more than 90% of CHDS mothers.
Breast cancer cases are identified by linkage to the CCR including year and age of diagnosis. California health care facilities are required by law to report cancer diagnoses to the CCR (23). The CCR has established that its cancer coverage is more than 99% complete after a lag time of about 2 years (24). Life table analyses estimating expected numbers of breast (Mongraw-Chaffin, ML and Cirillo,PM, unpublished data) and testicular cancer cases (19) in the CHDS show close comparability with expected number of cases based on CCR data for California. Linkage to the CCR through 2010 identified 153 cases of incident invasive or in situ breast cancer diagnosed from 1970 to 2010 in CHDS mothers ages 50–54 years.
Serum Assays
We measured organochlorine compounds in serum samples collected during 1959–1967 from pregnant CHDS mothers who were a median age of 26 years. Samples were stored at −20°C. Serum from the postpartum blood draw, within 1–3 days of delivery, was preferentially selected for assays. Nearly 94% of samples were from a postpartum draw (88% of cases and 96% of controls). Third-trimester serum was used for the remainder, with the exception of six second-trimester samples (five cases and one control) and four first-trimester samples (three cases and one control).
Aliquots of 1.5 mL were prepared and shipped frozen to the laboratory of the California Department of Toxic Substances Control where they were assayed for DDTs (p, p’-DDT, o, p’-DDT, p, p’-DDE) using methods developed previously (6,25,26). Companion assays for cholesterol and triglycerides were run from aliquots of 150 μL of undiluted serum taken before the initiation of organochlorine assay. Total cholesterol and triglycerides were measured at the Clinical and Epidemiologic Research Laboratory at Boston Children’s Hospital using methods previously described (27).
Statistical Analysis
The present study is a prospective, nested case-control study. Cases (n = 153) were diagnosed at ages 50–54 years and were matched to up to 3 controls (n = 432) per case on year of birth. Birth years eligible for this study range from 1914 to 1952 (ages at pregnancy range from 15 to 46 years), giving the youngest mothers at enrollment an opportunity to come to diagnosis by age 54 years as of the year 2010. Controls were selected from the pool of available assayed subjects free of breast cancer at the age of diagnosis of the cases. Up to three controls were randomly assigned to each case matched on birth year, creating 153 case/control sets. Most sets (90%) comprised a case with three matched controls, five sets included two matched controls, and eleven sets included one matched control. Due to missing information on p, p’-DDT and p, p’-DDE (n = 3), o, p’-DDT (n = 13) and parity (n = 1) models were implemented in 568 mothers (n = 146 cases, n = 422 controls).
DDT exposure was classified in two ways: as tertiles based on the same cut points reported previously (5) to facilitate comparison of results for the two studies and as continuous log2-transformed variables. Age at first DDT exposure was calculated as 1945, the year DDT was first introduced into the United States, minus woman’s birth year. The cancer induction window encompasses the period between age at first exposure and cancer diagnosis. We used conditional logistic regression to estimate DDT associations with breast cancer in birth year-matched case-control sets. Statistical tests were two-sided with a cutoff of .05 for statistical significance. Models included year of blood draw and parity. We previously observed a strong p, p’-DDT association with early onset breast cancer (diagnosed before age 50 years) in women first exposed in infancy, from ages 0 to 4 years (5). To determine whether this was maintained for diagnoses at ages 50–54 years, we graphed case-control differences in log2-transformed p, p’-DDT by age at exposure stratified by age at diagnosis (<50 years vs ages 50–54 years). These graphs revealed that DDT-associated risk for breast cancer in the early menopausal window (ages 50–54 years) was observed for women exposed after infancy (Figure 1) . Based on both our prior results, where risk for early breast cancer was highest at ages 0–4 years and from the patterns observed in Figure 1, we tested the statistical significance of single-year cut points for age at exposure for the interval 0–4 years using cross-product terms with log2p, p’-DDT. We found that stratification by age 3 years provided the best description of the data, and therefore we report results based on this stratification. We identified outlier p, p’-DDT values using the exploratory data approach described by Tukey (28) and conducted a sensitivity analysis to determine whether results were affected by extreme values.
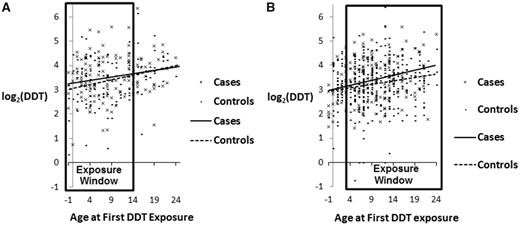
Case and control distributions of serum p.p’-DDT by age at first exposure and age at diagnosis of breast cancer. A) Cases younger than age 50 years. B) Cases from ages 50 to 54 years. For both outcomes, least squares regression lines are depicted for cases (solid lines) and controls (dashed lines).
We tested whether the joint effect of age at first exposure and p, p’-DDT differed by age at diagnosis in a pooled sample including all cases and all matched controls. We created three-way product terms between log2p, p’-DDT × age at first exposure × age at diagnosis (<50 years vs 50–54 years) for each of two age at first exposure categories: younger than 3 and 3–13 years versus 14+. P values for the statistical significance of these three-way terms tested whether the joint effect of age at first exposure and p, p’-DDT differed between younger (age <50 years) and older (ages 50–54 years) cases. We also estimated breast cancer odds ratios for p, p’-DDT jointly by age at first exposure and age at diagnosis using contrasts calculated from linear combinations of relevant terms estimated from this model.
All statistical tests were two-sided. A P value of less than .05 was considered statistically significant.
Results
Case and Control Distributions of Serum p.p’-DDT by Age at First Exposure to DDT and Age at Diagnosis of Breast Cancer in the CHDS Cohort
For women diagnosed before age 50 years (Figure 1A), the excess p, p’-DDT in breast cancer cases declined with increasing age at exposure, reaching zero by age 14 years. Women diagnosed from ages 50 to 54 years (Figure 1B) show a different pattern: there was no case-control difference in p, p’-DDT levels until after infancy and the excess among cases increased with age at exposure. Because the data in Figure 1 are from the same cohort, results suggest that women who were first exposed to DDT in infancy had earlier onset of breast cancer (diagnosed at age <50 years) and those who were first exposed to DDT after infancy had later onset of breast cancer (diagnosed at ages 50–54 years). Figure 1 supports a similar induction period of about 40 years after first DDT exposure for both outcome windows.
Current Case-Control Study (153 Cases Diagnosed From Ages 50–54 and 432 Controls Matched on Year of Birth)
Table 1 provides distributions of study variables for breast cancer diagnoses from age 50–54 years and matched controls. All DDTs showed a wide range of concentrations and right-skewed distributions among both the cases and controls. Cases and controls were highly comparable on age at first exposure with DDT, age at blood draw, age at observed pregnancy, year of blood draw, birth year, and parity.
Distribution of primary study characteristics for cases diagnosed from ages 50–54 years (n = 153) versus controls matched on year of birth (n = 432)
| Study variable | Cases* (n = 153) | Controls† (n = 432) | ||||||
|---|---|---|---|---|---|---|---|---|
| Percentile | Range | Percentile | Range | |||||
| 25th | 50th | 75th | 25th | 50th | 75th | |||
| p, p’-DDT, μg/L | 6.4 | 10.2 | 16.2 | 2.7, 48.0 | 6.5 | 9.4 | 14.3 | 0.6, 84.9 |
| p, p’-DDE, μg/L | 31.9 | 43.3 | 60.6 | 13.6, 157.5 | 31.0 | 41.1 | 54.0 | 9.3, 174.0 |
| o, p’-DDT, μg/L | 0.2 | 0.5 | 0.7 | 0.004, 2.7 | 0.2 | 0.4 | 0.6 | 0.004, 3.7 |
| Age at first exposure, y | 3 | 8 | 13 | −5, 25 | 5 | 8 | 13 | −5, 25 |
| Age at blood draw, y | 22 | 26 | 31 | 15, 42 | 22 | 26 | 30 | 15, 44 |
| Age at observed pregnancy, y | 22 | 26 | 31 | 15, 42 | 22 | 26 | 30 | 15, 44 |
| Age at first pregnancy‡, y | 19 | 22 | 26 | 15, 37 | 20 | 22 | 25 | 15, 40 |
| Year of blood draw | 1961 | 1963 | 1965 | 1960, 1967 | 1961 | 1962 | 1964 | 1960, 1967 |
| Birth year | 1932 | 1937 | 1942 | 1920, 1950 | 1932 | 1937 | 1940 | 1920, 1950 |
| Parity§ | 0 | 1 | 2 | 0, 5 | 0 | 1 | 2 | 0, 9 |
Cases included diagnoses that occurred from 50 to 54 years and were identified as of 2010.
Up to three controls were matched to each case on year of birth. Most case/control sets (90%) included a case with three matched controls, five sets included two matched controls, and eleven sets included one matched control.
Refers to age at first pregnancy of >28 weeks gestation.
Number of prior live births.
For women of all ages at first exposure to DDT, a doubling of serum p, p’-DDT was associated with doubling of risk for breast cancer diagnosed at ages 50–54 years (OR = 1.99, 95% CI = 1.48 to 2.67) (Table 2). However, stratification by age at first exposure to DDT shows this association is accounted for by women first exposed after infancy (ORDDT 50–54 for first exposure after infancy = 2.83, 95% CI = 1.96 to 4.10 vs ORDDT 50–54 for first exposure during infancy = 0.56, 95% CI = 0.26 to 1.19; P value interactionp, p’-DDT x age at first exposure = .01) (Table 2). There is evidence of dose response among women first exposed after infancy, with the top p, p’-DDT tertile associated with a doubling of risk (OR = 2.17, 95% CI = 1.13 to 4.19) (Table 2). These results are consistent with Figure 1B. Results in Table 2 were not changed by including p, p’-DDE (Table 2), age at first pregnancy (Supplementary Table 1, available online), or cholesterol and triglycerides as covariables (data not shown). Exclusion of outlier p, p’-DDT values did not affect the associations reported in Table 2 (Supplementary Table 2, available online).
Association of p, p’-DDT with breast cancer stratified by age of “first exposure” in 1945, the year DDT became widely available in the United States for two prospective case-control samples nested within the Child Health and Development Studies cohort
| Model | Current case-control sample (n = 153 cases/432 controls) for early postmenopausal breast cancer diagnoses from ages 50 to 54 y | Prior case-control sample (n = 129 cases/129controls) for premenopausal breast cancer diagnoses before age 50 y Cohn et al., 2007 (5) | |||||
|---|---|---|---|---|---|---|---|
| All ages | Younger than age 3 y | Age 3 y and older | Pinteraction with age§ | All ages | Younger than age 14 y¶ | Age 14 y and older¶ | |
| OR (95% CI) | OR (95% CI) | OR (95% CI) | OR (95% CI) | OR (95% CI) | OR (95% CI) | ||
| Model 1: includes all DDTs* | |||||||
| log2(p, p’-DDT) | 1.95 (1.34 to 2.83) | 0.69 (0.26 to 1.79) | 2.71 (1.72 to 4.27) | .01 | — | — | — |
| Model 2: excludes DDE† | |||||||
| log2(p, p’-DDT) | 1.99 (1.48 to 2.67) | 0.56 (0.26 to 1.19) | 2.83 (1.96 to 4.10) | .01 | — | — | — |
| Model 3: DDT tertiles‡ | |||||||
| Tertile 1 | 1.00 (Reference) | 1.00 (Reference) | 1.00 (Reference) | — | — | — | — |
| Tertile 2 | 0.97 (0.59 to 1.60) | 0.11 (0.01 to 0.91) | 1.30 (0.75 to 2.25) | .07 | — | — | — |
| Tertile 3 | 1.52 (0.83 to 2.77) | 0.10 (0.01 to 0.96) | 2.17 (1.13 to 4.19) | .02 | — | — | — |
| Model 4: DDT tertiles‖ | |||||||
| Tertile 1 | — | — | — | — | 1.00 (Reference) | 1.00 (Reference) | 1.00 (Reference) |
| Tertile 2 | — | — | — | — | 1.92 (0.93 to 3.97) | 2.77 (1.13 to 6.84) | 0.68 (0.14 to 3.30) |
| Tertile 3 | — | — | — | — | 2.79 (1.15 to 6.72) | 5.42 (1.71 to 17.19) | 0.62 (0.12 to 3.18) |
Model #1 includes: p, p’-DDT(log2-transformed as a continuous variable), p, p’-DDE (log2-transformed as a continuous variable), and o, p’-DDT (log2-transformed as a continuous variable), year of blood draw (continuous), and parity (continuous). The DDT odds ratio represents a one-unit change in log2(p, p’-DDT) corresponding to an estimated effect for a twofold increase in p, p’-DDT, a range encompassed within the interquartile range of the study sample (see Table 1). CI, confidence interval; OR, odds ratio estimated by conditional logistic regression.
Model #2 deletes p, p’-DDE as an independent variable because it was neither a confounder nor a predictor and associations for other variables are otherwise the same as in Model #1. As for Model 1, the OR represents a twofold increase in p, p’-DDT.
Model #3 includes two indicator variables for tertiles 2 and 3 of p, p’-DDT where tertile 1 was the reference category (tertile 1, <8.09 μg/L; tertile 2, 8.09–13.09 μg/L; tertile 3, >13.90 μg/L as coded in our previous publication [Cohn et al., 2007 (5)], o’, p’-DDT represented as a 3-cateogry ordinal variable coded at tertile medians as described in Table 4 of our previous publication [Cohn et al., 2007 (5)], year of blood draw (continuous), and parity (continuous).
P values for product terms between p, p’-DDT and age in 1945 (proxy for age at first exposure), dichotomized as younger than 3 years versus ≥3 years. For Models 1 and 2, an interaction term was added to the variables listed above to represent the product of continuous log2(p, p’-DDT) with age at first exposure. For Model 3, interactions were estimated using two product terms for each p, p’-DDT tertile with age at first exposure, dichotomized as younger than 3 years versus ≥3 years.
Model #4 included indicator variables for tertiles 2 and 3 of p, p’-DDT, where tertile 1 was the reference category (as described for Model #3), o’, p’-DDT represented as a three-cateogry ordinal variable coded at tertile medians (as described for Model #3), and year of blood draw (continuous).
P = .02 for interaction between age at first exposure and p, p’-DDT estimated by a product term between a dichotomous variable for age in 1945 (<14 vs. ≥14 years) and p, p’-DDT (continuous) in a conditional logistic regression model that included o’, p’-DDT and year of blood draw [Cohn et al., 2007 (5)].
Prior Case-Control Study (129 Cases Diagnosed Before Age 50 and 129 Controls Matched on Year of Birth)
For breast cancer diagnosed before age 50 years, tertile 3 of p, p’-DDT was associated with a nearly threefold increase in risk for breast cancer compared with tertile 1 for women of all ages at first exposure (OR = 2.79, 95% CI = 1.15 to 6.72) [Table 2; Cohn et al., 2007 (5)]. This association was accounted for by women first exposed to DDT prior to age 14 years (OR= 5.42, 95% CI = 1.71 to 17.19) [Table 2; Cohn et al., 2007 (5)].
Pooled Analysis (282 Cases Diagnosed Through Age 54 and 561 Controls Matched on Year of Birth)
The three-way interaction of p, p’-DDT by age at first exposure and age at diagnosis (Table 3) was statistically significant for women who were younger than 3 years of age at first exposure (ORDDT<50 for first exposure during infancy = 3.70, 95% CI = 1.22 to 11.26, P = .03) and for women who were ages 3–13 years at first exposure (P = .049). This result supports the hypothesis that DDT associations with breast cancer depend both on the exposure window and the outcome window. Results in Table 3 also support Figure 2, a schematic representation of the joint effects of p, p’-DDT, age at first exposure, and age at diagnosis on breast cancer risk. Among women first exposed before age 3 years, p, p’-DDT was associated with increased risk of early breast cancer (< 50 years) but not later breast cancer (ages 50–54 years). Among women first exposed from ages 3 to 13 years, p, p’-DDT was associated with increased risk of both early and late breast cancer. Among women first exposed after age 13 years, p, p’-DDT was associated only with increased risk of later breast cancer (ages 50–54 years) (Figure 2). The interaction of p, p’-DDT with age at exposure conditional on age at diagnosis was statistically significant for both the younger than 3 years and 3–13 years age groups, supporting the concept that p, p’-DDT exposure in infancy and before puberty confers the highest risk for early breast cancer younger than age 50 years (premenopause).
Pooled sample* to test whether the joint effect of age at exposure and DDT differ according to age at breast cancer (BC) diagnosis
| Age at first exposure, y | Study 1 | Study 2 | Pdifference‡ | |
|---|---|---|---|---|
| Premenopausal BC | Early postmenopausal BC | |||
| diagnosis ages <50 y | diagnosis ages 50–54 y | |||
| ORlog2DDT† (95% CI) | ORlog2DDT† (95% CI) | By age at diagnosis | By age at exposure and diagnosis | |
| <3 | 3.70 (1.22 to 11.26) | 0.92 (0.52 to 1.63) | .03§ | .03# |
| 3–13 | 5.16 (1.92 to 13.82) | 1.88 (1.37 to 2.59) | .59‖ | .049** |
| 14+ | 0.98 (0.51 to 1.88) | 2.26 (1.22 to 4.20) | .06¶ | Reference |
Pooled sample includes Study1: cases diagnosed by age 50 years (n = 129) and year-of-birth matched controls (n = 129) and Study 2: cases diagnosed from 50 to 54 years (n = 153) and year-of-birth matched controls (n = 432). BC, breast cancer; CI, confidence interval; OR, odds ratio estimated by conditional logistic regression.
Model includes: p, p'-DDT(log2-transformed as a continuous variables), o, p'-DDT(log2-transformed as a continuous variable), year of blood draw (continuous) and parity (continuous), 3 two-way product terms: log2(p, p'-DDT) X age at exposure (dichotomized as <3 years vs. 14+ years), log2(p, p'-DDT) X age at exposure (dichotomized as 3-13 years vs. 14+ years), and log2(p, p'-DDT) X age at diagnosis study (in <50 years study vs. in 50-54 years study), and 2 three-way product terms: log2(p, p'-DDT) X age at exposure (dichotomized as <3 years vs. 14+ years) X age at diagnosis study (in <50 years study vs. in 50-54 years study) and log2(p, p'-DDT) X age at exposure (dichotomized as 3-13 years vs. 14+ years) X age at diagnosis study (in <50 years study vs. in 50-54 years study). Odds Ratios (ORs) presented here are estimated from contrasts calculated using linear combinations of relevant terms from this model. The DDT OR represents a one-unit change in log2(p, p'-DDT), corresponding to an estimated effect for a twofold increase in p, p'-DDT, a range encompassed within the interquartile range of the study sample (see Table 1).
P values were based on probability greater than chi-square tested in conditional logistic regression models in SAS 9.3. All tests were two-sided.
P value resulting from test of product term: log2(p, p’-DDT) × age at first exposure (dichotomized as <3 years vs 14+ years).
P value resulting from test of product term: log2(p, p’-DDT) × age at first exposure (dichotomized as 3–13 years vs 14+ years).
P value resulting from test of product term: log2(p, p’-DDT) × age at diagnosis study (in <50 years study vs in 50–54 years study).
P value resulting from test of product term: log2(p, p’-DDT) × age at first exposure (dichotomized as <3 years vs 14+ years) × age at diagnosis study (in <50 years study vs in 50–54 years study).
P value resulting from test of product term: log2(p, p’-DDT) × age at first exposure (dichotomized as 3–13 years vs 14+ years) × age at diagnosis study (in <50 years study vs in 50–54 years study).
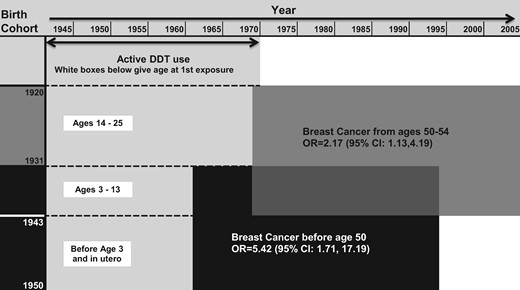
p, p’-DDT associated breast cancer by age at first exposure and age at diagnosis. The y-axis corresponds to study birth cohorts. The x-axis corresponds to calendar year. The light grey area indicates years of DDT use showing that all birth cohorts were DDT-exposed but first exposure occurred at different ages. White boxes show age at first exposure for relevant birth cohorts. The black box corresponds to birth cohorts diagnosed with breast cancer before age 50 years who were first exposed to DDT from in utero to age 13 years. The dark grey area corresponds to birth cohorts diagnosed from ages 50-54 years who were first exposed after infancy. Findings support that intrauterine and early infant p, p’-DDT exposure increases risk of premenopausal breast cancer, whereas p, p’-DDT exposure after infancy increases breast cancer risk in the early menopausal years. ORs and 95% CIs were estimated from conditional logistic regression models as described in Table 2.
Discussion
We used two independent nested prospective case-control samples within the CHDS to investigate whether DDT associations with breast cancer depend on both timing of exposure (exposure window) and timing of disease (outcome window). The use of the same cohort is a particular strength of this study.
Our first study in the CHDS (5) investigated breast cancers diagnosed prior to age 50 years, during the premenopausal outcome window. We observed a statistically significant p, p’-DDT association with breast cancer for all women. However, we also observed that this association depended on age at first exposure and was present only in women exposed before puberty. The p, p’-DDT-breast cancer association was also strongest for women exposed in utero or in infancy. This result is consistent with experimental evidence that early life is an important window of susceptibility for mammary cancer (1–3). We also observed that the induction period from first exposure to breast cancer was about 40 years.
In the present study, when we shifted the outcome window to ages 50–54 years, we observed a similar induction period of about 40 years between first DDT exposure and onset of breast cancer. However, in contrast to our earlier study, this association was accounted for by women first exposed after infancy. Moreover, the p, p’-DDT association for the age 50–54 years outcome window was smaller than that for breast cancer diagnosed before age 50 years. These results imply dependence of p, p’-DDT associations with breast cancer on both exposure windows and outcome windows. The statistical significance of this three-way interaction, which we report in the current study, supports this hypothesis. Taken together, these observations in the same cohort for different outcome windows suggest that intrauterine and infant DDT exposure increases risk of premenopausal breast cancer, whereas DDT exposure after infancy increases breast cancer risk in the early postmenopausal years. It is notable that DDT exposure during childhood and puberty (ages 3–13 years) was a risk factor for both outcome windows, likely reflecting vulnerability to breast cancer development during childhood and puberty for cancers diagnosed during premenopause (<50 years) through early postmenopause (ages 50–54 years).
The CHDS offers several advantages for investigating DDT associations with breast cancer (5). Briefly, p, p’-DDT levels were high in the CHDS because blood samples were collected before DDT was banned. This made it possible to accurately measure exposure. Women were young at blood collection and the study is prospective. Serum p, p’-DDT was measured during early postpartum, reflecting pregnancy exposures, two vulnerable windows for women (3,4).
Serum samples were primarily taken from postpartum blood draws within 1–3 days of delivery (>84% of samples in both studies). Organochlorine levels across pregnancy and just after delivery are highly correlated (29), so we would not expect gestational timing of blood draw to impact observed associations. Adjusting models for trimester of draw did not change reported associations. These two studies used assays performed in different laboratories. We have previously reported that although these laboratories used slightly different assay methods, DDT measures are comparable (26). Although we routinely identify 90% of our mothers during surveillance efforts, it is possible that we failed to identify some breast cancer cases. However, it is unlikely that case detection failure would be systematically biased according to p, p’-DDT levels.
We cannot estimate the contribution of genetic susceptibility to our findings. However, we know from our analysis of DDT and breast cancer in CHDS daughters that maternal history of breast cancer did not explain the association we observed between in utero DDT exposure and early breast cancer (6). It is possible that DDT may either induce a non-germline genetic susceptibility or alternatively interact with an unknown genetic susceptibility. A recent report has linked in utero DDT exposure with DNA methylation of BRCA1 in cord blood that reduces gene expression (30). This suggests that DDT exposure in early life could impair DNA repair, possibly helping to explain why in utero and infancy exposure to DDT is so strongly associated with early onset breast cancer in the CHDS.
In conclusion, p, p’-DDT is a risk factor for breast cancer through age 54 years for the founding generation in the CHDS (born 1915 to 1950) regardless of age at first exposure. However, risk patterns depended both on age at first exposure and timing of diagnosis. We observed greater susceptibility when first exposure occurred before puberty for breast cancer diagnosed before age 50 years. We also observed a long induction period (about 40 years) between first DDT exposure and onset of breast cancer regardless of first age at exposure. p, p’-DDT associations depended on exposure and outcome windows that encompass critical shifts in endocrine function, suggesting that DDT affects breast cancer as an endocrine disruptor.
Funding
This work was made possible by the Breast Cancer and the Environment Research Program (BCERP) grant U01 ES019471 from the National Institute of Environmental Health Sciences (NIEHS) and the National Cancer Institute (NCI), NIH, DHHS; and, by funding from the California Breast Cancer Research Program through the Special Research Initiative under Grant 15ZB-0186.
Notes
Affiliations of authors: Child Health and Development, Studies of the Public Health Institute, Berkeley, CA (BAC, PMC); Department of Epidemiology, Columbia University, Mailman School of Public Health, New York, NY (MBT); Herbert Irving Comprehensive Cancer Center, Columbia Medical Center, New York, NY (MBT).
We thank the CHDS families for their participation in this study. We acknowledge the late Jacob Yerushalmy who had the foresight to design and implement the CHDS; and the late Barbara van den Berg, the second Director of the CHDS, whose steadfast efforts were responsible for preserving the data and serum archive, thus granting the CHDS longevity. We gratefully thank Nathalie Stoer at the Norwegian National Advisory Unit on Women’s Health, Oslo University Hospital, Oslo, Norway for her support with biostatistical methods.
The authors report no conflict of interest.
The point of view and conclusions expressed in this paper are those of the authors and do not necessarily represent the official position or policies of the funding agency named above. The study sponsors had no role in the design of the study, the collection, analysis and interpretation of the data, the writing of the manuscript, or the decision to submit the manuscript for publication.
The collection of cancer incidence data used in this study was supported by the California Department of Public Health as part of the statewide cancer reporting program mandated by California Health and Safety Code Section 103885; the National Cancer Institute’s Surveillance, Epidemiology and End Results Program under contract HHSN261201000140C awarded to the Cancer Prevention Institute of California, contract HHSN261201000035C awarded to the University of Southern California, and contract HHSN261201000034C awarded to the Public Health Institute; and the Centers for Disease Control and Prevention’s National Program of Cancer Registries, under agreement U58DP003862-01 awarded to the California Department of Public Health. The ideas and opinions expressed herein are those of the author(s) and endorsement by the State of California, Department of Public Health, the National Cancer Institute, and the Centers for Disease Control and Prevention or their Contractors and Subcontractors, or any of the funders of this research is not intended nor should be inferred.

