


Abstract
The American Joint Committee on Cancer (AJCC) has proposed the inclusion of pretreatment serum carcinoembryonic antigen (CEA) level (C-stage) into the conventional TNM staging system of colon cancer. We assessed the prognosis of various stages of colon cancer after such an inclusion.
Data for all patients (N = 17 910) diagnosed with colonic adenocarcinoma (AJCC stages I, IIA, IIB, IIC, IIIA, IIIB, IIIC, and IV, based on TNM staging system) between January 1, 2004, and December 31, 2004, with a median follow-up of 27 months (range 0–35 months), were collected from the Surveillance, Epidemiology, and End Results database. C-stage (C0-stage = normal CEA level; C1-stage = elevated CEA level) was assigned to all patients with available CEA information (n = 9083). Multivariable analyses using Cox proportional hazards models were used to identify independent factors associated with prognosis. Prognosis of overall stages (AJCC stages I–IV and C0 or C1) was analyzed using Kaplan–Meier survival curves. All statistical tests were two-sided.
C1-stage was independently associated with a 60% increased risk of overall mortality (hazard ratio of death = 1.60, 95% confidence interval = 1.46 to 1.76, P < .001). Overall survival was decreased in patients with C1-stage cancer compared with C0-stage cancer of the respective overall stages ( P < .05). Similarly, decreased overall survival was noted in patients with stage I C1 cancer compared with stage IIA C0 or stage IIIA C0 cancer ( P < .001), in patients with stage IIA C1 cancer compared with stage IIIA C0 ( P < .001), and in patients with stage IIB C1 or stage IIC C1 cancer compared with stage IIIB C0 cancer ( P < .001).
C-stage was an independent prognostic factor for colon cancer. The results support routine preoperative CEA testing and C-staging upon diagnosis of colon cancer and the inclusion of C-stage in the conventional TNM staging of colon cancer.
Carcinoembryonic antigen (CEA) is a marker in common use in the management of colorectal cancer. In 2000, the American Joint Committee on Cancer (AJCC) proposed that the level of serum CEA (C-stage) at diagnosis of disease be included in the conventional TNM staging of CRC, but this is yet to be routinely followed and the implications of such an inclusion on the prognosis of various AJCC stages are unknown.
The Surveillance, Epidemiology, and End Results (SEER) database was used to collect data on patients who were diagnosed with histologically confirmed colonic adenocarcinoma in 2004. The median follow-up was 27 months. The prognosis of the various AJCC stages, after incorporation of C-stage into the conventional TNM system was evaluated in terms of risk of overall mortality and 2-year overall survival. The prognostic value of C-stage compared with nodal status (N-stage) was also analyzed.
C1-stage (elevated serum CEA) was an independent poor prognostic factor. Prognosis was worse in C1-stage patients with a lower AJCC stage, compared with C0-stage (normal serum CEA) patients with a higher AJCC stage. C1-stage was associated with worse prognosis than early nodal (N1 and N2a) stage disease.
Incorporation of C-stage into conventional AJCC staging resulted in stage migration. This implies that risk stratification and hence the contemporary adjuvant therapy strategies based on the AJCC staging system may need to be reconsidered after inclusion of C-stage.
CEA level was not tested in all colon adenocarcinoma patients and data were available for approximately 50% of the patients. Sample sizes were small for some substages. The follow-up period was also relatively short.
From the Editors
Colorectal cancer (CRC) is the third most common cause of cancer and cancer-related mortality in the United States ( 1 ). Approximately 72% of all CRC in 2009 were colonic in origin ( 2 ). CRC was staged using the classical Duke anatomical staging system based on the involvement of the bowel wall and regional lymph nodes ( 3 ). In the last two decades, colon cancer has been anatomically staged by the TNM system based on the anatomic extent of primary tumor (T-stage), nodal status (N-stage), and distant spread or metastases (M-stage) ( 3 ). Based on the TNM staging system, developed by the American Joint Committee on Cancer (AJCC), CRC patients are grouped as stage I (node-negative tumors within the subserosa), stage II (node-negative tumors beyond subserosa), stage III (node-positive nonmetastatic tumors), and stage IV (any metastases) colon cancers ( 4 ).
Serum carcinoembryonic antigen (CEA) is a 201 kDa highly glycosylated antigen expressed on the apical surface of colonic epithelial cells and excreted via the colonic lumen ( 5 ). With the disruption of normal tissue architecture in malignancy and loss of polarization of neoplastic cells located deep inside the tumor glandular tissue, CEA may be expressed on the whole cell surface and is eventually shed into the bloodstream leading to a rise in serum CEA levels ( 5–7 ). Experiments in mouse models have shown that CEA-producing tumors have a higher tumorigenic potential and ability for distant spread, which is suggested by its role in cell adhesion ( 6 , 7 ). In 1978, Wanebo et al. ( 8 ) first described an inverse linear relationship between preoperative serum CEA levels and the estimated mean time to recurrence in Duke B and C colorectal cancer. In 1984, using data from two prospective randomized trials from the National Surgical Adjuvant Breast and Bowel Project (NSABP), Wolmark et al. ( 9 ) showed that preoperative CEA was a poor prognostic factor, independent of Duke stage and the number of positive nodes, and correlated with treatment failure in Duke B and C disease. Although several tumor markers and prognostic indicators are available for CRC, serum CEA has been shown to be the single most important and reliable independent prognostic factor ( 10 ).
In 2000, based on the results of several studies showing serum CEA to be a stage-independent poor prognostic factor in CRC ( 5 , 8 , 9 , 11–15 ), the Colorectal Working Group of the AJCC proposed the inclusion of serum level of CEA (C-stage) at presentation of disease into conventional TNM staging of CRC ( 16 ). C-stage was further classified into substages: not assessable (Cx), not elevated (ie, <5 ng CEA/mL serum; C0) or elevated (ie, >5 ng CEA/mL serum; C1) ( 16 ). Accordingly, based on the CEA levels, overall staging would be expressed as stages I–IV Cx or C0 or C1 ( 16 ). Moreover, the American Society of Clinical Oncology (ASCO) ( 17 ) and the European Group on Tumor Markers ( 10 ) have both recommended the use of preoperative serum CEA as a prognostic tool in CRC. However, since the AJCC proposal in 2000, C-stage is yet to be incorporated in colon cancer staging, as it has not been validated or its implications in patient care been analyzed clearly. Substantial obstacles to its incorporation includes the continued use of Duke staging system in the last decade ( 18 , 19 ), periodic revisions of the AJCC staging system ( 20 ), and variable definitions of an “elevated” CEA level ( 8 , 21 ). Also, most of the recent studies on CRC prognosis based on preoperative CEA levels were done on Asian patients ( 15 , 19 , 22–25 ), with little data pertaining to the American population. To address these issues, in this study, we studied the effect of inclusion of C-stage into the most recent AJCC staging system (7th edition; 2010) ( 4 ) on prognosis using a large population-based US database. We performed this study to validate and understand the clinical implications of including CEA status in the staging and management of colon cancer.
Participants and Methods
Data Sources and Selection of Patients
The Surveillance, Epidemiology, and End Results (SEER) program is a National Cancer Institute–based authoritative source of cancer data in the United States, with coverage of 26% of the population ( 26 ). The SEER 17 registries include Alaska Native Tumor Registry, Los Angeles, San Francisco-Oakland, San Jose-Monterey, Greater California, Connecticut, Detroit, Atlanta, Rural Georgia, Hawaii, Iowa, Kentucky, Louisiana, New Jersey, New Mexico, Seattle-Puget Sound, and Utah. More information can be found at http://seer.cancer.gov/registries/terms.html .
SEER*Stat is a software provided by the SEER program to obtain patient information using online access. The case-listing session of the SEER*Stat software was used to list all patient-related information. The exact codes used are provided below, as italicized words within quotes. We extracted all patients (N = 37 870) diagnosed with CRC between January 1, 2004, to December 31, 2004, by accessing the database named “SEER 17 Regs Research Data + Hurricane Katrina Impacted Louisiana Cases, Nov 2008 Sub (1973–2006 varying),” and using the codes “2004” for year of diagnosis and “Colon and Rectum” for the field “Site and Morphology. Site rec with Kaposi and mesothelioma.” Age in years when the patient was first diagnosed with cancer and sex was obtained. Race information was available as whites, blacks, American Indians or Alaska Natives, and Asian or Pacific Islanders. We grouped American Indians or Alaska Natives and Asian or Pacific Islanders along with races that are not specified as “others,” so that race information was classified as “white,” “black,” or “others.” The tumor location of the primary tumor was obtained using the code “Primary site-labeled” (available as cecum, ascending colon, descending colon, hepatic flexure, transverse colon, splenic flexure, sigmoid colon, or overlapping lesion). Tumor histology was coded in the database as per the International Classification of Diseases for Oncology, Third Edition (ICD-O-3), and was accessed using the code, “ICD-O-3 Hist/behav.” Grade of primary tumor, when known, was available as well differentiated, moderately differentiated, poorly differentiated, undifferentiated, or anaplastic. The marital relationship status of the patient was available as single (never married), married (including common law), separated, divorced, widowed, or unknown and was accessed using the code “Marital status at diagnosis.” The radiation therapy given to the patient was available using the code “Radiation.” In addition to the above general information, the SEER program codes information specific to the type of tumor as “CS” codes. CEA level obtained before the treatment (ie, preoperative CEA level), was obtained using the code “CS site-specific factor 1,” which was coded as “test not done,” “positive/elevated,” “negative/normal; within normal limits,” “borderline; undetermined whether positive or negative,” “ordered, but results not in chart” or “unknown or no information.” According to the SEER instructions, which uses the collaborative staging system for coding CEA levels ( 27 ), the cancer registrars are to code whether CEA level was elevated or normal, based on the physicians’ interpretation of the CEA level as recorded in the chart or by using the reference values provided by the test laboratory reporting the CEA level. Because serum CEA may vary with patient-related factors (eg, smoking, liver disease) and nonpatient–related factors (eg, assay techniques) ( 5 ), a single cutoff value may be inappropriate while studying a vast population. The collaborative staging system addresses this concern by using the physician’s interpretation of CEA as recorded in the medical record when available, or by using the reference values provided by the laboratory performing the patient's test. We grouped “positive/elevated” and “negative/normal; within normal limits” as those who had CEA level (ie, C-stage information) available for analysis. Of the 37 870 patients, we used the following exclusion criteria: rectal, recto sigmoid and appendiceal tumors, lack of positive histological confirmation, non-adenocarcinomatous histologies, lifetime occurrence of another primary malignancy, unknown staging information, and in situ cancers. This left us with 17 910 histologically proven colonic adenocarcinomas, of which 9083 patients (50.71%) had CEA level available for analysis. We chose to study only colon cancer and to exclude rectal tumors for two reasons. First, release of CEA from rectal cancers may bypass its usual first-pass hepatic metabolism via pelvic venous drainage into the systemic circulation resulting in higher serum levels than for colon cancers ( 21 , 28 ). Second, differences in anatomy and clinical behavior of rectal cancer mandate different stage-specific treatments, which may confound the interpretation of prognosis of each CEA information-incorporated TNM stage ( 29 ). Because of differences in natural history, appendiceal tumors were also removed from analysis, as recommended by the AJCC Colorectal Working Group ( 16 ). Before the exclusion of patients with missing or unknown staging information, 65 out of 9083 patients (0.72%) were found to have “borderline” CEA levels and were excluded from the study. The anatomic extent of the primary tumor was obtained using the code “CS extension,” which was used to derive the T-stage for each patient according to the AJCC staging manual (T1 = tumor invades submucosa; T2 = tumor invades muscularis propria; T3 = tumor invades through the muscularis propria into pericolorectal tissues; T4a = tumor penetrates to the surface of the visceral peritoneum; T4b = tumor directly invades or is adherent to other organs or structures). Using the code “regional nodes positive (2004+),” the N-stage was derived according to the AJCC staging manual (N0 = no regional node metastasis; N1 = metastasis in one to three regional lymph nodes; N2a = metastasis in four to six regional lymph nodes; N2b = metastasis in seven or more regional lymph nodes). The number of regional nodes examined was also available in the database. Information on distant spread or metastasis was available using the code, “Derived AJCC M, 6th ed (2004+)” from which the M-stage was derived according to the AJCC staging manual (M0 = no distant metastasis; M1 = presence of distant metastases). Thus, the T-, N-, and M-stages of the tumor were manually derived for each patient as per the AJCC staging system (7th edition; 2010) ( 4 ). Based on the TNM staging for each patient and per AJCC staging system (7th edition; 2010) ( 4 ), we assigned an overall AJCC stage (I, IIA, IIB, IIC, IIIA, IIIB, IIIC, or IV) to each patient. Among patients with available information on CEA level, those with elevated CEA level were designated as “C1-stage” and those with normal CEA level as “C0-stage.” After inclusion of C-staging into TNM staging, an overall stage (stages I–IV C0 or C1) was assigned to each patient. A flow chart showing the inflow of CRC patients in the study population is shown in Figure 1 .
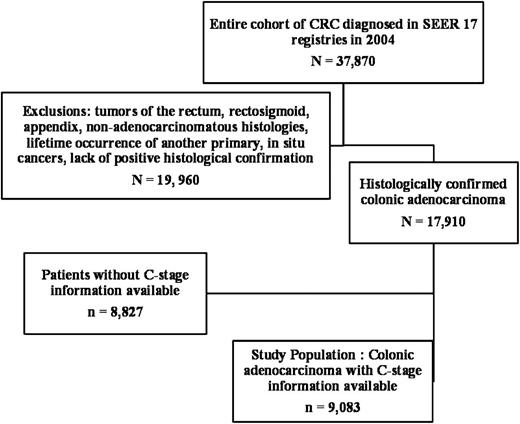
Flow diagram of colonic adenocarcinoma patients selected for the study. In the Surveillance, Epidemiology, and End Results (SEER) 17 registries of the SEER database, 37 870 patients were diagnosed with colorectal cancer in 2004, of which 17 910 patients had histologically confirmed colonic adenocarcinoma, after application of inclusion and exclusion criteria. Of the 17 910 patients, serum CEA level before treatment (C-stage) was available in 9083 patients and unavailable in 8827 patients. CRC = Colorectal cancer. The median follow-up was 27 months (range 0–35 months).
Statistical Analyses
We used several regression analyses using Cox proportional hazards models to identify independent prognostic factors along with hazard ratios (HR) for overall mortality at a median follow-up of 27 months (range, 0–35 months). The hazard ratios were presented along with 95% confidence intervals (CI). Depending on the analysis, age, sex, race, marital status, availability of CEA, CEA level at presentation, SEER registry, histological grade, location of primary tumor, stage (TNM or overall), type of surgical treatment, and radiation therapy were all possible covariates used. In one multivariable analysis, we used a novel covariate “NC” to study the interaction of N-stage (N0, N1, N2a, and N2b, based on TNM staging) and C-stage (C0 and C1, based on CEA level) on prognosis among nonmetastatic patients. In every regression analysis, only those covariates that satisfied the proportional hazards assumption, as examined by the survival and log minus log curves, and approached at the very least, borderline statistical significance (log rank, P < .20) on univariate analysis were included in the final multivariable analysis. One of the covariates, “Radiation therapy (administered/not administered)” did not satisfy the proportional hazards assumptions and hence, the models were stratified according to this covariate. Kaplan–Meier curves were used to analyze overall survival, along with log-rank tests to assess statistical significance. Hochberg method ( 30 ) was used to adjust for multiple comparisons. Two-year observed survival (also known as 2-year overall survival) rates (ie, an estimate of the probability of surviving all causes of death for a specific time interval, which is calculated from the cohort of cancer cases) were also obtained using the survival session of the SEER*Stat software. All tests used in the study were two-sided and a P value less than .05 defined statistically significant differences (except for covariate selection in the initial univariate analysis). Analyses were performed using SAS/STAT software (Version 9.2; SAS Institute, Inc, Cary, NC, USA) and PASW software (PASW 18, IBM, Chicago, Ill).
Results
Assessment of C-stage as a Prognostic Factor in Colon Cancer
We performed a multivariable analysis to identify the factors that were independently associated with increased or decreased overall mortality in patients (n = 9083) of all AJCC stages (I–IV) after a median follow-up of 27 months (range, 0–35 months). C1-stage (ie, an elevated serum CEA level before treatment) was independently associated with poor prognosis in colonic adenocarcinoma, with an approximately 60% increased risk of overall mortality (HR of death = 1.60, 95% CI = 1.46 to 1.76, P < .001) ( Table 1 ). Other factors that were independently associated with adverse prognosis included increasing age, hepatic flexure location, less-differentiated histological grade, higher AJCC stage, and a single relationship status at diagnosis. Factors such as sigmoid colon location, complete surgical resection, and a married or widowed marital status at diagnosis were independently associated with favorable prognosis. A similar multivariable analysis performed using only patients with nonmetastatic (ie, AJCC stages I–III) tumors (n = 6644 patients) also showed that C1-stage was independently associated with increased risk of overall mortality (HR of death = 1.59, 95% CI = 1.42 to 1.79, P < .001) (Supplementary Table 1, available online)—indicative of poor prognosis. Results affirmed that C-stage was an independent poor prognostic factor.
Independent prognostic factors in colonic adenocarcinoma *
| Covariate | Reference | Variable | Overall mortality * | ||
| HR (95% CI) | SE | P† | |||
| Age | Continuous variable | 1.04 (1.03 to 1.04) | 0.01 | <.001 | |
| Race | White | Black | 1.04 (0.91 to 1.18) | 0.07 | .56 |
| Other | 0.94 (0.79 to 1.12) | 0.09 | .51 | ||
| Colonic site | Cecum | Ascending colon | 0.98 (0.87 to 1.11) | 0.06 | .75 |
| Descending colon | 0.85 (0.71 to 1.03) | 0.10 | .09 | ||
| Hepatic flexure | 1.31 (1.10 to 1.56) | 0.09 | .002 | ||
| Overlapping lesion | 1.28 (0.99 to 1.66) | 0.13 | .06 | ||
| Sigmoid colon | 0.87 (0.78 to 0.97) | 0.06 | .01 | ||
| Splenic flexure | 1.09 (0.89 to 1.32) | 0.10 | .42 | ||
| Transverse colon | 1.14 (0.99 to 1.32) | 0.07 | .07 | ||
| C-stage | C0-stage | C1-stage | 1.60 (1.46 to 1.76) | 0.05 | <.001 |
| Histological grade | Well-differentiated | Moderately differentiated | 1.25 (1.04 to 1.49) | 0.09 | .02 |
| Poorly differentiated | 1.72 (1.43 to 2.08) | 0.10 | <.001 | ||
| Undifferentiated | 1.61 (1.14 to 2.28) | 0.18 | .007 | ||
| AJCC staging ‡ | Stage I | IIA | 1.09 (0.90 to 1.32) | 0.10 | .38 |
| IIB | 1.95 (1.42 to 2.67) | 0.16 | <.001 | ||
| IIC | 2.13 (1.51 to 2.99) | 0.17 | <.001 | ||
| IIIA | 0.98 (0.66 to 1.46) | 0.21 | .92 | ||
| IIIB | 1.74 (1.45 to 2.10) | 0.10 | <.001 | ||
| IIIC | 3.41 (2.76 to 4.22) | 0.11 | <.001 | ||
| IV | 7.79 (6.52 to 9.30) | 0.09 | <.001 | ||
| Surgery | None | Local excision | 0.70 (0.41 to 1.21) | 0.28 | .20 |
| Surgical resection | 0.46 (0.41 to 0.53) | 0.07 | <.001 | ||
| Marital status | Single (never married) | Separated | 0.90 (0.76 to 1.06) | 0.08 | 0.20 |
| Married | 0.73 (0.64 to 0.82) | 0.06 | <.001 | ||
| Widowed | 0.82 (0.71 to 0.94) | 0.07 | .006 | ||
Multivariable analysis using Cox proportional hazards model of all independent prognostic factors affecting overall mortality at median follow-up of 27 months among patients (n = 9083 patients) diagnosed in 2004, for whom C-stage information was available. Data were obtained from Surveillance, Epidemiology, and End Results (SEER) 17 registries. Models were stratified by radiation therapy covariate. The registry in which the patient was registered was also used as a covariate. None of the SEER 17 registries emerged as an independent prognostic factor ( P > .05). Numbers may not equal the sample size of the final analytic cohort because of missing data on some of the covariates. AJCC = American Joint Committee on Cancer; CI = confidence interval; C1-stage = elevated level of serum carcinoembryonic antigen; C0-stage = normal level of serum carcinoembryonic antigen; HR = hazard ratio; SE = standard error.
Two-sided P values were calculated using log-rank test.
Per AJCC Staging Manual (7th edition, 2010) ( 4 ).
Next, we analyzed the impact of availability of CEA levels (C-stage) on prognosis. Of all patients diagnosed with colonic adenocarcinoma (N = 17 910) documented in the SEER 17 registries, CEA results were available in 9083 patients (50.71%). The availability of CEA showed regional registry differences, ranging from 28% in Georgia to 68% in Hawaii. Multivariable analysis in the larger dataset (before the exclusion of unavailable CEA levels) using regional registry as one of the covariates suggested that the availability of CEA level (but not the regional registry) was independently associated with decreased risk of overall mortality (HR of death = 0.87, 95% CI = 0.83 to 0.93, P < .001) (Supplementary Table 2, available online)—indicative of favorable prognosis.
Prognosis of Colon Cancer After Incorporation of C-Stage into TNM Staging
To analyze the prognosis of each AJCC stage (stages I, IIA, IIB, IIC, IIIA, IIIB, IIIC, and IV based on TNM staging) after incorporation of C-stage (stages C0 or C1), we generated Kaplan–Meier survival curves of all AJCC stages for all patients with available C-stage information (n = 9083) ( Figure 2, A–C ). All C1-stage patients showed a statistically significantly decreased overall survival compared with C0-stage patients (log-rank test, P < .05) of the respective AJCC stages. The only exception was stage IIB, where the difference between C0-stage patients (n = 94) and C1-stage patients (n = 85) approached but did not attain statistical significance (log-rank test, P = .09), which may have been because of the relatively smaller sample size ( Figure 2, B ). Furthermore, the overall survival of C1-stage patients either decreased or remained similar compared to C0-stage patients of higher AJCC stages, producing a substantial overlap and crossover between the survival curves of conventional AJCC stages ( Figure 2, A–C ). For example, we noted a decrease in overall survival of stage I C1 patients compared with stage IIA C0 or stage IIIA C0 patients (log-rank test, P < .001). Similarly, we observed a decrease in overall survival of stage IIA C1 patients compared with stage IIIA C0 patients (log-rank test, P < .001). Overall survival of stage IIB C1 or IIC C1 patients was also decreased compared with stage IIIB C0 patients (log-rank test, P < .001).
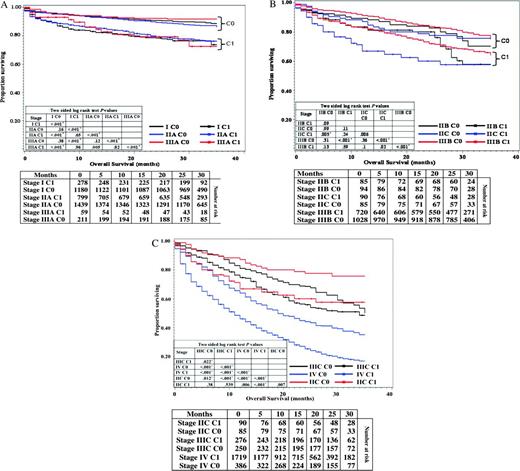
Kaplan–Meier curves for overall survival of all C-stage incorporated AJCC stages. A) Overall survival in patients with stage I, IIA, and IIIA C0 or C1 cancers. B) Overall survival in patients with stage IIB, IIC and IIIB C0 or C1 cancers. C) Overall survival in patients with stage IIC, IIIC and IV cancers. Life tables for the number of colonic adenocarcinoma patients at risk are presented below each graph. Raw log-rank P values (two-sided) are provided in a matrix within each graph. Hochberg method was used to adjust for multiple comparisons. *Attained statistical significance, even after application of Hochberg method of adjustment.
To verify the association between C-stage and what appeared to be cancer stage migration in terms of prognosis, we compared the hazard ratios derived from Cox regression analysis for each AJCC stage before and after incorporation of C-stage, while controlling for other prognostic factors. We also calculated 2-year overall survival rates. Here again, we observed that after incorporation of C-stage, C0-stage patients showed increased 2-year overall survival rates and lower hazard ratios (both indicating better prognosis) compared with C1-stage patients of the respective overall stages, except in the case of stage IIB ( Table 2 ). In addition, the hazard ratios of C1-stage patients of each AJCC stage closely approached or exceeded those of C0-stage patients of higher AJCC stages. For example, the risk of overall mortality was higher in stage I C1 patients (HR of death = 2.15, 95% CI = 1.15 to 3.07) compared with stage IIA C0 patients (HR of death = 1.08, 95% CI = 0.83 to 1.41), stage IIB C0 patients (HR of death = 2.04, 95% CI = 1.25 to 3.33), or stage IIIA C0 patients (HR of death = 0.92, 95% CI = 0.52 to 1.61) ( Table 2 ). Similarly, the risk of overall mortality was higher in stage IIC C1 patients (HR of death = 2.80, 95% CI = 1.71 to 4.59) compared with stage IIIA C0. However, the risk of overall mortality was similar in stage IIIA C1 patients (HR of death = 1.76, 95% CI = 0.91 to 3.41) and stage IIIB C0 patients (HR of death = 1.89, 95% CI = 1.45 to 2.44) ( Table 2 ). It is important to note that the overlapping confidence intervals indicated a substantial overlap between the prognosis of the various stages. These findings demonstrated that C1 was associated with an “upstaging” effect on most stages. Such prognostic stage migration was more pronounced in lower AJCC stages (I–IIIA), whereas no stage migration was noted between stages IIIC and IV.
Prognosis of colon cancer after incorporation of C-stage into conventional AJCC stages *
| Conventional staging, (n = 17 910 patients) | After incorporation of C-stage into conventional staging, (n = 9083 patients) | |||||||
| Stage † | 2-y OS rate ‡ | Overall mortality | Stage | 2-y OS rate ‡ | Overall mortality | |||
| HR (95% CI) § | P‖ | HR (95% CI) § | SE | P ‖ | ||||
| I | 88.3% | 1.0 (Referent) | — | I C0 | 90.8% | 1.0 (Referent) | — | — |
| I C1 | 78.2% | 2.15 (1.51 to 3.07) | 0.18 | <.001 | ||||
| IIA | 85.9% | 1.34 (1.16 to 1.55) | <.001 | IIA C0 | 89.4% | 1.08 (0.83 to 1.41) | 0.14 | 0.55 |
| IIA C1 | 79.4% | 2.05 (1.57 to 2.68) | 0.14 | <.001 | ||||
| IIB | 81.1% | 2.33 (1.85 to 2.95) | <.001 | IIB C0 | 82.8% | 2.04 (1.25 to 3.33) | 0.25 | 0.004 |
| IIB C1 | 80.0% | 3.28 (2.13 to 5.05) | 0.22 | <.001 | ||||
| IIC | 68.7% | 2.91 (2.28 to 3.72) | <.001 | IIC C0 | 77.6% | 2.40 (1.40 to 4.11) | 0.28 | 0.002 |
| IIC C1 | 60.0% | 2.80 (1.71 to 4.59) | 0.25 | <.001 | ||||
| IIIA | 89.5% | 1.11 (0.81 to 1.50) | 0.52 | IIIA C0 | 92.3% | 0.92 (0.52 to 1.61) | 0.29 | 0.76 |
| IIIA C1 | 79.3% | 1.76 (0.91 to 3.41) | 0.34 | 0.10 | ||||
| IIIB | 78.9% | 2.08 (1.80 to 2.40) | <.001 | IIIB C0 | 83.8% | 1.88 (1.45 to 2.44) | 0.13 | <.001 |
| IIIB C1 | 71.9% | 2.90 (2.24 to 3.76) | 0.13 | <.001 | ||||
| IIIC | 61.7% | 4.49 (3.81 to 5.28) | <.001 | IIIC C0 | 68.4% | 4.46 (3.29 to 6.04) | 0.16 | <.001 |
| IIIC C1 | 55.8% | 5.16 (3.88 to 6.87) | 0.15 | <.001 | ||||
| IV | 28.5% | 10.32 (9.01 to 11.83) | <.001 | IV C0 | 44.0% | 8.73 (6.70 to 11.36) | 0.14 | <.001 |
| IV C1 | 25.0% | 13.49 (10.71 to 16.98) | 0.12 | <.001 | ||||
AJCC = American Joint Committee on Cancer; CI = confidence interval; HR = hazard ratio; OS = overall survival; SE = standard error.
Per AJCC Staging Manual (7th edition, 2010) ( 4 ).
Estimated probability of overall survival for 2 years.
Multivariable analysis using Cox proportional hazards model of all independent prognostic factors associated with overall survival in patients diagnosed with colonic adenocarcinoma in 2004, before and after incorporation of C-staging into conventional AJCC staging. Data were obtained from Surveillance, Epidemiology, and End Results (SEER) 17 registries. Models were stratified by radiation therapy covariate. The registry in which the patient was registered was also used as a covariate. None of the SEER 17 registries emerged independent prognostic factors ( P > .05). Numbers may not equal the sample size of the final analytic cohort because of missing data on some of the covariates.
Two-sided P values were calculated using log-rank test.
Association of C-Stage and N-Stage with Prognosis
Node positivity has traditionally been the indication for adjuvant therapy in colon cancer ( 31 ). Therefore, we compared the association of N-stage and C-stage on prognosis and hence the implications of elevated preoperative CEA level on the need for adjuvant therapy in nonmetastatic colon cancer. Survival rates, extracted using the survival session of the SEER*Stat software showed that node-positive C0-stage patients had a better prognosis than node-negative C1-stage patients in general ( Table 3 ). In each nodal stage, C1-stage patients had decreased 2-year overall survival compared with C0-stage patients. We also derived the hazard ratios for each combination of N-stage and C-stage using a separate multivariable analysis among nonmetastatic patients (n = 6819), while controlling for all other prognostic factors including T-stage, which is the depth of tumor invasion ( Table 3 ). We observed that N0 C1 patients had a higher risk of overall mortality (HR of death = 1.75, 95% CI = 1.48 to 2.09) compared with N1 C0 patients (HR of death = 1.58, 95% CI = 1.30 to 1.91), suggesting that C1-stage may be associated with worse prognosis, compared with N1-stage. Similarly, N1 C1 patients (HR of death = 2.24, 95% CI = 1.84 to 2.72) had a higher risk of overall mortality compared with N2a C0 patients (HR = 1.95, 95% CI = 1.44 to 2.65), suggesting that C1-stage may be associated with worse prognosis than N2a-stage as well. However, such a prognostic trend was not found with N2b-stage as N2b C0 (HR of death = 3.84, 95% CI = 2.87 to 5.13) was associated with a higher risk of overall mortality compared with N2a C1 (HR of death = 2.90, 95% CI = 2.23 to 3.78).
Association of C-stage and N-stage with prognosis of nonmetastatic colonic adenocarcinoma *
| Tumor characteristic (node and CEA status) † | Overall survival ‡ | Overall mortality | ||||
| No. of patients | Rate (95% CI)% | SE | HR (95% CI) § | SE | P‖ | |
| Node-negative CEA-negative N0 C0 | 2494 | 89.3 (88.0 to 90.4) | 0·6 | 1.0 (Referent) | ||
| Node-negative CEA-positive N0 C1 | 1067 | 76.5 (73.9 to 79.0) | 1.3 | 1.75 (1.48 to 2.09) | 0.09 | <.001 |
| Node positive CEA negative | 1227 | 82.5 (80.2 to 84.5) | 1·1 | |||
| N1 C0 | 870 | 85.0 (82.5 to 87.2) | 1·2 | 1.58 (1.30 to 1.91) | 0.10 | <.001 |
| N2a C0 | 210 | 80.3 (74.2 to 85.1) | 2·8 | 1.95 (1.44 to 2.65) | 0.16 | <.001 |
| N2b C0 | 147 | 70.6 (62.5 to 77.3) | 3·8 | 3.84 (2.87 to 5.13) | 0.15 | <.001 |
| Node positive CEA positive | 877 | 69.1 (65.9 to 72.1) | 1·6 | |||
| N1 C1 | 545 | 72.8 (68.9 to 76.3) | 1·9 | 2.24 (1.84 to 2.72) | 0.10 | <.001 |
| N2a C1 | 195 | 67.1 (60.0 to 73.2) | 3·4 | 2.90 (2.23 to 3.78) | 0.14 | <.001 |
| N2b C1 | 137 | 57.2 (48.4 to 65.0) | 4·3 | 3.78 (2.86 to 4.99) | 0.14 | <.001 |
CEA = carcinoembryonic antigen; CI = confidence interval; CEA; C1 = elevated serum CEA; C0 = normal serum; HR = hazard ratio; N1 = metastasis in one to three regional lymph nodes; N2a = metastasis in four to six regional lymph nodes; N2b = metastasis in seven or more regional lymph nodes; N0 = no regional node metastasis; SE = standard error. Numbers may not equal the sample size of the final analytic cohort because of missing data on some of the covariates.
N-staging per American Joint Committee on Cancer Staging System (7th edition, 2010) ( 4 ).
Estimated probability of overall or observed survival for 2 years obtained by Kaplan–Meier survival method (with no adjustment for heterogeneity) for all patients diagnosed in 2004 in the SEER 17 registries, after application of similar inclusion and exclusion criteria in microscopically confirmed, actively followed, nonmetastatic patients of known age reported in the limited-use database, which includes only patients reported by Surveillance, Epidemiology, and End Results (SEERs) research.
Multivariable analysis using Cox proportional hazards model of all independent prognostic factors (including T-stage) affecting overall survival at median follow-up of 27 months in all nonmetastatic patients (n = 6819 patients) in the SEER 17 registries diagnosed in 2004, after application of inclusion and exclusion criteria. A novel covariate “NC” (combination of nodal status and CEA status) was included.
Two-sided P values were calculated using log-rank test.
Discussion
In this study, we analyzed the early prognosis of patients with histologically proven colonic adenocarcinoma, after incorporation of C-stage into TNM staging. The large US population-based SEER database was used to collect patient data. Although preoperative serum CEA level is recommended as part of diagnostic work-up, data were not available for nearly half of the US population covered by the SEER database. We analyzed patients with available CEA information and demonstrated that elevated level of serum CEA was an independent poor prognostic factor. Our study identified a subset of patients in each AJCC stage by C1-stage status who have markedly poorer prognosis, and it demonstrated that the prognosis of this subset was similar to or worse than a subset of patients identified by C0-stage status who belonged to a higher AJCC stage and may have received a different treatment. Furthermore, we have shown that C1-stage disease may be an equally strong, if not stronger predictor of worse prognosis, compared with node positivity. The results of our study support the inclusion of C-stage into the conventional TNM staging system for colon cancer.
The observations made in this study raise the probability of undertreatment of a subset of colonic adenocarcinoma patients; this in turn warrants a serious reconsideration of the current strategies for the management of nonmetastatic colon cancer. For further discussion, let us consider that it is safe to assume with accuracy that in the United States, at least since 2004, the paradigm for treatment of colon cancer has been stage specific, or more particularly node specific. Stage I/II (node-negative stages) are treated with surgical resection alone, stage III (node-positive stage) with surgery and systemic adjuvant therapy, and stage IV (metastatic) with systemic chemotherapy only with or without palliative surgery ( 32 ). An exception to this generalization is stage II colon cancer, which is discussed in detail below.
We observed that stage I C1 had a worse prognosis than stage IIIA C0. The only pathological difference between stage I (T1–T2 N0 M0) and IIIA (T1–T2 N1 M0) is N1 disease ( 4 ). However, we observed that C1-stage might be a stronger factor for poor prognosis than N1-stage. Given the paradigm that adjuvant therapy is given for stage IIIA but not stage I disease, we recommend studying the benefit of adjuvant therapy based on risk of recurrence and prospective testing.
Optimal management of stage II has been an unclear gray area because of the observation of lower survival rates for stage II compared with stage IIIA ( 4 , 20 ). The belief that this was because of the benefit of adjuvant therapy in stage III has fuelled several studies and debates on the benefit of adjuvant therapy in stage II colon cancer. In 1997, the North Central Cancer Treatment Group (NCCTG) trial showed no benefit of 5-fluorouracil (FU)-based adjuvant chemotherapy in ‘high-risk’ stage II tumors ( 33 ). The subsequent International Multicentre Pooled Analysis of B2 Colon Cancer (IMPACT-B2) trial also showed no benefit of 5-FU–based adjuvant therapy ( 34 ). In 2004, the US Intergroup Pooled analysis showed similar results ( 35 ). In that same year, an expert panel of the ASCO concluded that direct evidence from randomized controlled trials failed to demonstrate benefit of adjuvant therapy, even in high-risk patients. However, the experts suggested that only “high-risk” otherwise medically fit stage II patients may be offered adjuvant therapy. The criteria for high-risk was described as inadequately sampled nodes, T4 lesions, tumor perforation, or poorly differentiated histology (without including CEA as a high-risk factor) ( 31 ). In an update in 2006, the ASCO expert panel concluded that data were insufficient to support the use of serum preoperative CEA in determining need for adjuvant therapy in stage II disease ( 17 ). In 2007, the results of the Quick and Simple and Reliable (QUASAR) trial showed only a small benefit from 5-FU–based chemotherapy in stage II patients at “low risk” for recurrence ( 36 ). In 2009, the Multicenter International Study of Oxaliplatin/5-Fluorouracil/Leucovorinin the Adjuvant Treatment of Colon Cancer (MOSAIC) trial similarly demonstrated no benefit for adjuvant therapy in stage II disease ( 37 ). The 2010 update of NCCN (National Comprehensive Cancer Network) guidelines for stage II colon cancer also did not recognize CEA as a criterion for adjuvant therapy ( 32 ).
We contend that there is heterogeneity in biological aggressiveness and prognosis in stage II colon cancers that may be identifiable by C-stage. Hence, the findings and recommendations on adjuvant therapy for high-risk colon cancer (or stage II colon cancer in general) may need to be considered in light of the understanding that preoperative serum CEA (or C-stage) has not been used in staging or addressed in the risk stratification of patients in the above studies. There is yet no direct biological evidence to suggest that CEA may serve to identify response to chemotherapy (ie, “predictive” factor). The potential utility of adjuvant therapy in this population requires prospective testing. Other biological parameters also need to be considered in future trials in this population, including microsatellite instability (MSI) status and, perhaps, gene expression signatures.
It is unclear from our study if stage IIIA C0 patients have an excellent prognosis by virtue of their biological aggressiveness (C-stage) or treatment (adjuvant therapy). However, because we observed that hazards for mortality differ more by virtue of their CEA status than by their nodal status (with the clear exception of stage N2b), we recommend that the efficacy of less chemotherapy be studied in stage IIIA C0 patients. The apparent absence of such an association between C-stage and stage N2b can be explained by the wide heterogeneity of the definition of N2b (seven or more positive nodes) ( 4 ), which may also explain the lack of stage migration in N2b-associated stages, IIIB and IIIC.
Our study has a few important limitations. The relatively smaller sample size in certain stages after the incorporation of C-stage and the relatively short follow-up period (median 27 months) could be a potential limitation that may explain lack of prognostic differences between certain anatomical stages. Anatomical staging may be less important because some stages receive adjuvant therapy more often than others or do not receive it at all. Not all patients diagnosed with CRC in the United States had a pretreatment serum CEA test, thereby limiting the sample size. Our study also showed that the availability of a preoperative serum CEA level was associated with favorable prognosis. However, these results need to be confirmed by future studies with longer follow-up periods. Specific details on who received adjuvant therapy and the exact regimens for such therapy are unavailable; hence, our suggestions are merely retrospective speculations from assumed prevalent trends of adjuvant therapy in the United States. Heavy smoking and other factors such as liver disease that may elevate CEA level are unavailable in the database. Although identifying one uniform cutoff level for a positive CEA has several inherent limitations (and physician- and lab-guided interpretation is the best we currently have), the lack of such standardization could also be a potential limitation. Data on MSI were also unavailable in SEER database; however, it is unlikely that patients with high MSI, a good prognostic factor, and C0-stage, are completely overlapping populations, as their distributions in the colon cancer population seem to be different ( 38 ).
It is important to recognize that our study is a relatively early analysis of the SEER database, based on short follow-up of patients diagnosed in 2004. More studies in the future from this database with longer follow-up will be needed to confirm C-stage validation, stage migration, and specific patterns of prognosis for each substage. Studies on the prevalence of CEA in the colon cancer population and its correlation with other factors would also be needed.
In conclusion, based on the observations made in our study, we strongly recommend routine preoperative CEA testing in all colon cancer patients, and inclusion of C-stage in the current AJCC staging. C-stage appears to demonstrate migration in TNM-derived early prognosis. We recommend inclusion of pretreatment serum CEA level for risk stratification in CRC in all current and future adjuvant therapy trials, irrespective of the AJCC stage.
Funding
None.
References
P. Thirunavukarasu and S. Sukumar contributed equally to this work.
The authors are solely responsible for the design of the study, the analysis and interpretation of the data, the writing of the manuscript, and the decision to submit the manuscript for publication.

