


Abstract
Background: High intake of soy foods has been proposed to contribute to the low breast cancer risk in Asian countries. However, results of epidemiologic studies of this association are highly variable, and experimental data suggest that soy constituents can be estrogenic and potentially risk enhancing. Thus, rigorous evaluation of available epidemiologic data is necessary before appropriate recommendations can be made, especially for women at high risk of breast cancer or those who have survived the disease. Methods: We performed a meta-analysis of 18 epidemiologic studies (12 case–control and six cohort or nested case–control) published from 1978 through 2004 that examined soy exposure and breast cancer risk. Pooled relative risk estimates were based on either the original soy exposure measure defined in each study or on an estimate of daily soy protein intake. Results: Risk estimates, levels and measures of soy exposure, and control for confounding factors varied considerably across studies. In a pooled analysis, among all women, high soy intake was modestly associated with reduced breast cancer risk (odds ratio [OR] = 0.86, 95% confidence interval [CI] = 0.75 to 0.99); the association was not statistically significant among women in Asian countries (OR = 0.89, 95% CI = 0.71 to 1.12). Among the 10 studies that stratified by menopausal status the inverse association between soy exposure and breast cancer risk was somewhat stronger in premenopausal women (OR = 0.70, 95% CI = 0.58 to 0.85) than in postmenopausal women (OR = 0.77, 95% CI = 0.60 to 0.98); however, eight studies did not provide menopause-specific results, six of which did not support an association. When exposure was analyzed by soy protein intake in grams per day, a statistically significant association with breast cancer risk was seen only among premenopausal women (OR = 0.94, 95% CI = 0.92 to 0.97). Conclusions: Soy intake may be associated with a small reduction in breast cancer risk. However, this result should be interpreted with caution due to potential exposure misclassification, confounding, and lack of a dose response. Given these caveats and results of some experimental studies that suggest adverse effects from soy constituents, recommendations for high-dose isoflavone supplementation to prevent breast cancer or prevent its recurrence are premature.
The online version of this article has been published under an Open Access model. Users are entitled to use, reproduce, disseminate, or display the Open Access version of this article for non-commercial purposes provided that: the original authorship is properly and fully attributed; the Journal and Oxford University Press are attributed as the original place of publication with the correct citation details given; if an article is subsequently reproduced or disseminated not in its entirety but only in part or as a derivative work this must be clearly indicated. For commercial re-use, please contact: journals.permissions@oxfordjournals.org .
Breast cancer rates among women in Asian countries have long been noted to be substantially lower than those among women in Western nations ( 1 ) but rapidly increase in Asian women following emigration to the United States ( 2 ) . Because changes in cancer risk following emigration are thought to reflect lifestyle changes, particularly in dietary patterns, these observations have led to a search for protective factors in the Asian diet. Soy-based foods have long been a staple of Asian diets; before 1998 these foods were consumed regularly by only approximately 5% of women in the United States ( 3 , 4 ) . However, this figure is rapidly changing. In the year 2000, greater than 25% of individuals living in the United States reported using soy products at least once per week ( 5 ) , perhaps reflecting the potential of these foods to reduce the risk of cardiovascular disease ( 6 ) and the hypothesis that high soy protein intake contributes to low breast cancer incidence among Asian women ( 7 ) . Furthermore, soy products are increasingly being used as food additives and meat substitutes in the U.S. market.
Soybeans contain large amounts of the isoflavones genistin and daidzin, which are metabolized to genistein and daidzein ( 8 , 9 ) . Genistein has many biologic effects that could potentially reduce breast cancer risk, including the inhibition of epidermal growth factor receptor tyrosine kinase activity, and inhibition of topoisomerase II activity. It also arrests cell cycle progression at the G 2 –M transition, induces apoptosis, has antioxidant properties, modifies eicosanoid metabolism, and inhibits angiogenesis ( 10 , 11 ) . Although each of these actions of genistein could have anticancer effects on the breast, many occur at pharmacologic concentrations (30–185 μM) rather than at the lower concentrations that would result from dietary exposures.
At concentrations within the range achievable from dietary soy exposures (<4 μM in the blood) ( 12 ) , genistein exhibits estrogenic properties, some of which could theoretically enhance breast cancer risk. Such effects include activation of the estrogen receptor (ER)-α ( 13 – 16 ) , enhanced proliferation of human breast cancer xenografts ( 17 ) and normal mammary epithelial cells of women ( 13 , 18 – 20 ) and of rodents ( 21 ) , and inhibition of the antiproliferative effects of the antiestrogen tamoxifen in human breast cancer cells growing in vitro and as xenografts in ovariectomized nude mice ( 22 , 23 ) . However, physiologic doses of genistein also exhibit potential anticarcinogenesis activities, such as induction of mammary epithelial cell differentiation ( 24 ) and activation of ER-β, a protein with proapoptotic properties ( 16 ) . Daidzein, the other key phytoestrogen in soy, enhances tamoxifen efficacy at physiologic levels in a rat model ( 23 ) . Studies of breast density, a strong risk factor for breast cancer, have shown both direct ( 25 ) and inverse ( 26 ) associations with soy exposure. In a recent study ( 27 ) , premenopausal women were randomly assigned to 1-year supplementation with isoflavone or placebo and did not show changes in mammographic density, which suggests that if soy intake is associated with breast density, it is probably with long-term or early-life exposure.
Animal studies have generated conflicting data regarding the ability of genistein or soy to reduce mammary tumorigenesis. In general, dietary genistein exposure beginning when animals are exposed to a carcinogen or when the tumors are palpable does not reduce mammary tumor incidence or multiplicity, regardless of the level of exposure, but may increase tumor latency ( 28 – 32 ) . Some investigators have reported that genistein reduces growth of tumors that arise from inoculated human or mouse breast cancer cells in premenopausal mouse models ( 33 , 34 ) , and others have reported that, in ovariectomized rat or mouse models of postmenopause, dietary genistein can promote both carcinogen-induced estrogen-dependent mammary tumorigenesis and growth of ER-positive human breast cancer xenografts ( 35 , 36 ) . Furthermore, prepubertal or pubertal exposure to genistein that is administered either via injections or feed has consistently been found to reduce the incidence and/or multiplicity of subsequent carcinogen-induced, estrogen-dependent mammary tumors ( 37 – 39 ) .
Relatively few studies have been reported of soy intake and risk of breast cancer in women, and the methods and results of these studies have been variable. Despite the complexity of these data, high-dose supplements such as soy protein isolates or isoflavone capsules are being recommended and directly marketed to healthy women to prevent breast cancer or to reduce menopausal symptoms and to breast cancer survivors to prevent recurrence. Because in vivo and in vitro data show risk-enhancing as well as risk-reducing effects of genistein and soy, it is important that associations between soy and breast cancer risk be rigorously evaluated before recommendations can safely be made, especially for women who already have breast cancer. Therefore, we conducted a meta-analysis to explore in detail the epidemiologic evidence relating consumption of soy foods to risk of breast cancer.
M ETHODS
Literature Review for Meta-Analysis
A search of MEDLINE, EMBASE, and BIOSIS was conducted using the following terms: genistein, daidzein, soy, tofu, miso, natto, soybeans, diet, isoflavones, or phytoestrogens, and breast cancer. Each term also was searched alone without the breast cancer term. The search was conducted through December 31, 2004. In addition, each reference that was obtained was reviewed for citations to articles that may have been missed in the search of the publication databases. An attempt was made to obtain unpublished data, additional references, and information through an Internet search of soy, and phytoestrogens or isoflavones.
Classification of Soy Intake
Analyses were based on two related classifications of soy intake. First, we used the original measure of soy intake from each study (regular tofu, fried tofu, soy protein, soy foods, dietary isoflavone intake, or urinary isoflavone excretion) and examined risk associated with the largest difference in exposure between case patients and control subjects. However, both the measures used to quantify soy intake and the levels of soy intake varied considerably across studies. To permit comparison of exposure across studies using a common measure, we converted soy or isoflavone exposure in each study to an estimate of grams of soy protein consumed daily.
To convert the frequency of tofu intake to an estimate of soy protein we considered the soy protein composition of tofu, typical serving size, and the fraction of soy food in the diet contributed by tofu. Regular tofu (100 g) contains 8.08 or 6.8 g of soy protein in Western ( 40 ) and Asian countries ( 41 ) , respectively, and fried tofu contains 17.19 g ( 40 ) . In Western countries, a typical tofu serving size is 3.5 ounces (98 g) ( 40 ) , compared with 33 g in Japan ( 42 ) . We did not have data from China for fried tofu but used the value from the Japan survey (4 g/serving) because daily soy protein intakes for both countries were similar. Regular tofu accounts for 42% of soy food intake in Japan ( 43 ) , whereas in China, fried tofu accounts for 8.5% of total soy protein intake ( 44 ) . Based on a recent evaluation of dietary isoflavone intake, we assumed that tofu accounted for 20% of soy protein intake among non-Asian women, with the remainder coming from additives in baked goods and other foods ( 45 ) . Although use of soy foods in Western countries is currently increasing, subjects in the studies included here were evaluated in 1994 or earlier, when use of soy foods was less widespread. Thus, total daily soy protein intake was estimated from tofu intake as follows: SP = FT × ST × SPT × (1/PST), in which SP = total daily soy protein intake (grams per day), FT = daily frequency of tofu consumption (servings per day), ST = tofu serving size (grams), SPT = soy protein composition of tofu (grams per 100 g of tofu), and PST = proportion of total soy consumption attributed to tofu.
To convert estimated dietary intake of total isoflavones ( 50 – 54 ) to estimates of soy protein intake, we used data from studies of healthy women in the United States ( 55 ) and in Japan ( 56 ) to derive a ratio of 346 mg of soy protein per mg of isoflavone (United States) or 301 mg of soy protein per mg of isoflavone (Japan). For all studies in which the highest and lowest soy exposure categories included were open-ended, we estimated the midpoint of the lowest and highest quantiles if actual distribution data were not available in the report. We defined the lowest quantile as zero to the low quantile cutpoint reported in the study. For the highest quantile, we defined its range to be the same width as that of the second highest quantile reported in the study. Midpoints of these low and high ranges were used to convert differences in soy food intake to soy protein.
Statistical Methods
For each study, we extracted the odds ratio (OR i ) and 95% confidence interval (CI) for the comparison of the highest versus lowest soy exposure groups. To convert odds ratios based on differences between high and low exposure (Δ i ) to the log odds ratio per unit change (β i ), we used β i = log(OR i )/Δ i . If not specifically provided, the standard error (SE i ) for the logarithm of the OR i (L i ) was estimated as (L iU − L iL )/3.92, in which L iU and L iL are the respective upper and lower bounds of the confidence interval for L i ; the SE i was squared to estimate the variance of L i ( 57 ) . A test for homogeneity across studies was applied before the OR i s were pooled. If homogeneity was not rejected, the method of Woolf ( 58 ) was used to obtain a pooled estimate of the OR i , obtained as a weighted average of the L i , with each weight ( wi ) equal to the inverse variance of L i . Variance of the pooled estimate, L P , obtained as the inverse of the sum of the weights, was used to calculate the confidence interval ( 58 ) . If homogeneity of OR i was rejected, a random-effects model was used to obtain a pooled estimate ( 59 ) . In this model, we estimated a random-effects variance component (ν) that was added to the variance of each individual L i , and these composite variances were used for the weights. Analyses were conducted for all women combined, women in Asia, and all women stratified by menopausal status. These categories were chosen as potential stratification factors because of a priori hypotheses that they might modify the effects of soy foods on breast cancer risk.
We used odds ratio estimates that were adjusted for multiple potential confounding factors whenever such odds ratios were available. To test the impact of adjustment on the association between soy and breast cancer risk, we compared pooled log odds ratios from studies that did adjust for potential confounding factors (L PA ) and those from studies that did not (L PC ); these analyses also incorporated the random-effects variance. The relative impact of adjustment (the “confounding odds ratio”) is provided by the ratio of the pooled odds ratios from adjusted studies to the pooled odds ratios from the unadjusted studies, estimated as exp(L PA − L PC ) ( 57 ) . The confounding odds ratio was also used to compare subgroups of studies with different design or study population characteristics, e.g., to compare results based on cohort studies with those based on case–control studies.
If the confounding factor was a continuous variable, we examined whether there was a statistically significant linear trend by performing a weighted linear regression of the study-specific logarithm of the OR i (L i ) on the confounding factor ( zi ). In this meta-regression approach, the weights ( wi ) are the same as those used to derive the pooled odds ratio, i.e., the study-specific inverse variance of the L i . The regression parameter (change in the log odds ratio per unit change in the confounding variable) can be estimated directly from the data as b = c / v , in which c = Σ w L z /Σ w − L z is the weighted covariance of the L i and zi , v = Σ wz2 /Σ w − z2 is the weighted variance of the zi , and L and z are the weighted averages of the L i and zi , respectively ( 57 ) .
Sensitivity analyses were performed by varying the assumptions used to calculate the exposure levels or by deleting studies based on factors associated with study quality or weight and then evaluating the impact of the changes on the pooled odds ratios. We examined the evidence for publication bias graphically using a funnel plot and quantitatively using a weighted linear regression of the logarithm of the odds ratios on their standard errors, weighted by the inverse variance; two-sided P values for the regression parameters were determined using Wald statistics ( 60 ) .
R ESULTS
Twenty-three articles published from 1978 through December 31, 2004, were identified for review ( 3 , 46 , 47 , 50 – 54 , 61 – 75 ) . One study ( 68 ) was excluded because it was based on soy intake in the husbands of breast cancer patients; one study was excluded ( 75 ) because it only had 18 case patients and 20 control subjects. A third study ( 67 ) was excluded because it did not test for an association between soy consumption and risk of breast cancer. Two studies ( 3 , 66 ) that were reported only as published abstracts were included in the analyses because of the relatively small number of studies available. Four manuscripts reported on the same study. Two of these used smaller subsets of the main case–control study and were not included in the analysis ( 69 , 74 ) and two reported on the entire study ( 71 , 72 ) . Of the latter two, one report was based on usual adult dietary intake of soy protein that was derived from a food frequency questionnaire with a comprehensive list of soy foods and provided estimates of risk for all women combined ( 71 ) . The second report was based on soy protein intake during adolescence derived from an abbreviated questionnaire that included tofu, soymilk, and a category for “other” soy foods and provided estimates of premenopausal and postmenopausal breast cancer risk ( 72 ) . We included the data from Dai et al. ( 71 ) in the pooled estimates of risk for all women because of the more comprehensive dietary assessment. The data from Shu et al. ( 72 ) were included in pooled estimates of premenopausal and postmenopausal risk. The report by Yuan et al. ( 62 ) describes two case–control analyses, one performed in Shanghai and the other in Tianjin, China. Each analysis used different case patients and control subjects, and they were thus treated as two separate studies in our meta-analysis. Thus, a total of 18 individual studies (described in 17 manuscripts) were included in the meta-analysis.
Of the 18 studies, 12 were case–control studies and six were cohort studies or case–control studies nested in a prospective cohort ( Table 1 ; Supplementary Table 1, available at http://jncicancerspectrum.oxfordjournals.org/jnci/content/vol98/issue7 ). Six studies used frequency of tofu (or soybean curd) consumption as the measure of soy intake ( 3 , 63 – 66 , 70 ) , three used estimated soy protein intake ( 61 , 62 , 71 ) , two used urinary excretion of isoflavones ( 46 , 47 ) , four used estimated total or individual isoflavone intake ( 50 , 52 – 54 ) , one used both urinary and dietary isoflavones ( 73 ) , and one used both tofu intake during adolescence and isoflavone intake during adulthood ( 51 ) .
Studies of soy and breast cancer risk used in meta-analysis
| Study (reference) | Design | Population * | OR (95% CI) or RR (95% CI) † | Measure of soy intake (exposure differences) | Adjustment factors, comments |
|---|---|---|---|---|---|
| Lee et al., 1992 ( 61 ) | Hospital-based case–control | Premenopausal (109/207) | 0.4 (0.2 to 0.8) | Soy protein (≥3.5 vs. <1.6 g/day) | Premenopausal: age, age at first birth. |
| Postmenopausal (91/213) | 1.8 (0.8 to 3.6) | Postmenopausal: age, nulliparity, height, education, family history. | |||
| Hirose et al., 1995 ( 63 ) | Hospital-based case–control | Premenopausal (606/2275) | 0.78 (0.60 to 1.0) | Bean curd (≥3 times/wk vs. ≤3 times/mo) | Age and year of first visit to clinic. |
| Postmenopausal (443/6186) | 0.96 (0.70 to 1.31) | Adjustment for other breast cancer risk factors and dietary factors was done only for high vs. not high intake, with minimal impact: ratio of adjusted to crude OR was 0.96 and 1.08 for premenopausal and postmenopausal, respectively. | |||
| Yuan et al., 1995 ( 62 ) | Population-based case–control | Shanghai (534/534) | 0.9 (0.6 to 1.3) | Soy protein (95th vs. 5th percentile) | Age, age of menarche, parity, duration of lactation, age at first use of oral contraceptives, benign breast disease, family history, energy, education and (only in Shanghai) cycle length, weight. |
| Tianjin (300/300) | 1.4 (0.7 to 3.0) | ||||
| Wu et al., 1996 ( 65 ) | Population-based case–control | All women (596/958) | 0.66 (0.50 to 0.88) | Tofu (≥55 times/y vs. ≤12 times/y) | Not adjusted (CIs not provided for adjusted values). Minimal effects of adjustment: ratios of adjusted to crude OR were 1.02, 1.05, and 0.96 for all women, premenopausal and postmenopausal, respectively. |
| Premenopausal (421/656) | 0.64 (0.46 to 0.90) | ||||
| Postmenopausal age ≤55 (170/295) | 0.73 (0.43 to 1.24) | ||||
| Greenstein et al., 1996 ( 3 ) | Cohort | Postmenopausal (1018/34 388) | 0.76 (0.50 to 1.18) | Soy or tofu (consumers vs. nonconsumers) | “Major breast cancer risk factors” (not specified). Only 3% of cohort consumed any soy foods. |
| Ingram et al., 1997 ( 46 ) | Population-based case–control | All women (144/144) | 0.47 (0.17 to 1.33) | Urinary daidzein (>1300 vs. ≤600 nmol/day) | Age at menarche, alcohol, total fat intake. Matched on age, area of residence. |
| Witte et al., 1997 ( 64 ) | Case–control (unaffected sisters of patients) | Premenopausal (140/222) | 0.5 (0.2 to 1.1) | Tofu or soybean (1 time/week vs. none) | Age, age at menarche, parity, alcohol, oral contraceptives, BMI, energy. Prevalent and incident cases with bilateral breast cancer. Only 5% of subjects consumed any soy foods. |
| Chie et al., 1997 ( 66 ) | Hospital-based case–control | All women (175/571) | 2.0 (0.9 to 4.3) | Tofu (fried) (1 time/week vs. none) | Education, BMI, age at menarche, age at first full-term pregnancy, age at menopause, parity, lactation, family history, caloric intake. Age matched. |
| Key et al., 1999 ( 70 ) | Cohort | All women (427/489 989) | 1.07 (0.78 to 1.47) | Tofu (≥5 times/week vs. ≤1 time/week) | Age, calendar period, city, and age at time of atom bombs, estimated radiation dose. |
| Premenopausal (not stated) | 1.16 (0.56 to 2.38) | ||||
| Postmenopausal (not stated) | 1.05 (0.73 to 1.49) | ||||
| Dai et al., 2001 ( 71 ) | Population-based case–control | All women (1459/1556) | 0.66 (0.46 to 1.02) | Soy protein (4th vs. 1st quartile) | Age, family history, breast fibroadenoma, waist-to-hip ratio, age at menarche, age at first birth, age at menopause, menopausal status, physical activity, parity, intake of meats and fish, and total energy. |
| Shu et al., 2001 ( 72 ) | Premenopausal (952/990) | 0.53 (0.39 to 0.72) | Soy protein (5th vs. 1st quintile) | ||
| Postmenopausal (501/562) | 0.49 (0.33 to 0.74) | Soy protein (5th vs. 1st quintile) | |||
| Horn-Ross et al., 2001 ( 50 ) | Population-based case–control | All women (1272/1610) | 1.00 (0.79 to 1.30) | Total isoflavones (4th vs. 1st quartile) | Age, ethnicity, age at menarche, parity, lactation, benign breast disease, family history, education, composite of menopausal status, BMI and hormone replacement, caloric intake. |
| Premenopausal (398/471) | 1.20 (0.75 to 2.00) | ||||
| Postmenopausal (826/1077) | 0.96 (0.71 to 1.30) | ||||
| den Tonkelaar et al., 2001 ( 47 ) | Nested case–control | Postmenopausal (88/268) | 0.83 (0.46 to 1.51) | Urinary genistein (3rd vs. 1st tertile) | Crude OR. Adjustment for age, height, weight, parity, age at menopause, benign breast disease, family history, estrogen replacement, smoking did not change OR (<10% change). |
| 4th vs. 1st quartile: | |||||
| Wu et al., 2002 ( 51 ) ‡ | Population-based case–control | All women (501/594) | 0.61 (0.39 to 0.97) | Adult isoflavone intake | Birthplace, education, age at menarche, parity, current BMI, menopausal status, use of replacement hormones, energy, dark green leafy vegetables, smoking, alcohol, physical activity, family history. Matched on age, ethnicity. |
| 0.65 (0.38 to 1.10) | Adolescent tofu intake | ||||
| Premenopausal (208/289) | 0.60 (0.30 to 1.19) | Adult isoflavone intake | |||
| 0.64 (0.29 to 1.42) | Adolescent tofu intake | ||||
| Postmenopausal (283/304) | 0.39 (0.21 to 0.70) | Adult isoflavone intake | |||
| 0.41 (0.21 to 0.81) | Adolescent tofu intake | ||||
| Horn-Ross et al., 2002 ( 53 ) | Cohort | All women (711/222 249) | 1.0 (0.7 to 1.3) | Genistein intake (5th vs. 1st quintile) | Age, race, caloric intake, family history, age at menarche, age at first birth, parity, physical activity, interaction between menopausal status and BMI. |
| Yamamoto et al., 2003 ( 52 ) | Cohort | All women (179/209 354) | 0.46 (0.25 to 0.84) | Isoflavone intake (4th vs. 1st quartile) | Age, age at menarche, age at first pregnancy, parity, menopausal status, smoking, alcohol, physical activity, education, energy, consumption of meat, fish, vegetables, and fruit. |
| Premenopausal (89/93 628) | 0.66 (0.25 to 1.70) | ||||
| Postmenopausal (87/111 637) | 0.32 (0.14 to 0.71) | ||||
| Linseisen et al., 2004 ( 54 ) | Population-based case–control | Premenopausal (278/666) | 0.85 (0.54 to 1.33) | Isoflavone intake (4th vs. 1st quartile) | Family history, parity, lactation, energy, BMI, alcohol, education. Matched on age, study region. |
| 0.47 (0.29 to 0.74) | Genistein intake (4th vs. 1st quartile) | ||||
| 0.62 (0.40 to 0.95) | Daidzein intake (4th vs. 1st quartile) | ||||
| Grace et al., 2004 ( 73 ) | Nested case–control | All women (111/217) | 1.16 (0.97 to 1.39) | Urinary genistein (twofold increase) | BMI, menopausal status, parity, hormone replacement therapy, smoking, family history, saturated fat intake. Matched on age, recruitment date. |
| 1.12 (0.96 to 1.31) | Urinary daidzein (twofold increase) | ||||
| 1.17 (0.94 to 1.45) | Dietary genistein (twofold increase) | ||||
| 1.18 (0.93 to 1.48) | Dietary daidzein (twofold increase) |
Parentheses represent (No. of case patients/No. of control subjects) for case–control studies or (No. of case patients/No. of person-years) for cohort studies, except for Greenstein et al. ( 3 ) , in which parentheses represent (No. of case patients/No. of women at baseline). BMI = body mass index, kg/m 2 .
OR = odds ratio; RR = relative risk; CI = confidence interval.
For premenopausal and postmenopausal populations, 95% CIs for adult isoflavone intake were provided by Dr. Wu (personal communication), whereas those for adolescent tofu intake were estimated.
For many of the studies, no statistically significant association between soy intake and risk of breast cancer was observed ( Fig. 1 ; Supplementary Table 1, available at http://jncicancerspectrum.oxfordjournals.org/jnci/content/vol98/issue7 ). Two of the studies ( 61 , 63 ) gave results stratified by menopausal status but did not give the combined results, so the stratified results are shown ( Fig. 1 ; Supplementary Table 1, available at http://jncicancerspectrum.oxfordjournals.org/jnci/content/vol98/issue7 ). Among subgroups that were of prior interest, the studies of premenopausal women appeared to exhibit a more consistent inverse association between soy intake and breast cancer risk than the Asian studies ( Fig. 2 ). When the data from all studies were pooled ( Table 2 ; Supplementary Table 1, available at http://jncicancerspectrum.oxfordjournals.org/jnci/content/vol98/issue7 ), there was substantial heterogeneity, and this heterogeneity remained within strata of Asian studies and studies of postmenopausal women, but not among studies of premenopausal women. Overall, the association between soy intake and risk of breast cancer was small but statistically significant (OR = 0.86, 95% CI = 0.75 to 0.99). Inverse associations between soy intake and breast cancer risk were somewhat stronger among premenopausal women (OR = 0.70, 95% CI = 0.58 to 0.85) than among postmenopausal women (OR = 0.77, 95% CI = 0.60 to 0.98). However, pooled menopause-specific results may be spuriously low—these results omit eight studies that did not provide results stratified by menopausal status, and six of the eight studies did not show an inverse association ( 3 , 46 , 47 , 53 , 54 , 62 , 64 , 66 , 73 ) . The relationship between soy intake and breast cancer risk was similar among women in Western countries but not statistically significant [including two studies of Asian Americans ( 51 , 65 ) ] with OR = 0.84 (95% CI = 0.70 to 1.00) and was slightly weaker among women in Asian countries (OR = 0.89, 95% CI = 0.71 to 1.12); these two odds ratios did not differ ( P = .70). However, if the two studies conducted among Asian Americans are included with the studies of women in Asian countries, the odds ratio was similar to that of all women combined but not statistically significant (OR = 0.83, 95% CI = 0.68 to 1.02). Exclusion of the two studies that were reported as abstracts only ( 3 , 66 ) did not change the above results (data not shown).
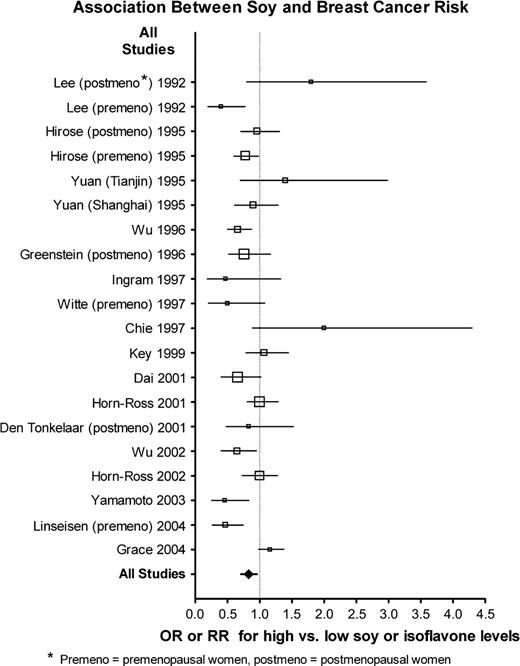
Association between soy exposure and breast cancer risk in all studies in this meta-analysis. Relative sample sizes are indicated by size of symbols, with increasingly large symbols representing studies with 200 case patients or fewer, 201–400 case patients, 401–600 case patients, 601–1000 case patients, and more than 1000 case patients. Horizontal lines represent 95% confidence intervals for the odds ratios. OR = odds ratio; RR = relative risk; premeno = premenopausal women, postmeno = postmenopausal women.
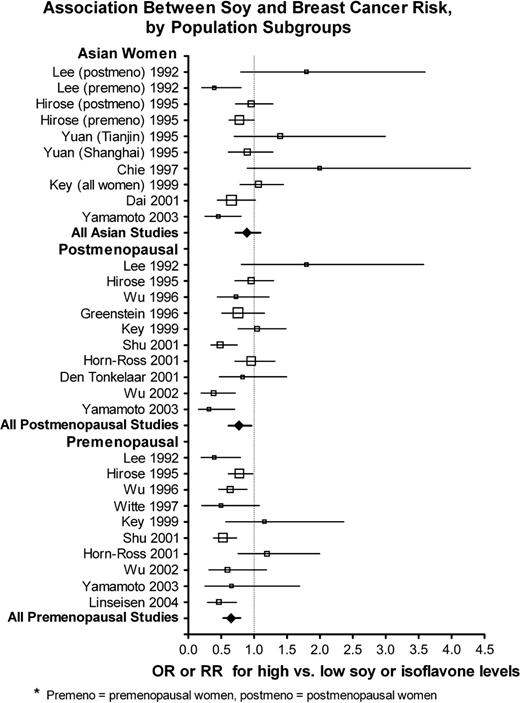
Association between soy exposure and breast cancer risk, by population subgroups. Relative sample sizes are indicated by size of symbols, with increasingly large symbols representing studies with 200 case patients or fewer, 201–400 case patients, 401–600 case patients, 601–1000 case patients, and more than 1000 case patients. Horizontal lines represent 95% confidence intervals for the odds ratios. OR = odds ratio; RR = relative risk; premeno = premenopausal women, postmeno = postmenopausal women.
Pooled odds ratios (ORs) and 95% confidence intervals (CIs) for breast cancer risk associated with high versus low soy intake, as defined in each original study, by study population
| No. of studies (case patients) | Heterogeneity of ORs | |||||
|---|---|---|---|---|---|---|
| Group | χ 2 (df) * | P† | OR (95% CI) | Model used | ||
| All women | 18 (9182) | 41.06 (19) | .002 | 0.86 (0.75 to 0.99) | Random | |
| Asian | 8 (4323) | 23.72 (9) | .005 | 0.89 (0.71 to 1.12) | Random | |
| Premenopausal | 10 (3351) ‡ | 14.41 (9) | .108 | 0.70 (0.58 to 0.85) | Fixed | |
| Postmenopausal | 10 (3784) ‡ | 26.72 (9) | .002 | 0.77 (0.60 to 0.98) | Random | |
Degrees of freedom (df) does not equal N − 1 because studies that provided separate values for premenopausal and postmenopausal women contributed 2 df, and the report by Yuan et al. ( 62 ) of two geographically distinct case–control studies also contributed 2 df.
P values (two-sided) were based on the chi-square test of heterogeneity ( 58 ) .
‡The study by Key et al. ( 70 ) did not provide numbers of cases by menopausal status but did give numbers by age group. For this table, the Key et al. study contributed 150 case patients aged ≤54 years (“premenopausal”) and 277 aged ≥55 years = (“postmenopausal”).
Most studies adjusted their analyses for some breast cancer risk factors, but the effect of adjustment was relatively minor. In the 11 studies in which both crude and adjusted estimates could be compared ( 46 , 50 – 52 , 54 , 61 , 63 , 65 , 70 , 71 , 73 ) , the odds ratios were reduced by adjustment as frequently as they were increased. To evaluate the potential impact on heterogeneity of adjustment for confounding factors or of comparing studies stratified on the basis of a study design or population subgroup, we compared the pooled odds ratios from studies that adjusted for or exhibited a particular factor with that of studies that did not adjust for or did not exhibit the factor. The ratio of these two pooled odds ratios can be considered as a “confounding odds ratio,” OR C (and 95% confidence interval). If OR C >1, it indicates that studies that adjusted for a confounding factor (or represented a particular stratum) exhibited larger odds ratios than studies that did not adjust; i.e., the inverse association is diminished by adjustment. Conversely, if OR C <1, adjustment (or the particular factor) is associated with smaller odds ratios than those that did not adjust; i.e., the inverse association is strengthened by adjustment.
When the pooled odds ratios from studies that adjusted for a confounding factor were compared with those of studies that did not (or when studies across two different strata were compared), body mass index (BMI) was the only factor that resulted in a statistically significant difference (BMI-adjusted studies, OR = 0.99 versus unadjusted studies OR = 0.74, yielding a confounding odds ratio OR C = 1.34, 95% CI = 1.04 to 1.72; P = .022, Table 3 ; Supplementary Table 1, available at http://jncicancerspectrum.oxfordjournals.org/jnci/content/vol98/issue7 ). In other words, studies that adjusted for BMI had 34% larger odds ratios (suggesting a weaker inverse association), on average, than studies that did not adjust. Cohort or nested case–control studies also exhibited somewhat larger pooled odds ratios (OR = 0.93) than retrospective case–control studies (OR = 0.83), resulting in OR C = 1.12, but this difference was not statistically significant.
Comparison of association of soy intake and breast cancer risk among studies that adjusted versus those that did not adjust for a confounding factor (or comparison between subgroups of studies with different values for a design factor)
| Comparison groups (no. of studies) | ||||
|---|---|---|---|---|
| Adjusted or numerator stratum | Unadjusted or denominator stratum | Comparison OR C (95% CI) * | P† | |
| Cohort or nested case–control studies (6) | Retrospective case–control studies (12) | 1.12 (0.84 to 1.49) | .434 | |
| Population-based case–control studies (8) | Hospital or sister control case–control studies (4) ‡ | 0.89 (0.59 to 1.35) | .584 | |
| Asian studies (8) | Western studies (10) § | 1.06 (0.79 to 1.42) | .699 | |
| Postmenopausal (10) | Premenopausal (10) ∥ | 1.09 (0.80 to 1.50) | .345 | |
| Soy protein /isoflavones ¶ (12) | Tofu (6) | 1.00 (0.76 to 1.33) | .978 | |
| Soy protein/tofu (10) | Isoflavones (8) | 1.00 (0.75 to 1.32) | .974 | |
| BMI adjusted (9) | BMI not adjusted (9) | 1.34 (1.04 to 1.72) | .022 | |
| Energy adjusted (10) | Energy not adjusted (8) | 0.98 (0.73 to 1.31) | .887 | |
| Other dietary factors adjusted (6) | Other dietary factors not adjusted (12) | 0.85 (0.63 to 1.16) | .304 | |
For a binary confounding factor, the confounding odds ratio (OR C ) is the ratio of the pooled odds ratio for studies that did adjust for the specific confounding factor versus the pooled odds ratio for studies that did not adjust. For two separate subgroups of studies such as different study design or population groups, OR C is the ratio of the pooled odds ratio for studies comprising one subgroup (numerator) versus the pooled odds ratio for the studies comprising the other subgroup (denominator). OR C >1 implies that studies that adjusted for the factor (or studies that comprise the numerator subgroup) exhibited a weaker protective association than studies that did not adjust (or studies that comprise the denominator subgroup). Conversely, OR C <1 implies that studies that adjusted for the confounding factor (or numerator subgroup) is associated with stronger protective associations. Odds ratios were pooled within strata using a random-effects model. BMI = body mass index, kg/m 2 . CI = confidence interval.
P values (two-sided) were calculated using the z -statistic ( 57 ) .
This comparison includes only the 12 case–control studies.
Some studies included estimates of the effect in both premenopausal and postmenopausal women, so the total estimates for both groups exceed the number of studies.
Isoflavones includes exposure measured by dietary isoflavone intake, dietary genistein intake, or urinary isoflavone excretion.
Finally, we explored possible associations between publication year and either the odds ratio or study weight. Weighted meta-regression revealed no association between year of publication and the log odds ratio ( b = .016, P = .14) or the study weight ( b = 2.51, P = .14) (unweighted analysis). There was also no association between the year enrollment began and the odds ratio or the study weight (data not shown).
There was great variability among the studies in the definitions of high and low exposure ( Table 1 ; Supplementary Table 1, available at http://jncicancerspectrum.oxfordjournals.org/jnci/content/vol98/issue7 ). For example, in some studies ( 64 – 66 ) high exposure was defined as consumption of tofu one or more times per week, whereas in two studies ( 62 ) the difference in intake between the high and low exposure categories was 18 g of soy protein/day. In an attempt to normalize this variability, we converted each comparison of high versus low soy exposure into an estimate of the corresponding grams of soy protein per day and then derived the odds ratio per gram of soy protein per day ( Table 4 ; Supplementary Table 2, available at http://jncicancerspectrum.oxfordjournals.org/jnci/content/vol98/issue7 ). Some studies with similar differences between high and low soy protein intake resulted in similar risk levels per gram of soy protein, e.g., the studies by Wu et al. ( 65 ) and Witte et al. ( 64 ) , whereas others yielded very different risk levels, e.g., the studies by Linseisen et al. ( 54 ) and Grace et al. ( 73 ) . It is notable that the four lowest odds ratio estimates came from studies in Western countries ( 3 , 54 , 64 , 65 ) . The pooled values for all studies, studies of Asian women, or studies stratified by menopausal status suggest fairly similar odds ratio estimates of 0.94–0.98 per gram of soy protein per day ( Table 5 ; Supplementary Table 2, available at http://jncicancerspectrum.oxfordjournals.org/jnci/content/vol98/issue7 ). To assess the validity of our method for converting exposure to soy protein, we examined the risk per gram of soy protein daily among the four studies for which we did not need to impose additional assumptions because they had originally measured daily intake of soy protein ( 61 , 62 , 71 ) . These studies suggested an association similar to that observed with the estimate of soy protein intake (pooled OR = 0.99, 95% CI = 0.98 to 1.00, Table 5 ; Supplementary Table 2, available at http://jncicancerspectrum.oxfordjournals.org/jnci/content/vol98/issue7 ).
Odds ratios (ORs) and 95% confidence intervals (CIs) for breast cancer risk per gram of soy protein intake daily for individual studies
| No. of case patients | Original measure of soy intake | High vs. low exposure difference | OR (95% CI) per 1 g soy protein/day | |||
|---|---|---|---|---|---|---|
| Author, year * | Original soy measure † | g soy protein/day | ||||
| Lee et al., 1992 | 200 | Soy protein, g/day | 0.8, 4.5 | 1.00, 5.00 | 0.95 (0.83 to 1.07) | |
| Hirose et al., 1995 | 1049 | Tofu, per week | 0.5, 5 | 0.38, 3.82 | 0.95 (0.90 to 1.01) | |
| Yuan et al., 1995 (Shanghai) | 534 | Soy protein, g/day | 1.0, 19.0 | 1.00, 19.00 | 0.99 (0.97 to 1.02) | |
| Yuan et al., 1995 (Tianjin) | 300 | soy protein, g/day | 1.0, 19.0 | 1.00, 19.00 | 1.02 (0.98 to 1.06) | |
| Wu et al., 1996 | 596 | Tofu, per year | 6, 104 | 0.04, 0.68 | 0.52 (0.34 to 0.81) | |
| Greenstein et al., 1996 (postmeno) | 1018 | Soy or tofu | None, any | 0.00, 0.57 | 0.62 (0.29 to 1.31) | |
| Ingram et al., 1997 | 144 | Urinary daidzein, nmol/day | 300, 1500 | 0, 0.165 | 0.63 (0.34 to 1.18) | |
| Witte et al., 1997 (premeno) | 140 | Tofu/soybean, per week | None, 1 | 0.00, 1.13 | 0.54 (0.25 to 1.15) | |
| Chie et al., 1997 | 175 | Tofu (fried), per week | None, 1 | 0.00, 1.15 | 1.83 (0.93 to 3.61) | |
| Key et al., 1999 | 427 | Tofu, per week | 0.5, 6 | 0.38, 4.58 | 1.02 (0.94 to 1.10) | |
| Dai et al., 2001 | 1459 | Soy protein, g/wk | 9.3, 157.3 | 1.33, 10.30 | 0.95 (0.92 to 0.99) | |
| Horn-Ross et al., 2001 | 1272 | Dietary isoflavones, μg/day | 524, 3339 | 0.20, 1.20 | 1.00 (0.78 to 1.29) | |
| den Tonkelaar et al., 2001 | 88 | Urinary genistein, μmol/mol creatinine | 48.4, 196.6 | 1.1, 5.8 | 0.96 (0.85 to 1.09) | |
| Wu et al., 2002 | 501 | Tofu in adolescence | 0.5/month, 6/week | 0.04, 2.04 | 0.81 (0.62 to 1.05) | |
| Horn-Ross et al., 2002 | 711 | Dietary genistein, μg/day | 321, 2496 | 0.11, 0.89 | 1.00 (0.67 to 1.49) | |
| Yamamoto et al., 2003 | 179 | Dietary isoflavones, mg/day | 6.9, 25.3 | 2.08, 7.62 | 0.87 (0.78 to 0.97) | |
| Linseisen et al., 2004 | 278 | Dietary isoflavones, mg/day | 0.087, 0.478 | 0.03, 0.165 | 0.30 (0.01 to 8.45) | |
| Grace et al., 2004 | 111 | Dietary isoflavones, mg/day ‡ | 0.149, 0.736 | 0.05, 0.25 | 3.05 (0.66 to 14.13) | |
Postmeno = postmenopausal; premeno = premenopausal.
If the original published soy intake measure included open-ended categories for lowest and/or highest intake, the difference was estimated using the midpoints of these categories. If the actual midpoints were not provided, they were estimated as follows. For the lowest category the midpoint was taken as halfway between zero and the category cutpoint. For the highest category, the midpoint was taken as the category cutpoint plus half the width of the second highest category.
Total dietary isoflavones derived from sum of dietary genistein plus daidzein, taking midpoints of 25th and 75th percentiles.
Pooled odds ratios (ORs) and 95% confidence intervals (CIs) for breast cancer risk per gram of soy protein intake daily by study population
| No. of studies (case patients) | Test heterogeneity of ORs | |||||
|---|---|---|---|---|---|---|
| Group | χ 2 (df) * | P† | OR (95% CI) | Model used | ||
| All women | 18 (9182) | 42.20 (19) | .002 | 0.97 (0.94 to 1.00) | Random | |
| Asian | 8 (4323) | 23.48 (9) | .005 | 0.98 (0.95 to 1.01) | Random | |
| Premenopausal | 10 (3351) ‡ | 13.80 (9) | .130 | 0.94 (0.92 to 0.96) | Fixed | |
| Postmenopausal | 10 (3784) ‡ | 18.16 (9) | .033 | 0.95 (0.89 to 1.00) | Random | |
| Soy protein as original measure | 3 (2493) | 12.08 (4) | .017 | 0.99 (0.98 to 1.00) | Random | |
df = degrees of freedom. df does not equal N − 1 because studies that provided separate values for premenopausal and postmenopausal women contributed 2 df, and the report by Yuan et al. ( 62 ) of two geographically distinct case-control studies also contributed 2 df.
P values (two-sided) were based on the chi-square test of heterogeneity ( 58 ) .
The study by Key et al. ( 70 ) did not provide numbers of cases by menopausal status but did give numbers by age group. For this table, the Key et al. study contributed 150 case patients aged ≤54 years (“premenopausal”) and 277 aged ≥55 years (“postmenopausal”).
We also examined whether there was any evidence of a dose response by performing a weighted linear regression of log odds ratio versus the estimated soy protein exposure difference. The regression slope yielded the following values for the change in odds ratio per 1 g of soy protein/day: for all women, OR = 0.99 (95% CI = 0.98 to 1.01); for Asian women, OR = 0.99 (95% CI = 0.97 to 1.01); for premenopausal women, OR = 0.96 (95% CI = 0.93 to 1.00); and for postmenopausal women, OR = 0.95 (95% CI = 0.91 to 0.99). These values are similar to those observed in Table 5 for the pooled estimate of odds ratio per grams of soy protein/day and provide only weak evidence of a dose-response (again considering that eight studies did not provide menopause-specific data and could not be included in the above estimates).
Because several assumptions were necessary to transform the original definitions of high versus low exposure to estimates of risk increase per gram of soy protein per day, we performed a sensitivity analysis. This analysis examined the likelihood that the assumptions used to derive the estimate of soy protein exposure in any one study had an unduly large influence on the pooled result. We changed the estimated difference between high and low soy protein intake in one study at a time to either double the difference or decrease it by 50%, then pooled the odds ratios using the revised estimate. The pooled odds ratios were changed only minimally; the largest change was a 4.3% decrease in the odds ratio (to 0.90) for premenopausal women when the exposure difference was halved in the study by Hirose et al. ( 63 ) (data not shown). We also calculated pooled odds ratios after excluding the study with the largest weight, excluding the two studies with the largest and smallest odds ratio, and excluding the six studies with fewer than 200 case patients. None of the pooled odds ratios changed by greater than 0.01, with the exception of studies in premenopausal women, of which the change was 0.02 (i.e., from 0.94 to 0.92) when the study with the largest weight was excluded. No confidence intervals changed in a way that would affect interpretation (data not shown).
We also performed sensitivity analyses for the pooled odds ratios based on the original soy intake measure using the same exclusions and also excluding all studies with exposure based exclusively on tofu. The largest change was for premenopausal women when the study with the largest weight was omitted, which changed the pooled odds ratio from 0.70 to 0.66. Again, confidence intervals did not change in a meaningful way (data not shown). Thus, the pooled results appear robust to potential influential observations, regardless of whether the original or estimated soy protein exposure measure was used.
Finally, we evaluated the likelihood of publication bias using a funnel plot of the log (odds ratio) versus its standard error ( Fig. 3 ). To investigate any differences between large and small studies we arbitrarily designated studies with fewer than 200 case patients as small and those with at least 200 case patients as large ( Fig. 3 ). The funnel plot does not suggest publication bias, because there are similar numbers of small studies (or those with large standard error) with OR<1.0 compared with OR>1.0. Publication bias would have been suggested if the preponderance of small studies was biased toward OR<1.0 ( 60 ) . However, interpreting this plot visually is subjective, so we also used a regression approach to determine whether there was a correlation between the effect size [log (odds ratio)] and its standard error. This approach produced a statistically nonsignificant (regression) coefficient ( b = –.56, P = .524), confirming the lack of bias.
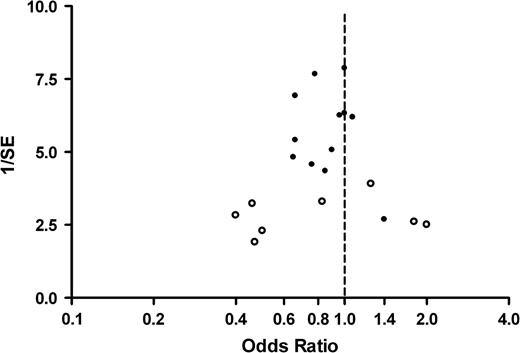
Funnel plot of odds ratio for high versus low soy exposure and inverse standard error (SE) of log (odds ratio). Open circles , sample size fewer than 200 women; closed circles , sample size 200 or more women.
D ISCUSSION
The meta-analysis included results from 12 case–control and six cohort or nested case–control studies. Among all studies, there was a small reduction in risk of breast cancer with high soy intake versus low intake (OR = 0.86, 95% CI = 0.75 to 0.99). The magnitude of the relationship was similar, but not statistically significant, when only women in Western countries or only Asian women were considered. Associations were somewhat stronger within menopause-specific strata, but these analyses omitted eight studies that did not provide stratified results, six of which did not support an overall association. Considered as a body of evidence, these studies support a small reduction in breast cancer risk associated with intake of soy foods, although interpretation of these results is tempered by lack of a dose response and inconsistencies in the data.
This meta-analysis evaluated the strength of current evidence for the role of a high soy diet in reducing breast cancer risk. Like all meta-analyses, it has potential limitations resulting from the availability, quality, and heterogeneity of the published data. For example, most studies were not originally designed to test the soy/breast cancer hypothesis, methods for measuring soy intake and expressing exposure differences differed across studies, substantial variation exists in the percentage of the population that regularly consumes soy and in the amount they consume, and the extent to which confounding factors were controlled differed among studies. These limitations can complicate interpretation of the summary statistics.
We cannot exclude the possibility that the observed risk estimates were attenuated owing to nondifferential measurement error in the individual studies; there are many potential sources of such error. Few studies were originally designed to test the effect of soy as a risk factor, used a validated instrument, or included portion sizes. Six studies based exposure estimates only on intake of tofu. Tofu contributes the largest amount of soy to most Asian diets, so relative ranking of subjects with respect to high and low intake should be possible with even crude intake measures ( 76 ) . However, in Western diets the majority of isoflavone intake for most people comes from nonsoy foods, such as soy additives in baked goods, tuna, or coffee ( 45 ) , and it is unlikely that levels of intake from such foods would coincide with recorded levels from soy foods such as tofu.
Because soy additives in the diet are difficult to quantify with most food frequency instruments and tofu intake is unlikely to correspond with total soy intake in most Western diets, the potential for misclassification may be larger in studies of Western women than Asian women. Use of a single spot urine sample to measure isoflavone levels could be another source of misclassification. These levels may be highly variable owing to time of day and timing with respect to meals. Absorption of isoflavones can differ by ethnicity or other factors, leading to variations in excreted levels despite similar levels of soy protein intake ( 50 ) . Although these sources of misclassification are likely to be nondifferential, differential measurement error is also possible if soy intake is associated with other diet or behaviors associated with breast cancer.
Differential measurement error could arise from recall bias, or if differential participation rates induced selection bias. Because most of these studies were not originally designed to test the soy/breast cancer hypothesis and because the potential preventive effects of soy were not widely known during the period when most of these studies were conducted, selective reporting of soy intake seems unlikely. However, recall bias could still arise if soy intake were associated with other breast cancer–related behaviors. Cohort and nested case–control studies exhibited somewhat weaker associations than retrospective case–control studies, consistent with such a possibility. The potential for selection bias must also be considered, particularly in the Western studies, among which soy foods were consumed by 5% or fewer of subjects. For example, control subjects who agree to participate may be more health conscious than the general population of women without breast cancer.
Because the studies we analyzed used different definitions of high and low intake, they varied greatly in the actual exposure effect that they measured. High intake for most Western studies corresponded with low intake in most studies of Asians. To improve comparability of these different exposure levels, we attempted to derive risk estimates based on a common exposure measure using estimated daily soy protein intake (grams). We found that the resulting risk estimates appeared robust to variation in the assumptions used to derive exposure. Although it is likely that conversion from the original exposure measures to estimated soy protein intake in grams per day entails some error, it illustrates the large variation across studies in exposure differences. Analyses based on these estimates of soy protein intake showed similar odds ratios across subgroups, ranging from 0.94 to 0.98 per g of daily soy protein intake ( Table 5 ; Supplementary Table 2, available at http://jncicancerspectrum.oxfordjournals.org/jnci/content/vol98/issue7 ). There was little evidence of a dose response.
To provide some perspective, consumption of one 3.5-ounce (98 g) serving of tofu per week, the most common cutpoint for high exposure among the studies that measured tofu consumption, would provide 7.92 g of soy protein/week—the equivalent of 1.13 g of soy protein/day from tofu ( 40 ) . Thus, the pooled odds ratios shown in Table 5 (based on 1.0 g of soy protein/day) are very near to those that would be expected for one serving of tofu per week.
The apparent reduction in breast cancer risk associated with greater soy intake was similar or even slightly stronger in Western populations than in Asian populations, despite much lower soy intake. This could reflect a greater degree of uncontrolled confounding in the Western studies. Because of the very low percentage of women who consumed soy foods in the Western studies, it is possible that soy intake is a surrogate for other risk-lowering behaviors. The four Western studies with the strongest association based on the estimated soy protein measure included a low proportion of subjects who regular consumed soy foods—3% ( 3 ) , 5% ( 64 ) , and 25% ( 65 ) —and the foods had a low proportion (4%–8%) of total isoflavones contributed by soy foods ( 54 ) . The subjects in these studies probably differ in other factors associated with a more health-conscious lifestyle or, for the Asian-American women, with a more traditional lifestyle. Such factors may be difficult to separate from the measurements of soy intake.
When we analyzed the impact on the odds ratio of potential confounders, BMI was the only statistically significant contributor to heterogeneity; studies that adjusted for BMI exhibited weaker associations than those that did not adjust. However, few studies adjusted for other potentially important confounders such as alcohol consumption, breast-feeding, or physical activity. These are likely to be inversely (alcohol) or directly (breast-feeding, physical activity) associated with soy intake, a traditional Asian lifestyle, or a more health-conscious Western lifestyle. Thus, we cannot exclude uncontrolled confounding as a source of error in the observed associations.
If the association between greater soy intake and lower breast cancer risk is real, what could explain the apparent lack of association between intake levels and size of the risk reduction in Western and Asian studies? Breast cancer risk for the average woman is much higher in Western women (133 per 100 000) ( 77 ) than in Asian women (39 per 100 000) ( 78 ) , undoubtedly reflecting a higher burden of risk factors such as late age at first full-term pregnancy, early menarche, obesity/lack of physical activity, alcohol consumption, and adverse nutritional factors. Therefore, there may be fewer potentially harmful pathways for soy to impact breast cancer risk among Asian women, and much larger differences in exposure may be needed to detect a level of risk reduction similar to that associated with smaller differences among Western women. This is analogous to the relative benefits of giving chemotherapy to patients with a high versus low risk of recurrence ( 79 ) . Alternatively, the risk reduction due to soy may reach a plateau at a relatively low level ( 76 ) . Such an explanation would be consistent with the lack of dose response observed in this meta-analysis and the similar or possibly even smaller risk reduction among women in Asian countries than in Western countries.
For either of the above explanations to be true, soy would need to exhibit strong anticancer effects at these Western intake levels that correspond with low intake levels in Asian countries. It is difficult to evaluate the likelihood of such a low-dose effect. Plasma isoflavone levels in Western women are much less than 1 μmol/L ( 12 ) . This level has not been adequately explored in experimental studies, which have used levels orders of magnitude higher. Thus, for the results in Western women to represent a true association between soy intake and breast cancer risk, they would involve anticarcinogenic effects that have not yet been demonstrated.
A possible explanation for similar reductions in breast cancer risk associated with different soy intake levels in Western and Asian women relates to the timing of exposure. Studies conducted by our group ( 38 ) and others ( 80 ) show that prepubertal exposure to genistein reduces carcinogen-induced breast cancer in rats ( 81 ) . Asian women are likely to have been exposed to soy during early life. This observation is consistent with associations between childhood soy exposure and reduced breast cancer risk in studies by Wu et al. ( 51 ) and Shu et al. ( 72 ) and an association between soy intake and reduced breast cancer risk among Asian-Americans observed only in the subgroup not born in the United States ( 65 ) . If early life is the critical period for soy exposure, then studies based on adult exposure may not capture the association with breast cancer risk and could underestimate the association in Asian women. Conversely, because most Western women would not have experienced early-life soy food exposures, their exposures in adulthood may be relatively more important in affecting risk. However, this would still require anticarcinogenic effects at fairly low exposure levels during adulthood.
If low levels of soy exposure in adulthood can reduce breast cancer risk, what biologic changes could be responsible? Soy supplementation has no clear association with serum estrogen levels in premenopausal ( 82 ) or postmenopausal ( 83 , 84 ) women, so systemic hormonal effects are unlikely to contribute to reduced risk of breast cancer. There is also no evidence either that genistein would block ER-α activation or prevent ovarian estrogens from activating the estrogen receptor. Several other mechanisms have been proposed to explain soy's beneficial health effects ( 85 ) . In experimental systems, genistein exhibits a wide range of biologic changes that could potentially reduce breast cancer risk, although many of these changes occur only at pharmacologic concentrations ( 10 , 11 ) . One mechanism attributed to genistein at physiologic concentrations is its ability to act as an antioxidant. However, in human studies antioxidant effects have been mixed, with some studies finding no effect at physiologic doses ( 86 , 87 ) and others observing effects for some but not other biomarkers of antioxidant effect ( 88 , 89 ) ; the latter study used an isoflavone supplement with isoflavone levels fourfold higher than those in a typical Japanese diet ( 90 ) .
Like estrogens ( 91 ) , genistein may induce cell differentiation ( 24 ) . In the rodent mammary gland, genistein induces morphologic differentiation, reducing the number of targets for malignant transformation ( 81 ) . Epithelial differentiation is a hallmark outcome of pregnancy that has been proposed to explain why pregnancy reduces breast cancer risk ( 91 ) . However, in older women, whose breasts are more likely to have acquired malignant cells than those of younger women, estrogens or genistein may promote the growth of malignant cells; increased breast epithelial differentiation may not be sufficient to counteract these effects.
There are also data suggesting that soy or isoflavones could increase breast cancer risk. Exposure to physiologic concentrations of genistein in vitro activates ER-α and induces normal and malignant cell proliferation in vitro and in vivo ( 13 – 16 , 18 , 35 , 36 ) . These findings suggest an estrogenic effect and a theoretical potential for increased breast cancer risk, although the estrogenic effects of soy appear to be minimal, even in postmenopausal women ( 83 , 84 ) . Data from human tumor xenograft models suggest that genistein may reduce the antineoplastic effects of tamoxifen ( 22 , 23 ) , although daidzein was found to enhance the effect of tamoxifen ( 23 ) . However, recurrence after excision of the primary tumor was reduced by addition of soy protein to the diets of rats before administration of carcinogen ( 92 ) . The effect may depend on the form of soy or isoflavone. A recent study in the ovariectomized xenograft model showed that the degree of processing of soy influences the biologic activity of the resulting soy products ( 93 ) . Soy flour did not stimulate tumor growth, whereas tumors in animals receiving progressively more refined soy products showed growth enhancement, despite equivalent concentrations of genistein intake in all groups. This result suggests that highly processed soy supplements such as soy protein isolate, isoflavone-rich soy extracts, or isoflavone capsules exhibit activity that is not present in foods made from soybeans or soy flour, such as those consumed in Asian diets. Little or no research has been done in women with long-term consumption of such highly processed soy supplements.
This meta-analysis of the epidemiologic literature reveals a small inverse association between soy intake and breast cancer risk in both Western and Asian women. Limitations of the available data do not permit exclusion of artifactual explanations for the apparent effect, such as misclassification, uncontrolled confounding, or selection bias. The similar magnitude of the apparent risk reduction in Western and Asian populations, despite large differences in exposure levels, suggests either artifact, differential levels of confounding and misclassification, or true differences in effect based on timing of exposure.
Because of the many gaps in knowledge and inconsistencies revealed by this analysis and review of relevant studies, we cannot recommend widespread use of high-dose isoflavone supplements by women at high risk for breast cancer or by breast cancer survivors. However, there are no data to suggest that consumption of soy foods in amounts consistent with an Asian diet is detrimental to breast health, and such a diet is likely to confer benefits to other aspects of health. Now that soy food consumption is increasing in Western societies, epidemiologic studies should evaluate exposure at different periods of life, and focus on better quantitation of soy foods and soy additives to food, combined with use of repeated urine isoflavone measurements with consistent timing and efforts to include an adequate range of exposures. Furthermore, experimental studies based on physiologic dose levels are needed to clarify estrogenic and nonestrogenic isoflavone activities in the breast.
Supported by the National Cancer Institute (U01 CA85082 to B. J. Trock, U54 CA100970 to L. Hilakivi-Clarke, and R01 CA096483 to R. Clarke) and the American Institute for Cancer Research (AICR 02A111 to L. Hilakivi-Clarke). The sponsors had no role in the study design, data collection and analysis, or the interpretation of the findings.
We thank Drs. Anna Wu, Mark Messina, and Kaoru Hirose for information about soy intake in U.S. and Asian populations and Leslie White Butler for assistance with data abstraction.
Funding to pay the Open Access publication charges for this article was provided by U54 CA100970 (L. Hilakivi-Clarke).
References
Ziegler RG, Hoover RN, Pike MC, Hildesheim A, Nomura AMY, West DW, et al. Migration patterns and breast cancer risk in Asian-American women.
Greenstein J, Kushi LH, Zheng W. Risk of breast cancer associated with intake of specific foods and food groups.
Coward L, Barnes NC, Setchell KDR, Barnes S. Genistein, daidzein, and their beta-glycoside conjugates: antitumor isoflavones in soybean foods from American and Asian diets.
United Soybean Board. 7th Annual consumer attitudes about nutrition. 2000–2001 National Report. St. Louis (MO): United Soybean Board;
Kris-Etherton PM, Hecker KD, Bonanome A, Coval SM, Binkoski AE, Hilpert KF, et al. Bioactive compounds in foods: their role in the prevention of cardiovascular disease and cancer.
Adlercreutz CH, Goldin BR, Gorbach SL, Hockerstedt KAV, Watanabe S, Hamalainen E, et al. Soybean phytoestrogen intake and cancer risk.
Barnes S, Peterson G, Grubbs C, Setchell K. Potential role of dietary isoflavones in the prevention of cancer. In: Jacobs MM, editor. Diet and cancer: markers, prevention, and treatment. New York: Plenum Press;
Adlercreutz H. Phytoestrogens: Epidemiology and a possible role in cancer protection.
Messina M, Persky V, Setchell KDR, Barnes S. Soy intake and breast cancer: a review of the in vitro and in vivo data.
Bouker KB, Hilakivi-Clarke L. Genistein: does it prevent or promote breast cancer?
Messina MJ, Loprinzi CL. Soy for breast cancer survivors: a critical review of the literature.
Wang TT, Sathyamoorthy N, Phang JM. Molecular effects of genistein on estrogen receptor mediated pathways.
Collins BM, McLachlan JA, Arnold SF. The estrogenic and antiestrogeneic activities of phytochemicals with the human estrogen receptor expressed in yeast.
Zava DT, Duwe G. Estrogenic and antiproliferative properties of genistein and other flavonoids in human breast cancer cells in vitro.
Kuiper GG, Lemmen JG, Carlsson B, Corton JC, Safe SH, van der Saag PT, et al. Interaction of estrogenic chemicals and phytoestrogens with estrogen receptor beta.
Hsieh CY, Santell RC, Haslam SZ, Helferich WG. Estrogenic effects of genistein on the growth of estrogen receptor-positive human breast cancer (MCF-7) cells in vitro and in vivo.
Martin PM, Horwitz KB, Ryan DS, McGuire WL. Phytoestrogen interaction with estrogen receptors in human breast cancer cells.
Petrakis NL, Barnes S, King EB, Lowenstein J, Wiencke J, Lee MM, et al. Stimulatory influence of soy protein isolate on breast secretion in pre- and postmenopausal women.
McMichael-Phillips DF, Harding C, Morton M, Robert SA, Howell A, Potten CS, et al. Effects of soy-protein supplementation on epithelial proliferation in the histologically normal human breast.
Santell RC, Chang YC, Nair MG, Helferich WG. Dietary genistein exerts estrogeneic effects upon the uterus, mammary gland and the hypothalamic/pituitary axis in rats.
Ju YH, Doerge DR, Allred KF, Allred CD, Helferich WG. Dietary genistein negates the inhibitory effect of tamoxifen on growth of estrogen-dependent human breast cancer (MCF-7) cells implanted in athymic mice.
Constantinou AI, White BE, Tonetti D, Yang Y, Liang W, Li W, et al. The soy isoflavone daidzein improves the capacity of tamoxifen to prevent mammary tumours.
Brown NM, Wang J, Controneo MS, Zhao YX, Lamartiniere CA. Prepubertal genistein treatment modulates TGF-alpha, EGF and EGF-receptor mRNAs and proteins in the rat mammary gland. Mol Cell
Maskarinec G, Meng L. An investigation of soy intake and mammographic characteristics in Hawaii.
Jakes RW, Duffy SW, Ng FC, Gao F, Ng EH, Seow A, et al. Mammographic parenchymal patterns and self-reported soy intake in Singapore Chinese women.
Maskarinec G, Williams AE, Carlin L. Mammographic densities in a one-year isoflavone intervention.
Cohen LA, Zhao Z, Pittman B, Scimeca JA. Effect of intact and isoflavone-depleted soy protein on NMU-induced rat mammary tumorigenesis.
Ueda M, Niho N, Imai T, Shibutani M, Mitsumori K, Matsui T, et al. Lack of significant effects of genistein on the progression of 7,12-dimethylbenz (a)anthracene-induced mammary tumors in ovariectomized Sprague-Dawley rats.
Jin Z, MacDonald RS. Soy isoflavones increase latency of spontaneous mammary tumors in mice.
Constantinou AI, Lantvit D, Hawthorne M, Xu X, van Breemen RB, Pezzuto JM. Chemopreventive effects of soy protein and purified soy isoflavones on DMBA-induced mammary tumors in female Sprague-Dawley rats.
Gallo D, Giacomelli S, Cantelmo F, Zannoni GF, Ferrandina G, Fruscella E, et al. Chemoprevention of DMBA-induced mammary cancer in rats by dietary soy.
Hewitt AL, Singletary KW. Soy extract inhibits mammary adenocarcinoma growth in a syngeneic mouse model.
Shao ZM, Wu J, Shen ZZ, Barsky SH. Genistein exerts multiple suppressive effects on human breast carcinoma cells.
Ju YH, Allred CD, Allred KF, Karko KL, Doerge DR, Helferich WG. Physiological concentrations of dietary genistein dose-dependently stimulate growth of estrogen-dependent human breast cancer (MCF-7) tumors implanted in athymic nude mice.
Allred CD, Allred KF, Ju YH, Clausen LM, Doerge DR, Schantz SL, et al. Dietary genistein results in larger MNU-induced, estrogen-dependent mammary tumors following ovariectomy of Sprague-Dawley rats.
Lamartiniere CA, Cotroneo MS, Fritz WA, Wang J, Mentor-Marcel R, Elgavish A. Genistein chemoprevention: timing and mechanisms of action in murine mammary and prostate.
Hilakivi-Clarke L, Onojafe I, Raygada M, Cho E, Skaar T, Russo I, et al. Prepubertal exposure to zearalenone or genistein reduces mammary tumorigenesis.
Pei RJ, Sato M, Yuri T, Danbara N, Nikaido Y, Tsubura A. Effect of prenatal and prepubertal genistein exposure on N-methyl-N-nitrosourea-induced mammary tumorigenesis in female Sprague-Dawley rats.
U.S.Department of Agriculture, Agricultural Research Service. USDA nutrient database for standard reference. Release 18. Available at: http://www.nal.usda.gov/fnic/foodcomp/search/ . [Last accessed: February
Tsubono Y, Kobayashi M, Takahashi T, Iwase Y, Iitoi Y, Akabane M, et al. Within- and between-person variations in portion sizes of foods consumed by the Japanese population.
Nagata C, Kabuto M, Kuriso Y, Shimizu H. Decreased serum estradiol concentration associated with high dietary intake of soy products in premenopausal Japanese women.
Ho SC, Woo JL, Leung SS, Sham AL, Lam TH, Janus ED. Intake of soy products is associated with better plasma lipid profiles in the Hong Kong Chinese population.
Horn-Ross PL, Lee M, John EM, Koo J. Sources of phytoestrogen exposure among non-Asian women in California, USA.
Ingram D, Sanders K, Kolybaba M, Lopez D. Case-control study of phytoestrogens and breast cancer.
den Tonkelaar I, Keinan-Boker L, Veer PV, Arts CJ, Adlercreutz H, Thijssen JH, et al. Urinary phytoestrogens and postmenopausal breast cancer risk.
Karr SC, Lample JW, Hutchins AM, Slavin JL. Urinary isoflavonoid excretion in humans is dose dependent at low to moderate levels of soy-protein consumption.
Adlercreutz H, Honjo H, Higashi A, Fotsis T, Hamalainen E, Hasegawa T, Okada H. Urinary excretion of lignans and isoflavonoid phytoestrogens in Japanese men and women consuming a traditional Japanese diet.
Horn-Ross PL, John EM, Lee M, Stewart SL, Koo J, Sakoda LC, et al. Phytoestrogen consumption and breast cancer risk in a multiethnic population: the Bay Area Breast Cancer Study.
Wu AH, Wan P, Hankin J, Tseng CC, Yu MC, Pike MC. Adolescent and adult soy intake and risk of breast cancer in Asian-Americans.
Yamamoto S, Sobue T, Kobayashi M, Sasaki S, Tsugane S. Soy, isoflavones, and breast cancer risk in Japan.
Horn-Ross PL, Hoggatt KJ, West DW, Krone MR, Stewart SL, Anton H, et al. Recent diet and breast cancer risk: the California Teachers Study (USA).
Linseisen J, Piller R, Hermann S, Chang-Claude J. Dietary phytoestrogen intake and premenopausal breast cancer risk in a German case-control study.
Maskarinec G, Singh S, Meng L, Franke AA. Dietary soy intake and urinary isoflavone excretion among women from a multiethnic population.
Nagata C, Shimizu H, Takami R, Hayashi M, Takeda N, Yasuda K. Soy product intake is inversely associated with serum homocysteine level in premenopausal Japanese women.
Greenland S. Quantitative methods in the review of epidemiologic literature.
DerSimonian R, Laird N. Meta-analysis in clinical trials.
Sterne JA, Gavaghan D, Egger M. Publication and related bias in meta-analysis: power of statistical tests and prevalence in the literature.
Lee HP, Gourley L, Duffy SW, Esteve J, Lee J, Day NE. Risk factors for breast cancer by age and menopausal status: a case-control study in Singapore.
Yuan JM, Wang QS, Ross RK, Henderson BE, Yu MC. Diet and breast cancer in Shanghai and Tianjin, China.
Hirose K, Takima K, Hamajima N, Inoue M, Takezaki T, Kuroisha T, et al. A large scale, hospital-based, case-control study of risk factors of breast cancer according to menopausal status.
Witte JS, Ursin G, Siemiatycki J, Thompson WD, Paganini-Hill A, Haile RW. Diet and premenopausal bilateral breast cancer: a case-control study.
Wu AH, Ziegler RG, Horn-Ross PL, Nomura AMY, West DW, Kolonel LN, et al. Tofu and risk of breast cancer in Asian-Americans.
Chie WU, Lee WC, Li CY, Huang CS, Lin RS. Soybean products, vegetable and fruit and breast cancer risk in Taiwan.
Hirohata T, Shigematsu T, Nomura AMY, Nomura Y, Horie A, Hirohata I. Occurrence of breast cancer in relation to diet and reproductive history: a case-control study in Fukuoka, Japan.
Nomura A, Henderson BE, Lee J. Breast cancer and diet among the Japanese in Hawaii.
Zheng W, Dai Q, Custer LJ, Shu XO, Wen WQ, Jin F, et al. Urinary excretion of isoflavonoids and the risk of breast cancer.
Key TJ, Sharp GB, Appleby PN. Soya foods and breast cancer risk: a prospective study in Hiroshima and Nagasaki, Japan.
Dai Q, Shu XO, Jin F, Potter JD, Kushi LH, Teas J, et al. Population-based case-control study of soyfood intake and breast cancer risk in Shanghai.
Shu XO, Jin F, Dai Q, Wen W, Potter JD, Kushi LH, et al. Soyfood intake during adolescence and subsequent risk of breast cancer among Chinese women.
Grace PB, Taylor JI, Low YL, Luben RN, Mulligan AA, Botting NP, et al. Phytoestrogen concentrations in serum and spot urine as biomarkers for dietary phytoestrogen intake and their relation to breast cancer risk in European prospective investigation of cancer and nutrition-norfolk.
Dai Q, Franke AA, Jin F, Shu XO, Hebert JR, Custer LJ, et al. Urinary excretion of phytoestrogens and risk of breast cancer among Chinese women in Shanghai.
Murkies A, Dalais FS, Briganti EM, Burger HG, Healy DL, Wahlqvist ML, et al. Phytoestrogens and breast cancer in postmenopausal women: a case control study.
Wu AH, Ziegler RG, Nomura AMY, West DW, Kolonel LN, Horn-Ross PL, et al. Soy intake and risk of breast cancer in Asians and Asian Americans.
Weir HK, Thun MJ, Hankey BF, Ries LA, Howe HL, Wingo PA, et al. Annual report to the nation on the status of cancer, 1975–2000, featuring the uses of surveillance data for cancer prevention and control.
Fukuda M, Miyamoto K, Hashizume R, Okamoto J, Kawamoto H, Yabuki Y, et al. Breast cancer.
Harris J, Marrow M, Norton L. Malignant tumors in the breast. In: DeVita V, Hellman S, Rosenberg SA editors. Philadelphia: Lippincott-Raven;
Fritz WA, Coward L, Wang J, Lamartiniere CA. Dietary genistein: perinatal mammary cancer prevention, bioavailability and toxicity testing in the rat.
Cabanes A, Wang M, Olivo S, de Assis S, Gustafsson JA, Khan G, et al. Prepubertal estradiol and genistein exposures up-regulate BRCA1 mRNA and reduce mammary tumorigenesis.
Maskarinec G, Franke AA, Williams AE, Hebshi S, Oshiro C, Murphy S, et al. Effects of a 2-year randomized soy intervention on sex hormone levels in premenopausal women.
Baird DD, Umbach DM, Lansdell L, Hughes CL, Setchell KDR, Weinberg CR, et al. Dietary intervention study to assess estrogenicity of dietary soy among postmenopausal women.
Van Patten CL, Olivotto IA, Chambers GK, Gelmon KA, Hislop TG, Templeton E, et al. Effect of soy phytoestrogens on hot flashes in postmenopausal women with breast cancer: a randomized, controlled clinical trial.
Chen CY, Bakhiet RM, Hart V, Holtzman G. Isoflavones improve plasma homocysteine status and antioxidant defense system in healthy young men at rest but do not ameliorate oxidative stress induced by 80% VO 2 pk exercise.
Vega-Lopez S, Yeum KJ, Lecker JL, Ausman LM, Johnson EJ, Devaraj S, et al. Plasma antioxidant capacity in response to diets high in soy or animal protein with or without isoflavones.
Oh HY, Kim SS, Chung HY, Yoon S. Isoflavone supplements exert hormonal and antioxidant effects in postmenopausal Korean women with diabetic retinopathy.
DiSilvestro RA, Goodman J, Dy E, Lavalle G. Soy isoflavone supplementation elevates erythrocyte superoxide dismutase, but not plasma ceruloplasmin in postmenopausal breast cancer survivors.
Wakai K, Egami I, Kato K, Kawamura T, Tamakoshi A, Lin Y, et al. Dietary intake and sources of isoflavones among Japanese.
Russo J, Hu YF, Yang X, Russo IH. Developmental, cellular, and molecular basis of human breast cancer.
Hawrylewicz EJ, Zapata JJ, Blair WH. Soy and experimental cancer: animal studies.

