


Abstract
Clinical trials of new cancer drugs should ideally include measurements of parameters such as molecular target expression, pharmacokinetic (PK) behavior, and pharmacodynamic (PD) endpoints that can be linked to measures of clinical effect. Appropriate PK/PD biomarkers facilitate proof-of-concept demonstrations for target modulation; enhance the rational selection of an optimal drug dose and schedule; aid decision-making, such as whether to continue or close a drug development project; and may explain or predict clinical outcomes. In addition, measurement of PK/PD biomarkers can minimize uncertainty associated with predicting drug safety and efficacy, reduce the high levels of drug attrition during development, accelerate drug approval, and decrease the overall costs of drug development. However, there are many challenges in the development and implementation of biomarkers that probably explain their disappointingly low implementation in phase I trials. The Pharmacodynamic/Pharmacokinetic Technologies Advisory committee of Cancer Research UK has found that submissions for phase I trials of new cancer drugs in the United Kingdom often lack detailed information about PK and/or PD endpoints, which leads to suboptimal information being obtained in those trials or to delays in starting the trials while PK/PD methods are developed and validated. Minimally invasive PK/PD technologies have logistic and ethical advantages over more invasive technologies. Here we review these technologies, emphasizing magnetic resonance spectroscopy and positron emission tomography, which provide detailed functional and metabolic information. Assays that measure effects of drugs on important biologic pathways and processes are likely to be more cost-effective than those that measure specific molecular targets. Development, validation, and implementation of minimally invasive PK/PD methods are encouraged.
Anticancer drug discovery and development are undergoing a period of rapid and unprecedented change ( 1 , 2 ) . Molecular biology and genomic approaches have led to an increasingly detailed understanding of the genetic abnormalities that drive the malignant phenotype ( 3 ) . The identification of cancer-causing genes and the cellular pathways that their encoded proteins control provides a wide range of new targets for oncology drug discovery and development ( 1 , 2 , 4 ) . At the same time, the pace of drug discovery and development is being accelerated by numerous innovative technologies, particularly high-throughput methodologies for genomics, screening, structural biology, pharmacokinetics, and combinatorial chemistry ( 1 , 5 ) .
The nature of the drugs emerging from these new approaches is also changing dramatically. The previous generation of anticancer agents was dominated by cytotoxic drugs, whose precise molecular mechanisms of action were often not clear during their preclinical and early clinical development. The new generation of molecular therapeutics include mechanism-based modulators of proliferative signal transduction and cell cycle transit, telomere regulation, apoptosis/survival, invasion, angiogenesis, and metastasis ( 1 – 4 ) . Clinical development of such agents is still in the early stages, but the promise of this approach has already been shown through the regulatory approval of trastuzumab, a humanized monoclonal antibody for ErbB2-positive breast cancer ( 6 ) ; imatinib mesylate, a Bcr-Abl and c-Kit inhibitor in chronic myelocytic leukemia ( 7 ) and gastrointestinal stromal tumors ( 8 ) ; and the epidermal growth factor receptor tyrosine kinase inhibitors gefinitib and erlotinib, which show preferential activity in non–small-cell lung cancers that harbor activating kinase mutations ( 9 , 10 ) . Other recently approved molecular therapeutic agents include the monoclonal antibody cetuximab for colorectal cancers that overexpress the epidermal growth factor receptor ( 11 ) and the monoclonal antibody bevacizumab, which acts on the vascular endothelial growth factor receptor ligand, VEGF-A ( 12 ) . Many other innovative drugs that interfere with the molecular pathology of human cancers are now undergoing preclinical and clinical development ( 13 ) . However, based on past experience, the vast majority of these drugs will not make it through to marketing approval.
The new molecular therapeutics pose a considerable challenge for oncology drug development [reviewed in ( 14 ) ]. For preclinical and clinical development, it is essential to know 1) whether adequate or optimal exposures are being achieved in the tissues of interest in the experimental organism or patient, 2) whether the molecular target is being appropriately modulated, and 3) whether the desired biologic effect is being obtained ( Fig. 1 ). The ability to make these types of measurements as part of phase I/II clinical trials is particularly important. For example, in phase I trials, it is no longer sufficient only to define the nature of the dose-limiting toxicity, the maximum tolerated dose, and the recommended dose for a phase II trial. Phase I trials are increasingly extensions of the preclinical mechanistic drug development process and, as such, represent the first clinical test of the hypothesis. The development of techniques to measure pharmacokinetic (PK) and pharmacodynamic (PD) endpoints is essential for both the preclinical and clinical development of the new oncology drugs ( 15 , 16 ) . Here we use the term PK to denote what the body does to the drug in terms of its absorption, distribution, metabolism, and excretion, including the concentration–time relationship and its dependence on dose; the term PD is used to denote what the drug does to the body. PK/PD relationships reflect the connection between the two. Linkage of information on the status of the molecular target, PK, and PD to measures of biologic and clinical effects constitutes a pharmacologic “audit trail” ( 17 ) .
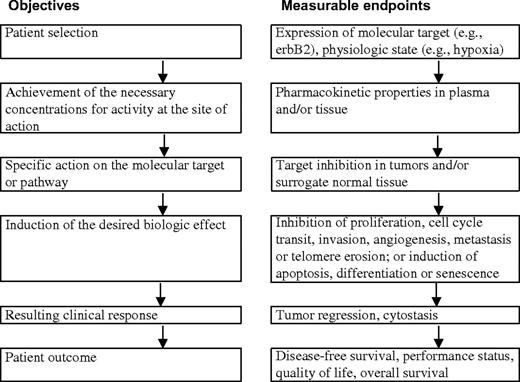
Stages in preclinical and clinical therapeutic development showing paired objectives and examples of measurable endpoints.
Throughout the process of preclinical and clinical drug development, measurement of appropriate biomarkers is invaluable, to aid the selection of the most appropriate clinical candidate, to provide demonstration of proof of concept for molecular and biologic mechanisms, to help the interpretation of clinical trial data, to inform the identification of the optimal dose and schedule, and to support regulatory submissions ( 18 , 19 ) . PK/PD biomarkers should help to minimize risks associated with studies of drug safety and efficacy and reduce the levels of drug attrition in preclinical and clinical phases, which are unacceptably high. Hence, the cost of pharmaceutical development should be decreased.
Developing and implementing PK/PD biomarker methods can be challenging because they need to be sensitive and specific and may be very complex. There are also issues concerning the invasiveness of these technologies and their logistic impact on the conduct of early clinical trials. Although PK/PD endpoints clearly add value to preclinical drug development and early clinical trials, it is important that the introduction and implementation of PK/PD methodologies should not delay such trials. These challenges may explain results of a recent survey showing that the use of molecular and functional imaging endpoints within phase I trials of molecular therapeutics was disappointingly low ( 20 ) .
The Pharmacodynamic/Pharmacokinetic Technologies Advisory Committee (PTAC) was established under the auspices of the Phase I/II Clinical Trial Committee and the New Agents Committee of Cancer Research UK. The latter committee is responsible for reviewing and auditing applications for phase I and II trials of new agents in the United Kingdom ( 21 ) . While reviewing new drug applications, PTAC members recognized that there was a need for 1) greater awareness of PK/PD endpoints in the oncology drug development community, 2) more extensive implementation of PK/PD endpoints in preclinical and clinical anticancer drug development, and 3) more research to bring forward improved PK/PD technologies for the future. In particular, the sponsoring Cancer Research UK committees have noted that submissions of new agents frequently lacked information on PK/PD endpoints in the clinical trial. Such omissions could lead to suboptimal information being obtained in the trials that are approved or to delays in implementing the trials while appropriate PK/PD endpoints are developed. Discussions with other drug development organizations, such as the European Organization for Research and Treatment of Cancer (EORTC) and the U.S. National Cancer Institute indicate that the lack of or use of weak PK/PD endpoints is common. PTAC appears to be the only advisory body worldwide to provide comprehensive multidisciplinary advice in this area.
PTAC members are experts who have experience with the key PK/PD methodologies and consult with other specialists when appropriate. Our goal with this review is to publish the Committee's emerging experience and recommendations so that they can be of more general benefit beyond the Cancer Research UK organization. The Committee welcomes feedback from other organizations and investigators with regard to their experience of PK/PD issues in phase I and II trials. The development and sharing of broad guidelines for PK/PD endpoints seem particularly appropriate given the changing nature of early clinical trials, the uncertainty and risk associated with the new range of molecular therapeutics, and the need for extensive cooperation between academia and the pharmaceutical and biotechnology sectors ( 19 ) .
A wide range of invasive and minimally-invasive techniques are available to determine PK and PD endpoints. Judicious use of biopsy or other invasive surrogate-based assays to measure PK and PD, including target modulation, remains very important in early clinical trials. However, because of the logistic and ethical issues associated with invasive measurements, there is an increasing requirement for minimally invasive assays ( 22 ) . Here we review the various imaging-based minimally invasive methodologies available for assessing PK/PD endpoints and discuss their strengths and weaknesses ( Table 1 ). We emphasize magnetic resonance imaging (MRI), magnetic resonance spectroscopy (MRS), and positron emission tomography (PET) because they provide the greatest level of functional and metabolic information. We also highlight the current limitations in PK/PD technologies, particularly in terms of their ability to measure effects on specific molecular targets or biologic functions. Finally, we identify areas of current need and make recommendations for further research.
Summary of strengths, weaknesses, and opportunities for using minimally invasive technologies in pharmacokinetic and pharmacodynamic studies *
| Technology and applications (possible tracer/marker) | Strengths | Weaknesses | Opportunities | Robustness † |
|---|---|---|---|---|
| Positron emission tomography (PET) | 3 | |||
| 1. General characteristics for imaging | Sensitivity; specificity; kinetic resolution; low dose administered | Lack of chemical resolution; methodology developments required | Molecular imaging possible; proof of principle and new pharmacokinetic/ pharmacodynamic studies possible | |
| 1. Imaging glucose utilization ( 18 F-FDG) | For grading and response assessment | Inflammation can give false-positives | Utility increasing; availability of standards for large trials | 1 |
| 2. PK of labeled drugs/molecules (5- 18 F-fluorouracil) | PK obtained for tumor and normal tissues | Lack of chemical resolution | New labeling strategies; improved data analysis | 2/3 |
| 3. Imaging cell proliferation ( 11 C-thymidine) | Direct and rapid assessment | Thymidine metabolism can complicate data analysis | Nonmetabolized thymidine analogs | 2/3 |
| 4. Blood flow and blood volume imaging ( 15 O H 2 O/CO) | Endpoint for antivascular therapy; index for drug uptake and clearance | Poor signal-to-noise ratio in some tumors | Improved sensitivity of scanners | 2/3 |
| 5. Measurement of tissue pH ( 11 C-bicarbonate) | Tissue pH measured | Does not differentiate pHi from pHe | Understanding drug effects | 2/3 |
| 6. Drug mechanism of action studies ( 11 C-temozolomide) | Provides proof of principle in patients | Not applicable to all drugs | Evidence of activity in vivo | 3 |
| 7. Protein synthesis measurements ( 11 C-methionine) | Endpoint for certain drugs | Tracer metabolism can complicate data analysis | Improved data analysis | 3 |
| 8. Thymidylate synthase inhibition ( 11 C-thymidine) | Endpoint for certain drugs | Application is limited to initial drug effect | Several compounds can be evaluated | 3 |
| 9. Imaging multidrug resistance phenotype ( 11 C-daunorubicin) | Patient selection for reversal of phenotype | Methodology developments required | Improved synthesis; new tracers | 2/3/4 |
| 10. Hypoxia imaging ( 18 F-FMISO) | Patient selection for several therapeutic agents | Current tracers have high nonspecific signal | New tracers | 2/3/4 |
| 11. Cell surface and nuclear receptor imaging ( 18 F-FES) | For grading and response assessment | Requires extensive validation | Direct clinical assessment | 3/4 |
| 12. Imaging gene expression ( 124 I-FIAU) | Monitoring gene therapy; studying transcription | Methodology developments required | More sensitive animal scanners; molecular imaging of tumor-bearing/transgenic mice | 3/4 |
| 13. Angiogenesis imaging ( 124 I-VEGF) | Response assessment | Not verified in humans | Understanding tumor biology | 4/5 |
| 14. Apoptosis imaging ( 124 I-annexin) | Response assessment | Difficulty to differentiate necrosis | Evaluating several therapies; dose optimization in radiotherapy | 4/5 |
| 15. Imaging protein–protein interactions | Endpoint for certain drugs | Methodology developments required | Patient selection | 6 |
| Magnetic resonance imaging (MRI)/magnetic resonance spectroscopy (MRS) | ||||
| 1. Volumetric imaging | High soft-tissue contrast and resolution; rapid | Limited utility in bone and lung; CT also has improved cost and availability | Recent advances in lung cancer imaging; availability increasing | 1 |
| 2. Contrast enhanced imaging | Reflects permeable vasculature, increased blood volume, and perfusion | Not applicable to all tissues; timing crucial; limited standardization; expensive; other techniques also reflect tumor activity albeit with reduced resolution | New (larger) contrast agents; improved computing power and processing | 1 |
| 3. Permeability imaging | Based on application 2 above, but images can be quantitative; obtained simultaneously with imaging | Requires specialized sequences; other radiolabeled methods available albeit with poorer resolution | Functional information related to vasculature | 1 |
| 4. Perfusion/blood volume imaging | Based on application 2 above or uses intrinsic contrast mechanism, still developing; simultaneous with imaging | Requires specialized sequences; usually only provides relative changes | Functional information on drug delivery | 2 |
| 5. PK in situ (5FU) | Drug and metabolites in target tissue | High doses required (≥0.5 g/m 2 ); currently 19 F and 31 P only; applies to ∼10% of all drugs | 13 C-labeling permits detection of all drugs; hyperpolarization may increase sensitivity | 2 |
| 6. PK in vitro (5FU, ifosfamide) | Drug and metabolites in plasma, urine, etc. | Indirect; target tissue not sampled; less sensitive than HPLC, mass spectrometry, etc. | Improved sensitivity; all nuclei applicable | 2 |
| 7. Assessment of PME metabolism using 31 P | Changes in PME as a marker for proliferation | Poor resolution in vivo of the complex PME signal; PME changes are not quantitative | Higher-field magnetic resonance for improved resolution | 3 |
| 8. Assessment of PME and PDE as markers of pathway inhibition | Changes in PMEs and/or PDEs with inhibition of specific pathways | Different pathways may cause similar PME changes | Higher field may improve sensitivity | 3/4 |
| 9. Assessment of total choline using 1 H | Changes in total choline may be marker of grade and proliferation; higher sensitivity; better spatial resolution; hardware less complex | Cannot distinguish different choline-containing metabolites in vivo thus conflicting changes may be hidden | Possible to measure much wider range of disease; may inhibit specific pathways | 3 |
| 10. Measurement of hypoxia (SR-4554) | Trifluoro group provides high sensitivity | Exogenous probe administered at 1 g/m 2 , nonquantitative measurement of pO 2 | Detection of clinically relevant hypoxia | 3/4 |
| 11. Measurement of oxygenation (PFCs) | T1 provides sensitive and quantitative measure of pO 2 | Low solubility of PFCs; artefacts, e.g., macrophage uptake of PFCs | Intratumoral injection for regional pO 2 | 4 |
| 12. Measurement of lactate | Tumor grade and metastatic marker; glycolysis endpoint | Lipid suppression or complex measurement techniques required; currently only applicable for brain in clinic | Developments in data acquisition | 3/4 |
| 13. Measurement of pH | pHi and pHe measured simultaneously | Exogenous probe required for pHe; not relevant for all drugs | Cell uptake of weak electrolytes is pH-dependent | 4 |
| 14. Glucose utilization | Changes in rates of glycolysis using 19 F- or 13 C-labeling | Low sensitivity; high doses may alter tumor physiology/biochemistry | Improved modeling of glycolytic enzyme activity | 5 |
| 15. Assessment of fructose-1,6 bisphosphate using 31 P | Changes in fructose-1,6 bisphosphate as a marker for apoptosis | Poor resolution in vivo, not verified in animals in vivo; low sensitivity compared to other in vitro methods | Identification of chronology of apoptosis events | 6 |
| Computed tomography (CT) | ||||
| 1. Volumetric imaging | Excellent cross-sectional anatomy; good soft-tissue contrast; good visualization of bone | Soft-tissue contrast often less good than MRI; limited to direct transaxial views; other views can be reconstructed but may suffer resolution loss | Spiral CT aids volume rendition | 1 |
| 2. Contrast enhanced imaging | Uptake depends on perfusion and permeability; standard technique provides good contrast | Limited range of agents; some side effects, high radiation dose limits repeat studies and duration, including pediatric application | Enables wider application than magnetic resonance | 1 |
| 3. Permeability imaging | Based on application 2 above images can be quantitative | Requires special software; not widely used. Limited range of agents; some side effects, high radiation dose limits repeat studies and duration, including pediatric application | Can be included in wider range of studies | 3 |
| Ultrasound | ||||
| 1. Sectional imaging | High resolution cross-sectional images; new developments leading to 3-dimensional acquisitions; real-time imaging method; can characterize tissues based on a range of properties, such as scatter and speed of sound | Soft-tissue contrast can be limited by noise; images dependent on optical window into region; images are operator dependent; conventional imaging not registered to an orthogonal coordinate grid, limiting reproducibility; normally does not provide contiguous volume coverage; no documented record of entire volume, meaning audit trail more difficult than that for CT or MRI | Useful for size measurements | 1 |
| 2. Flow measurements | Can measure flow directly by Doppler shift; good for large vessels; good time resolution; can measure tissue perfusion | Hard to make truly quantitative | Can assess potential for drug delivery | 1 |
| 3. Contrast agents | New ultrasound contrast agents provide potential for functional measurements; microbubbles can be used for perfusion measurements; microbubbles are intravascular; can use with Doppler perfusion methods | Cannot measure vascular permeability | Can measure vascular input functions; potential for agents targeted at vascular endothelial surface receptors | 2 |
FDG = fluorodeoxyglucose; FMISO = fluoromisonidazole; FES = 16-α-18-fluoro-17-β-estradiol; FESP = fluoroethylspiperone; FIAU = 2′-fluoro-5-iodo-1-β-d-arabinofuranosyluracil; VEGF = vascular endothelial growth factor; PK = pharmacokinetics; 5FU = 5-fluorouracil; HPLC = high-pressure liquid chromatography; PME = phosphomonoester; PDE = phosphodiester; PFC = perfluorocarbon; pO 2 = partial pressure of oxygen; pHi = intracellular pH; pHe = extracellular pH.
The level of robustness of pharmacokinetic/pharmacodynamic techniques was evaluated according to the following criteria in descending order of proven robustness: 1 = in routine clinical use; 2 = evaluated in three or more clinical centers; 3 = in early clinical development; 4 = evaluated in three or more animal models; 5 = evaluation in progress in animal models; 6 = evaluated in extracts from cell/tissue culture models.
C OMPUTED T OMOGRAPHIC S CANNING
X-ray computed tomography (CT) scanning, the most widely employed method of transaxial imaging, is used in the diagnosis and staging of most soft-tissue and bone cancers and in the assessment of response ( 23 ) . CT scanning provides excellent soft-tissue contrast, allowing visualization of disease in three dimensions. Although CT has been the benchmark method of imaging soft-tissue disease for many years, its use for some applications is now being eclipsed by MRI ( 24 ) . In PD studies, CT is used mainly to measure changes in the volume of disease with treatment ( 25 ) . CT measurement of changes in disease volume is usually performed to support bidimensional assessments of response as recommended by the Union Internationale Contre le Cancer (UICC) ( 26 ) or unidimensional assessment of response, as recommended by Response Evaluation Criteria in Solid Tumors (RECIST) ( 27 ) , although its multislice capability also allows accurate assessment of tumor volume. CT can also be used with X-ray–dense contrast agents, such as iodinated materials, to assess some of the functional properties of tumors. Contrast agents have also been used to assess tumor perfusion ( 28 ) and are routinely used to define perfused areas of tissue and areas of blood–brain barrier breakdown. CT can also be helpful in determining the boundaries of the tumor and the extent of its invasion into adjacent tissues and can identify involvement of lymph nodes, particularly when such involvement has caused an increase in lymph node size or an abnormal lymph node appearance ( 23 ) . In clinical trials of innovative therapies, CT is most commonly used to assess the size of the primary tumor and the extent of metastatic disease.
U LTRASOUND S CANNING
Ultrasound is a relatively inexpensive means to obtain sectional images of tissue ( 29 ) . High-frequency sound is transmitted from a transducer that is placed in contact with the skin surface. Reflected or scattered sound is received back at the transducer, allowing images of scatter intensity to be reconstructed so that tissues are visualized in real time. Ultrasound is not readily transmitted through bone and is reflected strongly at air–tissue interfaces. Thus, this technique is limited to tissues that are not overlaid by bone or that are accessible through an ultrasound window. In addition to depicting tumor by contrast to other soft tissues, ultrasound scanning can distinguish tumor from fluid-filled compartments, such as cysts. Doppler ultrasound techniques have a high sensitivity for measuring blood flow. Current developments in ultrasound technologies include three-dimensional ultrasound imaging techniques ( 30 ) and the use of ultrasound contrast agents, which show promise in assessing vascular delivery of agents. Although ultrasound is of considerable assistance in diagnosis, its use for morphologic assessment in serial studies is limited because the technique is operator dependent, which makes it difficult to reproduce imaging planes. Color Doppler ultrasound measurements ( 31 ) have been used to assess tumor response to conventional therapies; as with other modalities, contrast agents may also prove helpful ( 32 ) . The major application of ultrasound in therapeutic trials is to assess changes in tumor size. Ultrasound scanning using microbubble contrast agents has potential value in the measurement of perfusion in response to antivascular and antiangiogenic agents ( 33 , 34 ) .
M AGNETIC R ESONANCE T ECHNIQUES
MRI and, to a lesser extent, MRS are beginning to have important roles in anticancer drug trials. MRI is routinely used in the initial evaluation of tumor size, shape, and anatomic appearance, and changes in these parameters during therapy can be used to assess and quantify the PD effects of a drug. In addition, dynamic contrast-enhanced MRI (DCE-MRI) is proving increasingly valuable for assessing PD endpoints ( 35 ) . Other MRI approaches, as well as MRS, also have PD applications, and in some cases MRS can even be used for minimally invasive monitoring of anticancer drug uptake and metabolism. Almost all major hospitals in the developed world have access to MRI instruments for routine use, and such instruments are already widely used in drug trials for morphologic estimation of tumor size. Because MRI (including DCE-MRI and diffusion-weighted MRI) uses the isotope 1 H, most MRI instruments with a field strength of 1.5–3 T currently in clinical service can easily be adapted to perform 1 H MRS. By contrast, MRS studies with the natural isotopes 31 P or 19 F require broad-band systems, which are currently available only at research centers.
The high concentration of 1 H present in tissue water (80–90 M) enables magnetic resonance images to be obtained. MRI is now the method of choice for diagnostic imaging of tumors in many areas of the body. Although MRI does not directly show bone, it can, unlike CT, be used to obtain images directly in arbitrary orientations or in three dimensions, without being limited by radiation dose. MRI also often provides better soft-tissue contrast than other methods because the measurements can be manipulated to provide a wide range of contrasts for given tissues. Centers with MRS facilities routinely use both MRS and MRI in combination in the clinic and increasingly in the laboratory to define a volume from which chemical information is then obtained.
Magnetic Resonance Imaging
MRI provides excellent information on morphology and is useful for defining tumor location, for detecting and measuring the extent of local invasion, and for detecting more distant dissemination. Increasingly, MRI also provides a range of functional measures of physiology and the local tissue matrix ( 36 ) .
MRI contrast agents, which have magnetic properties that change the image signal intensity, provide an important means of obtaining functional information and facilitate the morphologic evaluation of tumors. Contrast agents constitute a rapidly developing field in MRI ( 36 – 38 ) , which we will not review here in detail; instead, we focus on methods used in drug trials. At present, the main contrast agents licensed for use in patients are gadolinium-based (e.g., gadolinium diethyltriaminepentaacetic acid [Gd-DTPA]). Gd-DTPA is a low-molecular-weight contrast agent in routine clinical use for enhancing the visibility of lesions in magnetic resonance images. Its effects are particularly clear for brain lesions because, although the agent does not cross the normal blood–brain barrier, it can leak out of abnormal vessels present in tumors ( 39 , 40 ) . Judgments about the nature and size of a lesion are based on a qualitative assessment of altered contrast agent uptake compared with the surrounding normal tissue. These MRI examinations have evolved from simple comparisons of images taken before and after injection of a contrast agent to evaluations of sets of images obtained every few seconds following injection (DCE-MRI). These serial evaluations have led in turn to a variety of quantitative methods for assessing the kinetics of the contrast agent in the tumor that are already being widely applied in drug trials ( Fig. 2, A and B ). The kinetic parameters derived from such measurements depend on tumor perfusion and on the permeability–surface area (PS) product of the tumor blood vessels for the contrast agent ( 41 , 42 ) ; when tumor perfusion is very high and the PS product is low, the parameter Ktrans (volume transfer constant between blood plasma and extravascular extracellular space) is similar to the PS product, and when tumor perfusion is low and the PS product is high, the behavior of Ktrans is dominated by flow. Tumors typically show high inter- and intravariability with respect to whether Ktrans is dominated by flow or perfusion. These properties may be analyzed on the basis of mean changes within a defined region of interest or by using pixel-by-pixel mapping of properties throughout the tumor ( 43 , 44 ) . By examining changes during the first pass of the agent through the vascular bed, it is possible to obtain information on relative blood volume and perfusion ( 45 , 46 ) .
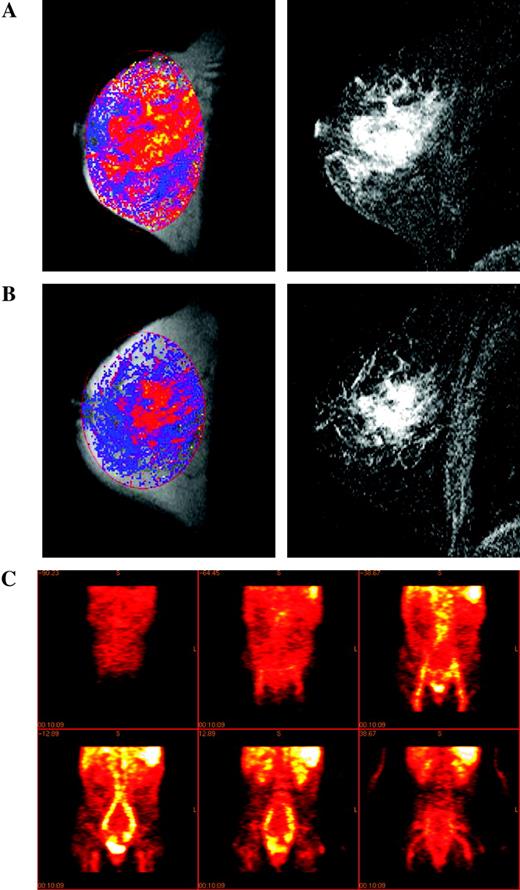
Measuring angiogenic and vascular change. Magnetic resonance images of a grade 2 infiltrating lobular breast cancer in a 49-year-old patient before ( A ) and after ( B ) treatment with cyclophosphamide and doxorubicin. Left panels : images of Ktrans scaled to a maximum of 1 min −1 where Ktrans is displayed using a color scale in which low values are dark blue and high values are yellow (absence of color indicates no value fitted); right panels : two-dimensional gradient echo subtraction images showing areas of contrast enhancement in white. Courtesy of Dr. A. Padhani, The Institute of Cancer Research and Royal Marsden Hospital. C ) Coronal sections showing the distribution of 124 I-labeled anti-vascular endothelial growth factor (VEGF) receptor antibody (low uptake, dark red ; high uptake, white ) given concurrently with the phase I treatment in a patient with metastatic colorectal cancer (imaging at 24 hours after treatment). Reproduced by permission of Oxford University Press from Jayson et al. ( 134 ) .
Despite uncertainties about the precise physiologic interpretation of parameters derived from DCE-MRI, its wide availability for both clinical and preclinical research has led to considerable interest in its use for the evaluation of tumor vasculature before and after treatment. Recommendations for the use of DCE-MRI in the evaluation of novel antiangiogenic and antivascular therapeutics have recently been published ( 47 , 48 ) . Large-molecular-weight contrast agents (often used as “blood-pool” agents), such as ferric oxide particles coated in dextran ( 49 ) and Gd-based cores linked to dendrimers to increase the hydrodynamic radius ( 50 ) , are being introduced. The clinical use of these agents has been driven by the needs of diagnostic radiology (for example, as a way to visualize lymph node involvement and to enhance magnetic resonance angiography), but quantitative approaches yield important parameters such as vascular volume and the permeability of tumor vessels to such large particles ( 51 , 52 ) . These agents have not yet been licensed for clinical blood pool or permeability studies. In parallel with the introduction of these macromolecular agents for clinical use, preclinical studies have used gadolinium-labeled albumin to provide similar kinds of information ( 53 ) . Although quantitative MRI assessments of tumor vasculature with blood pool agents are in their infancy, the parameters they provide may have a less ambiguous physiologic interpretation than those obtained from Gd-DTPA uptake kinetics. Overall, DCE-MRI provides a range of powerful techniques to detect PD changes in treated tumors, especially changes related to the vasculature.
Studies of dynamic contrast agents that assess vascular permeability and/or blood flow are rapidly developing as important methods of assessing PD endpoints in, for example, patients with bladder, bone, or soft-tissue cancers ( 54 – 58 ) . DCE-MRI has been incorporated into phase I clinical trials of the antivascular agents 5,6-dimethylxanthenone-4-acetic acid ( 59 ) , combretastatin-A4-phosphate ( 60 ) , and ZD6126 ( 61 ) . In these trials, a decrease in the kinetics of contrast agent uptake in patients who received relatively high doses of drugs was interpreted as a reduction in blood flow. DCE-MRI has also been shown to provide a good measure of response in patients receiving androgen-inhibiting treatment for prostate cancer ( 62 ) , and it has been used to assess responses to primary medical therapy in breast cancer ( 63 ) . Vascular permeability, an important parameter monitored by DCE-MRI, is a characteristic of angiogenesis because the VEGF-dependent neovasculature is characteristically leaky. The marked reduction in kinetics of contrast agent uptake observed in prostate cancer is believed to result from inhibition of VEGF by androgen blockade. DCE-MRI techniques have also been employed in several hypothesis-driven phase I clinical trials of new antivascular and antiangiogenic therapeutics ( 59 – 61 , 64 ) . A strength of DCE-MRI is that it allows the whole tumor, or a section through it, to be characterized either on a pixel-by-pixel basis or by evaluation of the mean parametric change for a defined region of interest. Histogram analysis of the pixel-by-pixel data has proven helpful for analyzing responses in heterogenous tumors, although more sophisticated analytic approaches are being developed. It is likely that assessment of perfusion will also be helpful for some tumors, particularly those in the brain, where changes that precede the blood–brain barrier breakdown or that follow its repair may be informative. DCE-MRI techniques may be particularly useful in assessing the likelihood of a therapeutic agent reaching tumor cells.
One new MRI approach that is being used to assess tumors in vivo involves the attachment of functional contrast agents to specific ligands or targeting moieties ( 65 ) . An alternative approach uses contrast agents designed so that they act as a substrate for an existing cellular process or can be activated in situ, for example, by being designed as a substrate for a specific enzyme ( 66 – 69 ) . This promising area of research may yield new PK endpoints, although currently developments are at the early preclinical stage. MRI would benefit from the availability of more specific agents that target identified cellular processes.
Diffusion-weighted MRI does not involve administration of a contrast agent but can be used to measure parameters associated with the rate and distance of water molecule diffusion ( 70 ) that may reflect drug access ( 71 ) . Both diffusion-weighted MRI and DCE-MRI may indicate changes in tumor anatomy and physiology during therapy.
Magnetic Resonance Spectroscopy
MRS is the only noninvasive in vivo method for chemically distinguishing between, and measuring the concentrations of, biochemical compounds (or drugs and their metabolites), and it is beginning to have applications in drug trials. Instead of providing an anatomic image, MRS data are usually visualized in the form of a spectrum, in which the peaks correspond to different chemicals ( 72 ) , although low-resolution spatial images corresponding to different chemical concentrations can also be produced. Thus, MRI techniques can be used to define a volume in a tumor (or in normal tissue) and MRS can then be used to measure the concentration of endogenous biochemical compounds (or drugs) in that volume in real time. Most of the early work on human tumors other than brain or prostate tumors ( 73 ) was performed using 31 P-MRS. However, in recent years there has been much interest in the use of 1 H-MRS for breast ( 74 ) , cervical ( 75 ) , and other tumors because of its better sensitivity and, consequently, spatial resolution compared with 31 P-MRS ( 72 ) .
PD studies can use MRS to measure the concentration of endogenous metabolites, such as adenosine triphosphate (ATP), phosphomonoesters (e.g., phosphocholine), or inorganic phosphate ( Table 1 ); intracellular pH (with the use of 31 P-MRS); or the concentrations of lactate, choline compounds, inositol compounds, creatine compounds, and glutamine/glutamate (with the use of 1 H-MRS). Many PD studies have been performed using animal tumor models, usually with the use of 31 P-MRS. Animal tumor models often display large changes in energy metabolism during therapy, something that is rarely seen in tumors in patients. However, clinical 31 P-MRS studies in many tumor types, notably non-Hodgkin lymphoma ( 76 ) and breast cancer ( 77 , 78 ) , have shown that changes in the phosphomonoester peak are associated with response to treatment and that these changes may be a marker for changes in proliferation ( Fig. 3, A and B ). Other studies in cultured cells and animal models have shown that tumor cells display marked changes in the MRS spectrum as they undergo apoptosis ( Fig. 4, A and B ) ( 79 – 81 ) . Additional studies have investigated the effectiveness of 1 H-MRS in assessing response. For example, two studies ( 82 , 83 ) found that a decrease in total choline (a composite signal derived predominantly from choline-containing compounds) was associated with response to chemotherapy in glioma—specifically, with changes in permeability and size ( Fig. 3, C and D ). In another study, a decrease in total choline was associated with response to chemotherapy in lymphoma and germ cell tumors ( 84 ) .
![Assessing response via metabolic change. A ) Localization image for 31 P magnetic resonance spectroscopy showing a single voxel positioned over a breast tumor. B ) 31 P magnetic resonance spectra obtained from the region defined in A before (pretreatment), during (week 5 and week 20), and after (week 31) a course of chemotherapy, showing an initial increase in all metabolites (week 3) followed by a marked reduction in metabolite signals with treatment (weeks 20 and 31). Reproduced with permission from Leach et al. ( 77 ) , copyright John Wiley and Sons Limited. C ) Pretreatment fluid-attenuated inversion recovery ( top ) and T2-weighted fast spin-echo ( bottom ) images from a patient with low-grade glioma receiving treatment for recurrent disease, showing the position of voxels selected for spectroscopy. D ) Serial 1 H spectroscopy measurements from the same patient showing long echo time (TE =135 ms) stimulated-echo acquisition mode spectra obtained before ( a ) and at ( b ) 3 months, ( c ) 6 months, and ( d ) 9 months after initiation of temozolomide treatment. Within both series, a progressive decrease in the choline/creatine (Cho/Cre) ratio was observed, suggesting reduced membrane metabolism and diminishing cellular density. Also note the increasing conspicuity of the N-acetylaspartate (NAA) peak, a specific neuronal marker whose level may reflect the regression of tumoral tissue and repopulation of normal brain matter. First published in Murphy et al. ( 83 ) . E ) In vitro 31 P magnetic resonance spectra of cell extracts obtained from human colon adenocarcinoma HT29 cells treated with the Hsp90 molecular chaperone inhibitor 17-allylamino,17-demethoxygeldanamycin (17AAG) ( top ) or with vehicle ( bottom ). F ) In vivo 31 P magnetic resonance spectra of a HT29 tumor xenograft before ( top ) and after ( bottom ) 17AAG treatment. Reproduced by permission of Oxford University Press from Chung et al. ( 106 ) . G ) Fluorodeoxyglucose positron emission tomography (FDG PET) images of a patient before ( top panels ) and 8 hours after ( bottom panels ) imatinib treatment ( left panels: coronal view; right panels: sagittal view) showing two rectal gastrointestinal stromal tumors behind the bladder and a liver metastasis. All tumors showed reduced uptake of tracer at 8 hours. Courtesy of Dr. H. Minn, University of Turku, Finland; reproduced by permission of Taylor & Francis Ltd. (http://www.tandf.co.uk/journals) from Joensuu et al. ( 123 ) . H ) [ 11 C]Thymidine scans of a patient with Ewing's sarcoma ( i ) before and ( ii ) after combination chemotherapy. The white areas indicate regions of highest tracer uptake. Combination chemotherapy resulted in decreased uptake of radiolabel. Resection revealed almost complete histologic response. Redrawn from Gupta et al. ( 111 ) , reprinted with permission from Elsevier. GPC = glycerophosphocholine; GPE = glycerophosphoethanolamine; PC = phosphocholine; PCr = phosphocreatine; PME = phosphomonoester; Pi = inorganic phosphate; ppm = chemical shift in parts per million; NTP = nucleoside triphosphate.](https://oup.silverchair-cdn.com/oup/backfile/Content_public/Journal/jnci/98/9/10.1093_jnci_djj162/2/m_jncidjj162f03_4c.jpeg?Expires=1716525462&Signature=j6QDyJJg4Ig~p8JvXeZYTXarr~16HQZh-XuQE7Oo~wBTDCWOdqJfxbt6iLVaJgYeE7mrMLP3qK9725CSsdd6Ic6T249tKH5FHibPmjdE03pXzxgyF5Djg-T~j0U7URHU0ZbXUbH-AlapfiHAEL05DKUNicCaseiTlQP8~pEFktLJry9-APi6bGae9EimryJbZGj9kLBUWRJOfQNdijZKDn~XrOyoGKTg0c5yJ9sVbYMvOYE81mSnM9aRN2m4epe4FoaNyrzxX4173yxI5vn1yYkp9ShG~izbDpUIyKLODwtBWcf6zpS4Lj5bKmWinKUfK7A2x3E2L74T~ZeXBqG~NA__&Key-Pair-Id=APKAIE5G5CRDK6RD3PGA)
Assessing response via metabolic change. A ) Localization image for 31 P magnetic resonance spectroscopy showing a single voxel positioned over a breast tumor. B ) 31 P magnetic resonance spectra obtained from the region defined in A before (pretreatment), during (week 5 and week 20), and after (week 31) a course of chemotherapy, showing an initial increase in all metabolites (week 3) followed by a marked reduction in metabolite signals with treatment (weeks 20 and 31). Reproduced with permission from Leach et al. ( 77 ) , copyright John Wiley and Sons Limited. C ) Pretreatment fluid-attenuated inversion recovery ( top ) and T2-weighted fast spin-echo ( bottom ) images from a patient with low-grade glioma receiving treatment for recurrent disease, showing the position of voxels selected for spectroscopy. D ) Serial 1 H spectroscopy measurements from the same patient showing long echo time (TE =135 ms) stimulated-echo acquisition mode spectra obtained before ( a ) and at ( b ) 3 months, ( c ) 6 months, and ( d ) 9 months after initiation of temozolomide treatment. Within both series, a progressive decrease in the choline/creatine (Cho/Cre) ratio was observed, suggesting reduced membrane metabolism and diminishing cellular density. Also note the increasing conspicuity of the N-acetylaspartate (NAA) peak, a specific neuronal marker whose level may reflect the regression of tumoral tissue and repopulation of normal brain matter. First published in Murphy et al. ( 83 ) . E ) In vitro 31 P magnetic resonance spectra of cell extracts obtained from human colon adenocarcinoma HT29 cells treated with the Hsp90 molecular chaperone inhibitor 17-allylamino,17-demethoxygeldanamycin (17AAG) ( top ) or with vehicle ( bottom ). F ) In vivo 31 P magnetic resonance spectra of a HT29 tumor xenograft before ( top ) and after ( bottom ) 17AAG treatment. Reproduced by permission of Oxford University Press from Chung et al. ( 106 ) . G ) Fluorodeoxyglucose positron emission tomography (FDG PET) images of a patient before ( top panels ) and 8 hours after ( bottom panels ) imatinib treatment ( left panels: coronal view; right panels: sagittal view) showing two rectal gastrointestinal stromal tumors behind the bladder and a liver metastasis. All tumors showed reduced uptake of tracer at 8 hours. Courtesy of Dr. H. Minn, University of Turku, Finland; reproduced by permission of Taylor & Francis Ltd. (http://www.tandf.co.uk/journals) from Joensuu et al. ( 123 ) . H ) [ 11 C]Thymidine scans of a patient with Ewing's sarcoma ( i ) before and ( ii ) after combination chemotherapy. The white areas indicate regions of highest tracer uptake. Combination chemotherapy resulted in decreased uptake of radiolabel. Resection revealed almost complete histologic response. Redrawn from Gupta et al. ( 111 ) , reprinted with permission from Elsevier. GPC = glycerophosphocholine; GPE = glycerophosphoethanolamine; PC = phosphocholine; PCr = phosphocreatine; PME = phosphomonoester; Pi = inorganic phosphate; ppm = chemical shift in parts per million; NTP = nucleoside triphosphate.
Other in vivo PD magnetic resonance methods are used to measure hypoxia, oxygenation, and glucose utilization. Hypoxia can be measured by using a fluorinated hypoxia-imaging agent, such as SR-4554, which has low toxicity and is currently undergoing clinical trials ( Fig. 5, A ) ( 85 – 87 ) . Oxygenation can be measured by using organofluorine compounds that have a high affinity for oxygen, such as perfluorocarbons; however, several problems (including nonuniform delivery and distribution within tumors) currently preclude their clinical use. Tumors are highly glycolytic, and this property has permitted their detection and staging by using PET images of 18 F-fluorodeoxyglucose ( 18 FDG). Changes in 18 FDG metabolism can be an early indicator of tumor response. MRS of 19 FDG ( 88 ) and 13 C-glucose ( 89 ) has also been used in research settings to detect various aspects of glucose uptake and metabolism.
For PK studies, it is possible, in principle, to monitor drug concentrations in the tumor, liver, kidney, and other major organs where the drug may accumulate ( Fig. 6, A–D ) ( 90 – 92 ) . Thus, drug retention, metabolism, and elimination can be studied in the target tissue by using MRI techniques to define a volume within a tumor (or in normal tissue), followed by MRS to measure the concentration of the drug and its metabolites in real time. The advantage of this approach is that nothing (other than the drug) is administered, no samples are taken, and no ionizing radiation is used.
The molecular structures of certain agents (e.g., the presence of a nucleus with an easily detected MRS signal) enable PK studies of parent drugs and metabolites using direct detection by MRS. For example, the fluorine atom has very high magnetic resonance sensitivity (83% that of the most sensitive stable nucleus, 1 H), and there is no background fluorine signal in living tissue. Fluorine-containing drugs such as 5-fluorouracil (5FU), one of the most widely used anticancer agents, are thus particularly well suited to MRS studies, many of which have been performed in animals and patients. So far, studies in patients have been restricted to 5FU, its prodrug, capecitabine, and the difluorinated drug gemcitabine using 19 F-MRS ( 93 – 95 ) , and to ifosfamide and cyclophosphamide using 31 P-MRS ( 96 ) . The elimination rate of 5FU from tumors in patients is associated with response, allowing an early prediction of the likely success or failure of a treatment regimen ( 93 ) . It has recently become possible to routinely detect fluoronucleotides, the active species of 5FU that are formed in the tumor cell, in 1.5-T 19 F spectra ( 97 ) .
MRS can also be used to detect endpoints in antibody-directed, protein-directed, and gene-directed enzyme prodrug therapy. For example, MRS using the 19 F-containing drugs 5-fluorocytosine and gemcitabine can be used to determine the success or failure of gene or protein delivery ( 98 ) .
Other nuclei that will be useful in the study of anticancer drug PK are 1 H [which has thus far only been used to detect iproplatin in mice ( 99 ) ] and 13 C ( 100 ) . The latter nucleus differs from previously mentioned nuclei in that it is present only in very small amounts (i.e., 1.1%) in natural carbon; thus, it is necessary to synthesize a 13 C-labeled sample of the drug (note that 13 C is not radioactive). In this respect, this particular MRS approach resembles PET, in which synthesis of drug analogs containing radionuclides is required (see next section).
MRS has two advantages compared with imaging methods that use radiolabels. First, with MRS, it is often possible to distinguish between the substances that give rise to the signals, which permits minimally invasive monitoring of drug metabolism in the tumor. In principle, this MRS method can allow for more complete PK modeling, for example, by identifying routes of excretion ( 101 ) . Thus, novel anticancer drugs can first be assessed in preclinical experiments, in which drug metabolites can be identified and assigned, modeling applied, mechanisms of action clarified, and suitable clinical protocols designed. By contrast, with fluorine- or phosphorus-containing agents the native drug is used for MRS and hence synthesis of a labeled analog is not required. In principle, it should be possible to detect almost any drug if it is labeled with 13 C; however, because 13 C-labeled precursors are expensive, and every molecule of the drug must contain the label, the routine use of tracer doses is not feasible. Thus far, the only study of a 13 C-labeled drug has been of temozolomide in mice ( 100 ) .
The major limitation of MRS for PK is its lack of sensitivity ( Table 1 ); in general, only drugs given in quantities of approximately 0.5 g/m 2 can be detected. Thus, PK studies, even those in animals, can extend over a concentration range of only approximately 1 order of magnitude. Nevertheless, if a fluorine- or phosphorus-containing drug is in clinical trials, consideration should be given to including MRS studies in the trial. The sensitivity of MRS is not a serious limitation for PD studies that involve the detection of endogenous metabolites present in millimolar concentrations, such as lactate, ATP, phosphomonoesters, or phosphodiester compounds. Recent developments in hyperpolarization ( 102 ) show considerable potential for increasing the sensitivity of MRS PK studies.
Table 1 summarizes methods currently available in magnetic resonance that could be applied in the development of a new drug. As an example of this approach, it is possible to hypothesize that applications 1, 4, 5, 6, and 9 could be used together to provide surrogate markers for use in clinical trials of a novel fluorinated antimetabolite drug active at high doses (≥0.5 g/m 2 ) that inhibits cell proliferation and the growth of solid tumors. MRS methods for PK can be used at a late preclinical stage and in phase I and II trials, either in situ for liver and tumor or ex vivo for analysis of body fluids and tumor biopsies. These studies could establish whether minimal efficacious doses actually reach the tumor and, if appropriate, whether the drug is metabolized to cytotoxic species. In clinical trials, MRI-based PD methods could determine whether the drug had a measurable effect on tumor size, functional volume, permeability, or perfusion. However, these MRI studies could be preceded by 1 H- and/or 31 P-MRS to measure changes in energy metabolism, pH, and choline metabolism before effects on tumor size become apparent. These PD MRS techniques could also eventually be used routinely in the clinic to permit early detection of nonresponding tumors. For responding tumors, these PD MRS techniques could be used in conjunction with PK assays to optimize treatment (e.g., dose scheduling). MRS can also provide measures of specific molecular processes in vivo. For example, an increase in fructose-1,6-bisphosphate concentration is a sensitive measure of apoptosis in some in vitro cell systems. It is apparent early in the apoptotic process and is believed to reflect poly(adenosine diphosphate-ribose) polymerase activation ( Fig. 4, A ) ( 103 ) . Ras activation can lead to increased levels of phosphocholine ( 104 ) . Pharmacologic blockade of Ras signaling with prototype mitogen-activated protein kinase kinase 1/2 (MEK1/2) inhibitors leads to a decrease in the phosphocholine signal that is associated with inhibition of extracellular signal-regulated kinase 1/2 (ERK1/2) phosphorylation ( 105 ) . The heat shock protein inhibitor 17-allylamino,17-demethoxygeldanamycin (17AAG) increases levels of phosphomonoesters and phosphodiesters in cancer cells and in human tumor xenografts ( Fig. 3, E–F ) ( 106 ) . These markers are currently being evaluated in phase I and II clinical trials of 17AAG.
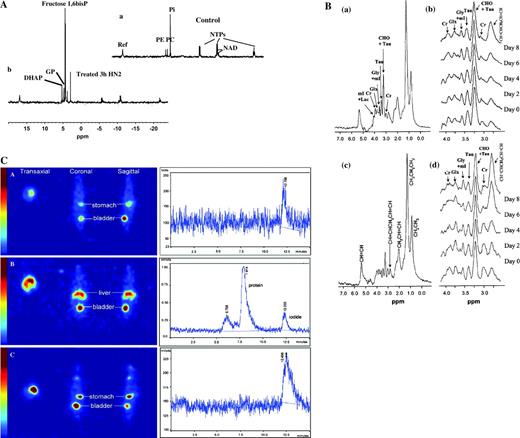
Detecting apoptosis and cell death. A ) 31 P magnetic resonance spectra of extracts from ( a ) control untreated murine lymphocytic leukemia L1210 cells and ( b ) L1210 cells after 3 hours of treatment with 50 μM alkylating nitrogen mustard mechlorethamine (HN2), showing early metabolic effects of apoptotic cell death. Spectra are the result of 10 000 scans plotted with a line broadening of 0.5 Hz. First published in Ronen et al. ( 79 ) . DHAP = dihydroxyacetone phosphate; GP = glycerol-3-phosphate; fructose 1,6bisP = fructose 1,6-bisphosphate; ref = reference line (methylenediphosphonic acid); PE = phosphoethanolamine; PC = phosphocholine; Pi = inorganic phosphate; NTPs = nucleotide triphosphates (including nucleotide di-phosphates); NAD = nicotinamide-adenine dinucleotide. B ) In vivo stimulated-echo acquisition mode ( a and b ) and localization by adiabatic selective refocusing ( c and d ) spectra from rat brain BT4C gliomas. These water-suppressed 1 H nuclear magnetic resonance spectra were obtained from a tumor volume preselected from T2-weighted magnetic resonance images (not shown). Cr = creatine; Glx = glutamate and glutamine; Gly = glycine; Lac = lactate; mI = myo-inositol; Tau = taurine; ppm – chemical shift in parts per million. In c , lipid peaks are assigned according the chemical groups giving rise to the resonance. In b and d , the spectra are referenced to a fixed height of the choline (CHO)-containing metabolite peak. Day 0, Day 2, etc., refer to days 0 (pretreatment) through 8 of ganciclovir treatment. Reproduced with permission from Lehtimaki et al. ( 81 ) . C ) 124 I-Annexin V distribution in vivo. Positron emission tomography images ( left ) and corresponding liver high-pressure liquid chromatography traces ( right ) of an untreated mouse ( top panels ), an anti-Fas-treated mouse ( middle panels ) both 2 hours after intravenous injection with 5 MBq 124 I-annexin V and (at bottom) an treated anti-Fas-treated mouse 2 hours after intravenous injection with 5 MBq 124 I-ovalbumin. Mice injected with 124 I-annexin V were given potassium iodide intraperitoneally 2 hours before radioligand injection. The mouse injected with 124 I-ovalbumin received oral potassium iodide for 4 days before radioligand injection. Anesthesia was maintained with halothane (3%–3.5%, 2 L/min) and image data were acquired for approximately 1 hour. Reprinted from Keen et al. ( 140 ) , with permission from Elsevier.
Increases in the magnetic field (and thus sensitivity) of MRS instruments are addressing the method's sensitivity problem. Use of the higher field MRS systems (2.0–8.0 T) now available for clinical research will substantially improve the sensitivity limits of MRS. Preclinical studies are typically performed at 4.7–11.8 T. MRS scans of brain tumors with the current generation of 1.5-T instruments can be carried out during routine MRI examinations and take only about 20 minutes. Studies on anticancer drugs usually take longer; a typical scan lasts approximately 30 minutes, and longer scans may be necessary to obtain useful PK parameters. Recommendations for standardization of clinical MRS measurements, based on an international workshop, have been published ( 107 ) .
MRI already plays an important role in conventional assessments of response to therapy. The ability to complement highly detailed morphologic information with information on function and metabolism provides a powerful tool for assessing novel mechanism-based therapeutics in both the preclinical and clinical settings. Although magnetic resonance has limited sensitivity for direct PK assessments (see Table 1 ), its chemical specificity allows drugs and metabolites to be identified, so that in the future, it may be possible to radically improve sensitivity by using hyperpolarization techniques ( 108 ) . The specificity of MRI techniques in PD assessment is also likely to grow as new families of biologically targeted contrast agents are developed ( 109 ) .
P OSITRON E MISSION T OMOGRAPHY
PET allows dynamic, noninvasive measures of the three-dimensional distribution of a positron-labeled compound within the living body. After injection of a labeled compound, the radioisotope decays and emits a positron that travels a short distance and is annihilated by colliding with an electron. The annihilation produces two 511-keV photons, which propagate at an approximate 180° angle away from each other and can be detected within a short time (typically 19 nanoseconds). The summation of many such events provide the distribution of the radiotracer. Both tumor and normal tissues (including liver, brain, heart, vertebrae, spleen, kidney, and muscle) in the field of view can be evaluated ( 110 ) . Over the past few years, there has been a major increase in the use of PET in oncology ( 111 ) . There are now several examples in which the capabilities of this technology in anticancer drug development have been demonstrated in terms of PK and PD ( Table 1 ).
PET can be used to evaluate intratumoral and normal tissue PK in patients prior to phase I studies (pre-phase I) or as part of phase I and II studies ( Fig. 6 E ) ( 112 ) . This objective can be achieved by labeling the drugs of interest with positron-emitting isotopes such as 11 C, 18 F, 124 I, or 13 N. The chemical identities and, hence, the physicochemical properties of drugs are retained following radiolabeling. Typical examples of drugs that have been evaluated by PET in patients include 18 F-5FU ( 113 ) , 11 C-temozolomide ( 114 ) , 13 N-cisplatin ( 115 ) , 11 C-1,3-bis(2-chloroethyl)-1-nitrosourea ( 11 C-BCNU) ( 116 ) , 18 F-tamoxifen ( 117 ) , and 11 C-N-[2-(dimethyl-amino)ethyl]acridine-4-carboxamide ( 11 C-DACA) ( 118 ) . In the case of temozolomide, the proposed mechanism of action of the drug, involving DNA methylation, was evaluated in patients by using 11 C-temozolomide tracers labeled at the methyl and carbonyl positions ( 119 ) . That study demonstrated that temozolomide undergoes tissue-specific ring-opening in humans, although this conformational change was not tumor-specific. Preclinical labeling and PET imaging of macromolecules such as 18 F-labeled antisense oligonucleotides is currently being pursued ( 120 ) .
Despite the increasing number of potential radiotracers in oncology (see Table 1 ), PET is still generally synonymous with 18 FDG imaging because most centers worldwide employ this radiotracer for diagnostic imaging. However, changes in 18 FDG uptake reflect inflammatory responses as well as tumor response but make 18 FDG imaging less specific for general use. Changes in 18 FDG uptake can occur within hours after treatment or can take several days to weeks, as a result of cell death. For example, in patients with gastrointestinal stromal tumors who are treated with imatinib ( 121 ) , early changes in 18 FDG presumably reflect the direct effect of imatinib on glucose metabolism ( Fig. 3, G ) ( 122 , 123 ) .
PD studies that can be performed by PET can be grouped into those that employ generic versus specific biologic endpoints. In the case of studies that employ generic endpoints, opportunities exist for monitoring changes in cellular proliferation with 11 C-thymidine ( Fig. 3, H ) ( 111 , 124 ) , glucose utilization with 18 FDG ( 125 ) , tissue perfusion with 15 O-H 2 O ( 126 ) , and blood volume with 15 O-CO ( 127 ) . A less readily metabolized analog of 11 C-thymidine, 18 fluorothymidine, can be used to monitor DNA synthesis and cellular proliferation ( 128 ) . Other generic endpoints that have been monitored by PET include amino acid metabolism with 11 C-methionine ( 129 ) or methyl-fluoro-dopa ( 130 ) and tricarboxylic acid cycle activity with 11 C-acetate ( 131 ) . We envisage that evaluation of these generic endpoints will be used increasingly to assess the effects of novel therapeutics in the future.
Specific biologic endpoints are undergoing preclinical and clinical validation to provide proof of principle for the proposed mechanism of action of existing and novel therapies. Examples of such endpoints include detection of thymidylate synthase in-hibition with 11 C-thymidine ( 132 ) ; detection of VEGF or VEGF receptor expression with 124 I-labeled antibodies and peptides ( Fig. 2, C ) ( 133 , 134 ) ; detection of overexpression of ErbB2 receptors with 68 Ga-labeled anti-ErbB2 antibody ( 135 ) ; evaluation of estrogen receptor status with 16-α- 18 fluoro-17-β-estradiol ( 136 ) ; detection of hypoxia with 18 fluoromisonidazole ( 137 ) , other 18 F-labeled 2-nitroimidazoles ( Fig. 5, B ) ( 138 ) , and 60 Cu-based probes ( 139 ) ; imaging of apoptosis with 124 I-annexin V by PET ( Fig. 4, C ( 140 ) and 99m Tc-hydrazinonicotinyl ( 99m Tc-HYNIC) annexin V single-photon emission computed tomography (SPECT) ( 141 – 144 ) ; and imaging of alpha-V-beta-3 integrin receptor expression with 18 F- and 64 Cu-arginine-glycine-aspartate (RGD)-based peptides ( 145 , 146 ) . With the advent of several gene therapy approaches, PET methods are also being developed to monitor gene expression in vivo. Most of those methods employ a marker gene, such as those encoding the Herpes simplex virus 1-thymidine kinase, the dopamine D2 receptor, or the sodium iodide symporter, and a marker substrate, such as 124 I-2′-fluoro-5-iodo-1-β-d-arabinofuranosyluracil (FIAU), 3-(2′- 18 fluoroethyl)spiperone, or Na 124 I, respectively ( 147 – 150 ) . In this way, proof that these reporter–substrate pairs detect gene expression has been demonstrated in human tumor xenograft models ( 147 – 150 ) and in patients with recurrent glioblastomas ( 151 ) . In addition, PET methods are currently being developed for monitoring drug resistance. For instance, 11 C-daunorubicin– and 11 C-verapamil–PET have been employed to monitor the P-glycoprotein–mediated multidrug resistance phenotype in rodent tumors ( 152 ) .
![Monitoring hypoxia. A ) Measurements of the hypoxia marker SR-4554. i ) Magnetic resonance image of a patient showing a leiomyosarcoma of the left thigh (T2-weighted image). ii–iv ) 19 F magnetic resonance spectra (MRS) of the tumor acquired from the same patient at ( ii ) 2.18 hours, ( iii ) 7.98 hours, and ( iv ) 27.50 hours after the start of SR-4554 infusion (1600 mg/m 2 ). Unlocalized spectra were acquired using a 10-cm surface coil and a 1.5-T magnetic resonance system (2048 transients acquired over 34 minutes, repetition time 1 second). v ) Quantification of the 19 F signal detected from the tumor at time points after the start of the intravenous infusion at a dose of 1600 mg/m 2 with an infusion time of 63 minutes. The graph compares concentrations of SR-4554 detected by 19 F MRS in the tumor, in which a fraction may be bound in hypoxic tissues and thus not be cleared as rapidly as in plasma, and the concentrations of the parent SR-4554 in plasma detected by ultraviolet high-pressure liquid chromatography (HPLC). Reproduced from Seddon et al. ( 87 ) . B ) [ 18 F]Fluoroetanidazole–positron emission tomography images of HT1080 human fibrosarcoma tumor-bearing mice acquired on the small-animal quad-HiDAC scanner (cubic voxels of side: 0.5 mm). a ) Three-dimensional (volume-rendered) image of an HT1080/1-3C tumor-bearing mouse (showing data acquired over the period 30–60 minute postinjection) showing a dorsal view of the mouse. Here, pixel values are defined by the maximum voxel value in corresponding lines in the z-axis. Arrows point to tumor (Tm), kidneys (Ki), small intestine (In), and urinary bladder (Bl). b ) Sagittal (0.5 mm) slice of data acquired over the period 30–60 minutes postinjection from the same mouse as in ( a ) at the midplane level, showing low radiotracer uptake in brain (Br) and spinal cord (Co), as well as high accumulation in urinary bladder. c ) Transverse (0.5 mm) slice of data acquired over the period 30–60 minutes postinjection from the same HT1080/1-3C tumor-bearing mouse as in ( a ) at the level of the maximal tumor diameter. d ) Corresponding transverse slice from an HT1080/26.6 tumor-bearing mouse, exhibiting lower tumor radiotracer uptake. The scale to the right shows uptake in arbitrary units. First published in Barthel et al. ( 138 ) .](https://oup.silverchair-cdn.com/oup/backfile/Content_public/Journal/jnci/98/9/10.1093_jnci_djj162/2/m_jncidjj162f05_ht.jpeg?Expires=1716525462&Signature=e3YdIm~gL4iy48BA6RpcnsiZDxtQ-wVdaE04bzyiBt7WeQDaiV9fzr0ww4sXWjheHH47V4zNY8vkx5LgsnNVW04-hOW~dsWeZrgWu~yygpiS4izamNJm9CVtyxglpTTKJXCueAPTebZS~SmT2y7czAEYLBIf433N70FZh6e9JflmOlTe~X8EPBEAMtLRU63ssAJLpE3td5YC-Gt3PHS-NTfSiOsOK9xcFeR2D5KtAM6BrWhxoB8H55hVNmNDQO9Yc19wzatPw1YvOoSguXnFauSp5M2HA7To0CE8qaVgTdSw548HVGUOgw2Ubz3ouLWAF-cwhvHCQS~vkSCp95Cy3A__&Key-Pair-Id=APKAIE5G5CRDK6RD3PGA)
Monitoring hypoxia. A ) Measurements of the hypoxia marker SR-4554. i ) Magnetic resonance image of a patient showing a leiomyosarcoma of the left thigh (T2-weighted image). ii–iv ) 19 F magnetic resonance spectra (MRS) of the tumor acquired from the same patient at ( ii ) 2.18 hours, ( iii ) 7.98 hours, and ( iv ) 27.50 hours after the start of SR-4554 infusion (1600 mg/m 2 ). Unlocalized spectra were acquired using a 10-cm surface coil and a 1.5-T magnetic resonance system (2048 transients acquired over 34 minutes, repetition time 1 second). v ) Quantification of the 19 F signal detected from the tumor at time points after the start of the intravenous infusion at a dose of 1600 mg/m 2 with an infusion time of 63 minutes. The graph compares concentrations of SR-4554 detected by 19 F MRS in the tumor, in which a fraction may be bound in hypoxic tissues and thus not be cleared as rapidly as in plasma, and the concentrations of the parent SR-4554 in plasma detected by ultraviolet high-pressure liquid chromatography (HPLC). Reproduced from Seddon et al. ( 87 ) . B ) [ 18 F]Fluoroetanidazole–positron emission tomography images of HT1080 human fibrosarcoma tumor-bearing mice acquired on the small-animal quad-HiDAC scanner (cubic voxels of side: 0.5 mm). a ) Three-dimensional (volume-rendered) image of an HT1080/1-3C tumor-bearing mouse (showing data acquired over the period 30–60 minute postinjection) showing a dorsal view of the mouse. Here, pixel values are defined by the maximum voxel value in corresponding lines in the z-axis. Arrows point to tumor (Tm), kidneys (Ki), small intestine (In), and urinary bladder (Bl). b ) Sagittal (0.5 mm) slice of data acquired over the period 30–60 minutes postinjection from the same mouse as in ( a ) at the midplane level, showing low radiotracer uptake in brain (Br) and spinal cord (Co), as well as high accumulation in urinary bladder. c ) Transverse (0.5 mm) slice of data acquired over the period 30–60 minutes postinjection from the same HT1080/1-3C tumor-bearing mouse as in ( a ) at the level of the maximal tumor diameter. d ) Corresponding transverse slice from an HT1080/26.6 tumor-bearing mouse, exhibiting lower tumor radiotracer uptake. The scale to the right shows uptake in arbitrary units. First published in Barthel et al. ( 138 ) .
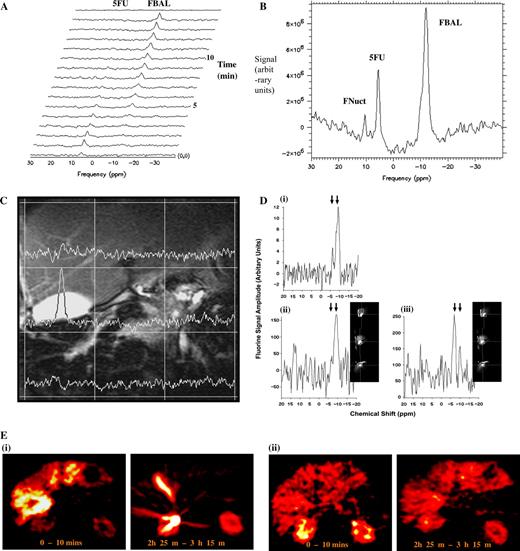
Complementary modalities used to observe drug pharmacokinetics and metabolism in patients. A ) Time course of uptake of the antimetabolite 5-fluorouracil (5FU) in the liver and metastases of a 73-year-old male with colorectal cancer showing conversion of 5FU to fluoro-β-alanine (FBAL). Courtesy of Professor J. Griffiths, St. Georges Hospital Medical School. B ) Summed time course data from ( A ) showing the anabolite fluoronucleotides (FNuct) as well as 5FU and FBAL. C ) Two-dimensional magnetic resonance spectroscopic map of the liver superimposed on a proton image showing drug metabolite signal localized to the gallbladder. Reproduced with permission from Dzik-Jurasz et al. ( 101 ) . D ) Chemical specificity of the localized metabolite signals from ( C ): i ) unlocalized signal from whole liver, ii ) spectrum from a voxel positioned in liver, iii ) spectrum from a voxel localized in the gallbladder, showing a shift in the resonant frequency of the FBAL in the gallbladder ( left-hand arrow ) due to conjugation with bile acid compared with unconjugated FBAL in the liver ( right-hand arrow ). Reproduced with permission from Dzik-Jurasz et al. ( 101 ) . E ) Positron emission tomography images of 18 F-labeled 5FU at two time points after administration to ( i ) eniluracil-naive patients and ( ii ) eniluracil-treated patients. Eniluracil decreases catabolic breakdown of 5FU, reducing clearance of drug in the liver with metabolism predominantly via the anabolic pathway. High levels of drug are shown as white , low levels are dark red . Modified from Saleem et al. ( 113 ) , reprinted with permission from Elsevier.
Although PET imaging has many advantages for use in drug development, it is important to be aware of its limitations ( Table 1 ). Not all compounds (i.e., drugs or biochemical probes) can be radiolabeled. Each compound must be considered on an individual basis as a candidate for labeling. Small molecules, proteins, and antibodies can be selectively radiolabeled if suitable functional groups are present. Labeling can be performed to obtain a chemically identical compound that contains 11 C or 18 F, if fluorine is present in the original molecule (e.g., 5FU and gefitinib). Compounds with N-, S-, or O-methyl or ethyl groups, as well as proteins and antibodies, can be labeled fairly easily. However, not all drugs can be labeled, for the following reasons: 1) in some cases, the multistep chemistry required for labeling precludes radiolabeling and purification of molecules rapidly enough to avoid substantial decay of radioactivity; 2) suitable precursors for radiolabeling a number of compounds (especially natural products) may not be available, a problem that may be alleviated by including precursor strategies into development programs; and/or 3) the position of the label may not be robust to metabolic degradation. However, this latter issue can occasionally be turned into an advantage for studying the mechanism of drug action as, for example, in the case of demonstrating the mechanism of action of temozolomide in patients ( 119 ) .
Regarding imaging data, PET images have low anatomic resolution; hence, it is common practice to align PET data with data from MRI and CT. The development of integrated PET–CT systems may reduce the extent of the poor anatomic resolution of PET images ( 153 ) . PET is also limited by a lack of chemical resolution; i.e., unlike MRS, PET cannot distinguish between the parental radiotracer and its labeled or unlabeled metabolites. This is not a problem for drugs that are not metabolized extensively. However, for extensively metabolized drugs, which may include more than 95% of all compounds, metabolism can complicate the interpretation of PET data, requiring complex mathematical modeling for data analysis. Strategies to prevent the retention of labeled metabolites in tissues have been developed, for example, labeling compounds in such a way that metabolites are exhaled as 11 CO 2 , as well as tissue 11 CO 2 correction methodologies ( 154 ) . In cases in which tracers with longer half-lives are employed (e.g., FIAU), confounding of signal analysis by labeled metabolites can be overcome by a “washout” strategy, in which nonspecific metabolites are eliminated while specifically bound species that can be imaged at a late time point are retained.
Most of the PET isotopes mentioned above have short to moderate physical half-lives (e.g., 15 O = 2 minutes, 13 N = 10 minutes, 11 C = 20 minutes, 18 F = 110 minutes, and 124 I = 4 days). For some positron-labeled compounds, the combination of a short physical half-life and a short biologic half-life can limit the type of pharmacologic information that can be attained. However, for patient comfort, imaging times should be limited to 1–3 hours. Although it is preferable to use longer-lived isotopes to label radiotracers that have relatively long biologic half-lives, it is also important to consider the measured radiation dose to specific organs and to the whole body. Radiation exposure is a potential limitation of PET radioisotopes, particularly when PET or PET–CT imaging studies are performed on multiple occasions.
Various physical processes limit the spatial resolution attainable with PET to 2–3 mm for clinical scanners (4.6–8 mm for most currently available commercial scanners) and to 1 mm for animal scanners. However, the sensitivity of this technique (∼10 −12 M) and the time for kinetic resolution are extremely high. Finally, PET scanning is expensive because it includes the costs of labeling the compound, quality control, the radiographer's time, and modeling of the data. For these reasons, most centers worldwide usually concentrate on PET scanning using only one or two tracers. Few centers have a comprehensive range of facilities, including cyclotrons, radiochemistry hot-cells, and PET scanners, and personnel, including radiographers, staff for physics and mathematical modeling support, as well as nonclinical and clinical researchers.
With the availability of dedicated small-animal scanners, which are desirable for generating preclinical validation data ( 155 ) , there is great potential to develop and test new therapeutics in disease models of cancer using PET. For instance, PET can be used to study gene expression over time in a tumor-bearing or transgenic animal, potentially providing data that could bridge the gap between basic science and clinical application. There is also the potential to develop PET imaging strategies for studying protein–protein and DNA–oligonucleotide interactions, apoptosis, signal transduction inhibition, and ligand–receptor interactions.
Many PET centers in developed countries have the capability to undertake clinical 18 FDG studies to evaluate responses to anticancer agents. A few centers can also perform preclinical PET studies. However, substantial resources will need to be invested to support clinical facilities if PET is to play a key, routine role in anticancer drug development.
As PET becomes a common tool for studying molecular interactions in humans, guidelines for its use in clinical and laboratory practice are needed. This need is partly being addressed by the EORTC Functional Imaging Group with the publication of guidelines for 18 FDG response assessment ( 122 ) . Guidelines on pre-phase I toxicology of cancer therapeutic and diagnostic agents for use with PET research have been published by the Working Party on PET Pre-Phase I trials of Cancer Research UK ( 156 ) .
There is enormous potential for the use of PET in the assessment of tissue PK or PD endpoints. Like MRI and MRS, PET is minimally invasive and can be used repeatedly in the same subject, thus avoiding the need for multiple biopsies. Although PET has some limitations, such as its lack of chemical resolution and the limited half-life of many isotopes ( Table 1 ), its potential in drug development is enormous and we anticipate that this technology will be used increasingly to provide information on whether the drug reaches desirable concentrations in tumors, modulates a particular molecular target, and affects the desired biologic activity ( 15 ) .
C ONCLUSIONS
Because of our increasingly detailed understanding of the genomics and molecular biology of cancer, enormous expectations are being placed on the development of new molecular therapeutics that exploit this growing knowledge. Although there have been a small number of impressive successes (e.g., imatinib and trastuzumab), there have also been many high-profile failures (e.g., gefitinib in combination with chemotherapy). The understandable impatience of the public and of the academic and pharmaceutical communities to rapidly translate our comprehension of the molecular biology of cancer into genuine therapeutic advances creates an inevitable tension when coupled to the relatively small number of successes in drug development ( 157 ) . The identification and implementation of PK/PD endpoints provide a powerful mechanism for improving the quality of drug development, allowing prioritization of the drugs that are most likely to succeed, accelerating their regulatory approval, and reducing the overall risks and costs of pharmaceutical development ( 15 – 19 ) .
As a recent survey has shown, the uptake of PK/PD and biomarker endpoints in early clinical trials has been surprisingly and disappointingly poor ( 20 ) . This low uptake may relate to the challenges in bringing forward appropriate methodologies that have a genuine impact on decision making rather than being purely “decorative” ( 22 ) . The added value provided by PK/PD methodologies must exceed their potential negative impact on the cost, logistics, and speed of clinical trials. The methodology must be made available and be appropriately validated so that it can be implemented in a timely way to maximize its value for decision making. We feel that there has been an underinvestment in PK/PD endpoints and that, in cases where they are available, they have not been implemented efficiently. The technical challenges and logistic considerations mentioned above, coupled with suboptimal sharing and communication of information, risks, and benefits among the academic, pharmaceutical, and regulatory communities, are also likely to contribute to the infrequent implementation of PK/PD endpoints ( 19 ) . Although recognition of these issues has improved recently in pharmaceutical development in general ( 158 – 161 ) and in oncology in particular ( 15 , 19 ) , the benefits are not yet readily apparent ( 20 ) . Communication of experience and the development of guidelines for PK/PD endpoints are therefore critically important.
It is against this general background and the particular experience of the New Agents Committee and Drug Development Office of Cancer Research UK that the required endpoints were frequently not in place and/or validated, that we decided to summarize and communicate our emerging experience. Although this review is written from a U.K. perspective, we feel that our experience will be relevant to other drug development organizations, and we welcome feedback from the broader oncology community. Of note, the U.S. Food and Drug Administration published a draft guidance for industry, investigators, and reviewers for exploratory investigational new drug studies, which describes the proposed requirements for early, limited clinical investigations intended to assess the feasibility for further development of a drug or biologic product ( 162 ) . In particular, the guidance refers to imaging studies and the concept of dose escalation to a predefined PD endpoint. The present review was focused on minimally invasive PK/PD endpoints because these methods overcome many (although not all) of the logistical and ethical issues that are associated with invasive measurements. In particular, the technologies we discuss avoid the need for studying surrogate markers in multiple blood samples or normal tissue or tumor biopsy samples. We emphasize, however, that the use of biopsy and other invasive surrogate-based assays to measure PK and PD remains an important component of early clinical trials. For example, invasive assays to measure direct target modulation could usefully complement the minimally invasive imaging of downstream effects such as inhibition of cell proliferation or induction of apoptosis. We have emphasized MRS/MRI and PET methods because they are increasingly available and provide more detailed functional and metabolic information than many other methodologies. In addition to the methods reviewed here, other imaging methods, such as bioluminescence and fluorescence/infrared, can be used preclinically to confirm the mechanism of action of new drugs but cannot be used clinically to evaluate the agents ( 163 – 165 ) . Such methods can be designed to specifically monitor receptor activity, protein–protein interactions, and transcriptional activity and may add value to the other methods described in this review.
A central role of PK/PD endpoints is to contribute information to allow the construction of the pharmacologic audit trail that links, as far as is realistically possible, all of the molecular and biologic events from the action of the drug at its target locus to the demonstration of clinical activity and benefit ( 15 – 17 ) . In general, there is a greater need for PD biomarkers of drug effect. Although PK measurements are routinely made on the plasma compartment, information is often lacking on drug distribution and metabolism in normal and tumor tissue. This information can be provided by MRS/MRI and PET ( 93 , 166 ) .
There are several examples in which the use of noninvasive PK and PD endpoints have had a positive impact on, and added real value to, early clinical trials of innovative therapies. The use of 18 FDG PET allowed the rapid demonstration of the dramatic activity of imatinib in gastrointestinal stromal tumors ( 167 ) . Cell proliferation measurement with tracers such as 18 fluorothymidine are also valuable ( 168 , 169 ) . The combination of PET and CT provides metabolic measurements with optimal spatial resolution, which is a major advantage of such noninvasive methods ( 170 ) . PET and MRI have each proven valuable in assessing the functional activity of antiangiogenesis and antivascular strategies. For example, these methods were used to demonstrate the effects of combrestatin A4 phosphate on blood flow ( 171 – 173 ) . An editorial ( 22 ) that accompanied the publication of those studies concluded that imaging assisted the selection of doses for phase II studies, albeit fairly marginally; that it provided help with the selection of the best schedule for phase II studies; and that it could potentially be used to select subpopulations of patients who respond to the drug. The same editorial also emphasized that both MRI and PET methods for measuring tumor blood flow were becoming more widely available and that the current technical limitations apparent in 2003 should not drive readers to conclude that the technology is impractical.
Noninvasive imaging methodologies have clearly proved valuable in studies that have generally involved measuring events downstream of the molecular target in the previously discussed pharmacologic audit trail ( Fig. 1 ). Whereas invasive monitoring with molecular analysis has, in some cases, been useful in demonstrating proof of concept and in selecting the dose and schedule for molecular therapeutics such as kinase and histone deacetylase inhibitors ( 174 – 176 ) , the equivalent information is not yet readily achievable with imaging technologies. However, it has been possible to determine receptor status by PET ( 135 , 136 , 145 , 146 ) . Much greater effort needs to be put into developing probes and technologies to detect and quantify specific molecular events.
On the other hand, although noninvasive imaging methods to measure specific molecular target effects, such as enzyme inhibition or protein–protein interactions, would be desirable, these methods would have to be developed individually for each class of therapeutic agent. It could be argued, however, that this may not be the best use of available resources, given the high attrition rates of individual drugs ( 157 ) . According to this notion, it may be preferable to give priority to the development of generic assays that measure the common biologic processes that are affected by many different drug classes, particularly proliferation, cell cycle status, apoptosis, invasion, metastasis, and angiogenesis.
S UMMARY
The development of assays for patient selection will become increasingly important ( 177 , 178 ) . The development of PK and in particular PD endpoints that allow construction of the pharmacological audit trail is essential ( 14 – 18 ) . Although the use of minimally invasive endpoints that measure interaction at specific molecular targets will be valuable and is encouraged for research purposes, this is technically challenging, and greater cost/benefit will be derived from developing assays for biological processes that will be more generically applicable to different classes of molecular therapeutics. We recommend that funding bodies and industry should invest more in the development, validation and standardization of minimally invasive methodologies as well as in the development of instrumentation. Quality assurance is important, especially across institutions participating in multicenter clinical trials, and standardized methodology and nomenclature should be employed ( 47 , 107 , 122 , 156 ) . Finally, attention needs to be paid to differences in study objectives for research investigations versus regulatory and commercial requirements.
P. M. J. McSheehy holds stock in Novartis.
The authors wish to call readers' attention to two recently publish papers that appeared while this article was in the late stages of production:
We thank Cancer Research UK for support and Hayley Farmer for excellent administrative help. P. Workman is a Cancer Research UK Life Fellow.
References
Garrett MD, Workman P. Discovering novel chemotherapeutic drugs for the third millennium.
Gibbs JB. Mechanism-based target identification and drug discovery in cancer research.
Kaelin WG. Choosing anticancer drug targets in the post-genomic era.
Workman P. The opportunities and challenges of personalized genome-based molecular therapies for cancer: Targets, technologies and molecular chaperones.
Slamon DJ, Leyland-Jones B, Shak S, Fuchs H, Paton V, Bajamonde A, et al. Use of chemotherapy plus a monoclonal antibody against HER2 for metastatic breast cancer that overexpresses HER2.
Druker BJ, Sawyers CL, Kantarjian H, Resta DJ, Reese SF, Ford JM, et al. Activity of a specific inhibitor of the BCR-ABL tyrosine kinase in the blast crisis of chronic myeloid leukemia and acute lymphoblastic leukemia with the Philadelphia chromosome.
Heinrich MC, Corless CL, Demetri GD, Blanke CD, von Mehren M, Joensuu H, et al. Kinase mutations and imatinib response in patients with metastatic gastrointestinal stromal tumor.
Lynch TJ, Bell DW, Sordella R, Gurubhagavatula S, Okimoto RA, Brannigan BW, et al. Activating mutations in the epidermal growth factor receptor underlying responsiveness of non–small-cell lung cancer to gefitinib.
Paez JG, Jänne PA, Lee JC, Tracy S, Greulich H, Gabriel S, et al. EGFR mutations in lung cancer: correlation with clinical response to gefitinib therapy.
Cunningham D, Humblet Y, Siena S, Khayat D, Bleiberg H, Santoro A, et al. Cetuximab monotherapy and cetuximab plus irinotecan in irinotecan-refractory metastatic colorectal cancer.
Hurwitz H, Fehrenbacher L, Novotny W, Cartwright T, Hainsworth J, Heim W, et al. Bevacizumab plus irinotecan, fluorouracil, and leucovorin for metastatic colorectal cancer.
Workman P, Kaye SB. Translating basic cancer research into new cancer therapeutics.
Gelmon KA, Eisenhauer EA, Harris AL, Ratain MJ, Workman P. Anticancer agents targeting signalling molecules and the cancer cell environment: Challenges for drug development?
Workman P. Challenges of PK/PD measurements in modern drug development.
Workman P. How much gets there and what does it do?: The need for better pharmacokinetic and pharmacodynamic endpoints in contemporary drug discovery and development.
Workman P. Auditing the pharmacological accounts for Hsp90 molecular chaperone inhibitors: Unfolding the relationship between pharmacokinetics and pharmacodynamics.
Frank R, Hargreaves R. Clinical biomarkers in drug discovery and development.
Park JW, Kerbel RS, Kelloff GJ, Barrett JC, Chabner BA, Parkinson DR, et al. Rationale for biomarkers and surrogate end points in mechanism-driven oncology drug development.
Parulekar WR, Eisenhauer EA. Phase I trial design for solid tumor studies of targeted, non-cytotoxic agents: theory and practice.
Newell DR, Searle KM, Westwood NB, Burtles SS, on behalf of the Cancer Research UK Phase I/II Clinical Trials Committee. Professor Tom Connors and the development of novel cancer therapies by the Phase I/II Clinical Trials Committee of Cancer Research UK.
Collins JM. Functional imaging in phase I studies: decorations or decision making?
MacVicar D, Husband JE. Assessment of response following treatment for malignant disease.
Miller AB, Hoogstraten B, Staquet M. Reporting results of cancer treatment.
Therasse P, Arbuck SG, Eisenhauer EA, Wanders J, Kaplan RS, Rubinstein L, et al. New guidelines to evaluate the response to treatment in solid tumors.
Miles KE. Measurement of tissue perfusion by dynamic computed tomography.
Whittingham TA. New and future developments in ultrasonic imaging.
Fenster A, Downey DB, Cardinal HN. Three-dimensional ultrasound imaging.
Kedar RP, Cosgrove DO, Smith IE, Mansi JL, Bamber JC. Breast carcinoma—measurement of tumor response to primary medical therapy with color Doppler flow imaging.
Kedar RP, Cosgrove D, McCready VR, Bamber JC, Carter ER. Microbubble contrast agent for color Doppler US: Effect on breast masses.
Blomley MJ, Eckersley RJ. Functional ultrasound methods in oncological imaging.
Dayton PA, Ferrara KW. Targeted imaging using ultrasound.
Padhani AR. Functional MRI for anticancer therapy assessment.
Schneider G, Uder M. Contrast enhanced magnetic resonance body imaging 5.
Brasch R, Turetschek K. MRI characterization of tumors and grading angiogenesis using macromolecular contrast media; status report.
Turetschek K, Preda A, Novikov V, Brasch RC, Weinmann HJ, Wunderbaldinger P, et al. Tumor microvascular changes in antiangiogenic treatment: assessment by magnetic resonance contrast media of different molecular weights.
Knopp MV, von Tengg-Kobligk H, Choyke PL. Functional magnetic resonance imaging in oncology for diagnosis and therapy monitoring.
Degani H, Chetrit-Dadani M, Bogin L, Furman-Haran E. Magnetic resonance imaging of tumour vasculature.
Tofts PS, Brix G, Buckley DL, Evelhoch JL, Henderson E, Knopp MV, et al. Estimating kinetic parameters from dynamic contrast-enhanced T(1)-weighted MRI of a diffusable tracer: standardized quantities and symbols.
Taylor JS, Reddick WE. Evolution from empirical dynamic contrast-enhanced magnetic resonance imaging to pharmacokinetic MRI.
Parker GJM, Suckling J, Tanner SF, Padhani AR, Husband JE, Leach MO. MRIW: parametric analysis software for contrast-enhanced dynamic MR imaging in cancer.
Hayes C, Padhani AR, Leach MO. Assessing changes in tumour vascular function using dynamic contrast-enhanced magnetic resonance imaging.
Ostergaard L, Sorensen AG, Kwong KK, Weisskoff RM, Gyldensted C, Rosen BR. High resolution measurement of cerebral blood flow using extravascular tracer bolus passages. Part II: experimental comparison and preliminary results.
d'Arcy JA, Collins DJ, Rowland IJ, Padhani AR, Leach MO. Applications of sliding window reconstruction with cartesian sampling for dynamic contrast enhanced MRI.
Leach MO, Brindle KM, Evelhoch JL, Griffiths JR, Horsman MR, Jackson A, et al. The assessment of antiangiogenic and antivascular therapies in early-stage clinical trials using magnetic resonance imaging: issues and recommendations.
Leach MO, Brindle KM, Evelhoch JL, Griffiths JR, Horsman MR, Jackson A, et al. Assessment of antiangiogenic and antivascular therapeutics using MRI: recommendations for appropriate methodology for clinical trials.
Bentzen L, Vestergaard-Poulsen P, Nielsen T, Overgaard J, Bjornerud A, Briley-Saebo K, et al. Intravascular contrast agent-enhanced MRI measuring contrast clearance and tumor blood volume and the effects of vascular modifiers in an experimental tumor.
Kobayashi H, Brechbiel MW. Dendrimer-based nanosized MRI contract agents.
Turetschek K, Huber S, Floyd E, Helbich T, Roberts TP, Shames DM, et al. MR imaging characterization of microvessels in experimental breast tumors by using a particulate contrast agent with histopathologic correlation.
Nguyen BC, Stanford W, Thompson BH, Rossi NP, Kernstine KH, Kern JA, et al. Multicenter clinical trial of ultrasmall superparamagnetic iron oxide in the evaluation of mediastinal lymph nodes in patients with primary lung carcinoma.
Preda A, Novikov V, Moglich M, Turetschek K, Shames DM, Brasch RC, et al. MRI monitoring of Avastin antiangiogenesis therapy using B22956/1, a new blood pool contrast agent, in an experimental model of human cancer.
Parker GJ, Suckling J, Tanner SF, Padhani AR, Revell PB, Husband JE, et al. Probing tumor microvascularity by measurement, analysis and display of contrast agent uptake kinetics.
Padhani AR. Dynamic contrast-enhanced MRI studies in human tumours.
Knopp MV, Weiss E, Sinn HP, Mattern J, Junkermann H, Radeleff J, et al. Pathophysiologic basis of contrast enhancement in breast tumors.
Buckley DL, Drew PJ, Mussurakis S, Monson JR, Horsman A. Microvessel density of invasive breast cancer assessed by dynamic Gd-DTPA enhanced MRI.
Reddick WE, Taylor JS, Fletcher BD. Dynamic MR imaging (DEMRI) of microcirculation in bone sarcoma.
Galbraith SM, Rustin GJ, Lodge MA, Taylor NJ, Stirling JJ, Jameson M, et al. Effects of 5,6-dimethylxanthenone-4-acetic acid on human tumor microcirculation assessed by dynamic-contrast enhanced magnetic resonance imaging.
Galbraith SM, Maxwell RJ, Lodge MA, Tozer GM, Wilson J, Taylor NJ, et al. Combretastatin A4 phosphate has tumor antivascular activity in rat and man as demonstrated by dynamic magnetic resonance imaging.
Evelhoch JL, LoRusso PM, He ZQ, DelProposto Z, Polin L, Corbett TH, et al. Magnetic resonance imaging measurements of the response of murine and human tumors to the vascular-targeting agent ZD6126.
Padhani AR, MacVicar DA, Gapinksi CJ, Revell P, Parker GJM, Suckling J, et al. Effects of androgen deprivation treatment on prostate morphology and vascular permeability evaluated by magnetic resonance imaging.
Hayes C, Padhani AR, Leach MO. Assessing changes in tumour vascular function using dynamic contrast-enhanced magnetic resonance imaging.
Morgan B, Thomas AL, Drevs J, Hennig J, Buchert M, Jivan A, et al. Dynamic contrast-enhanced magnetic resonance imaging as biomarker for the pharmacological response of PTK787/ZK222584, an inhibitor of the vascular endothelial growth factor receptor tyrosine kinases, in patients with advanced colorectal cancer and liver metastases: results from two phase I studies.
Artemov D, Mori N, Ravi R, Bhujwalla ZM. Magnetic resonance molecular imaging of the HER-2/neu receptor.
Weissleder R, Moore A, Mahmood U, Bhorade R, Benveniste H, Chiocca EA, et al. In vivo magnetic resonance imaging of transgene expression.
Louie AY, Huber MM, Ahrens ET, Rothbacher U, Moats R, Jacobs RE, et al. In vivo visualization of gene expression using magnetic resonance imaging.
Schellenberger EA, Hogemann D, Josephson L, Weissleder R. Annexin V-CLIO: a nanoparticle for detecting apoptosis by MRI.
Galons JP, Altbach MI, Paine-Murrieta GD, Taylor CW, Gillies RJ. Early increases in breast tumor xenograft water mobility in response to paclitaxel therapy detected by non-invasive diffusion magnetic resonance imaging.
Dzik-Jurasz A, Domenig C, George M, Wolber J, Padhani A, Brown G, et al. Diffusion MRI for prediction of response of rectal cancer to chemoradiation.
Gadian DG. NMR and its applications to living systems. 2nd ed. Oxford (U.K.): Oxford Science Publications;
Kurhanewicz J, Swanson MG, Nelson SJ, Vigneron DB. Combined magnetic resonance imaging and spectroscopic imaging approach to molecular imaging of prostate cancer.
Katz-Brull R, Lavin PT, Lenkinski RE. Clinical utility of proton magnetic resonance spectroscopy in characterizing breast lesions.
Mahon MM, Williams AD, Soutter WP, Cox IJ, McIndoe GA, Coutts GA, et al. 1H magnetic resonance spectroscopy of invasive cervical cancer: an in vivo study with ex vivo corroboration.
Griffiths JR, Tate AR, Howe FA, Stubbs M. Magnetic resonance spectroscopy of cancer practicalities of multi-centre trials and early results in non-Hodgkins lymphoma.
Leach MO, Verrill M, Glaholm J, Smith TAD, Collins DJ, Payne GS, et al. Measurements of human breast cancer using magnetic resonance spectroscopy: a review of clinical measurements and a report of localized 31 P measurements of response to treatment.
Ronen SM, Leach MO. Imaging biochemistry: applications to breast cancer.
Ronen SM, DiStefano F, McCoy CL, Robertson D, Smith TAD, Al-Saffar NM, et al. Magnetic resonance detects metabolic changes associated with chemotherapy induced apoptosis.
Hakumaki JM, Poptani H, Sandmair AM, Yla-Herttuala S, Kauppinen RA. 1 H MRS detects polyunsaturated fatty acid accumulation during gene therapy of glioma: implications for the in vivo detection of apoptosis.
Lehtimaki KK, Valonen PK, Griffin JL, Vaisanen TH, Grohn OH, Kettunen MI, et al. Metabolite changes in BT4C rat gliomas undergoing ganciclovir-thymidine kinase gene therapy-induced programmed cell death as studied by 1 H NMR spectroscopy in vivo, ex vivo, and in vitro.
Murphy PS, Dzik-Jurasz A, Baustert I, Leach MO, Rowland IJ. Choline signal correlates with vascular permeability in human gliomas.
Murphy PS, Viviers L, Abson C, Rowland IJ, Brada M, Leach MO, et al. Monitoring temozolomide treatment of low-grade glioma with proton magnetic resonance spectroscopy.
Schwarz AJ, Maisey NR, Collins DJ, Cunningham D, Huddart R, Leach MO. Early in vivo detection of metabolic response: a pilot study of 1 H MR spectroscopy in extracranial lymphoma and germ cell tumors.
Aboagye EO, Kelson AB, Tracy M, Workman P. Preclinical development and current status of the fluorinated 2-nitroimidazole hypoxia probe N-(2-hydroxy-3,3,3-trifluoropropyl)-2-(2-nitro-1-imidazolyl) acetamide (SR 4554, CRC 94/17): a non-invasive diagnostic probe for the measurement of tumor hypoxia by magnetic resonance spectroscopy and imaging, and by positron emission tomography.
Seddon BM, Maxwell RJ, Honess DJ, Grimshaw R, Raynaud F, Tozer GM, et al. Validation of the fluorinated 2-nitroimidazole SR-4554 as a noninvasive hypoxia marker detected by magnetic resonance spectroscopy.
Seddon BM, Payne GS, Simmons L, Ruddle R, Grimshaw R, Tan S, et al. A phase I study of SR-4554 via intravenous administration for non-invasive investigation of tumor hypoxia by magnetic resonance spectroscopy in patients with malignancy.
McSheehy PM, Leach MO, Judson IR, Griffiths JR. Metabolites of 2′-fluoro-2′deoxy- D -glucose detected by 19 F magnetic resonance spectroscopy in vivo predict response of murine RIF-1 tumours to 5-fluorouracil.
Vivi A, Tassini M, Ben-Horin H, Navon G, Kaplan O. Comparison of action of the anti-neoplastic drug lonidamine on drug-sensitive and drug-resistant human breast cancer cells: 31 P and 13 C nuclear magnetic resonance studies.
Robinson SP, Barton SJ, McSheehy PMJ, Griffiths JR. Nuclear magnetic resonance spectroscopy of cancer.
Griffiths JR, McIntyre DJO, Howe FA, McSheehy PMJ, Ojugo ASE, Rodrigues LM, et al. Issues of normal tissue toxicity in patients and animal studies: effect of carbogen (95% O 2 /5% CO 2 ) breathing in rats after 5FU treatment.
Wolf W, Waluch V, Presant CA. Non-invasive 19 F-MRS of 5-fluorouracil in pharmacokinetics and pharmacodynamics.
Findlay MPN, Leach MO. In vivo monitoring of fluoropyrimidine metabolites: magnetic resonance spectroscopy in the evaluation of 5-fluorouracil.
van Laarhoven HWM, Klomp DWJ, Kamm YJL, Punt CJA, Heerschap A. In vivo monitoring of capectiabine metabolism in human liver by 19 fluorine magnetic resonance spectroscopy at 1.5 and 3 Tesla field strength.
Payne GS, Pinkerton CR, Bouffet E, Leach MO. Initial measurements ofifosfamide and cyclophosphamide in patients using 31 P MRS: pulse-and-acquire, decoupling and polarization transfer.
Kamm YJ, Heerschap A, van den Bergh EJ, Wagener DJ. 19 F-magnetic resonance spectroscopy in patients with liver metastases of colorectal cancer treated with 5-fluorouracil.
Greco O, Dachs GU. Gene directed enzymes/prodrug therapy of cancer: historical appraisal and future prospectives.
He Q, Bhujwalla ZM, Maxwell RJ, Griffiths JR, Glickson JD. Proton NMR observation of the antineoplastic agent iproplatin in vivo by selective multiple quantum coherence transfer (Sel-MQC).
Artemov D, Bhujwalla ZM, Maxwell RJ, Griffiths JR, Judson I, Leach MO, Glickson JD. Pharmacokinetics of the 13 C labelled anticancer agent temozolomide detected in vivo by selective cross polarization transfer.
Dzik-Jurasz ASK, Collins DJ, Leach MO, Rowland IJ. Gallbladder localisation of 19 F-MRS catabolite signals in patients receiving bolus and protracted venous infusional 5-fluorouracil.
Cherubini A, Payne GS, Leach MO, Bifone A. Hyperpolarising C-13 for NMR studies using laser-polarised Xe-129: SPINOE vs thermal mixing.
Ronen SM, DiStefano F, McCoy CL, Robertson D, Smith TA, Al-Saffar NM, et al. Magnetic resonance detects metabolic changes associated with chemotherapy-induced apoptosis.
Ronen SM, Jackson LE, Beloueche M, Leach MO. Magnetic resonance detects changes in phosphocholine associated with Ras activation and inhibition in NIH 3T3 cells.
Beloueche-Babari M, Jackson LE, Al-Saffar NM, Workman P, Leach MO, Ronen SM. Magnetic resonance spectroscopy monitoring of mitogen-activated protein kinase signalling inhibition.
Chung Y-L, Troy H, Banerji U, Jackson LE, Walton MI, Stubbs M, et al. Magnetic resonance spectroscopic pharmacodynamic markers of the Hsp90 inhibitor 17-allylamino,17-demethoxygeldanamycin in human colon cancer Models.
Leach MO, Arnold D, Brown TR, Charles HC, de Certaines JD, Evelhoch JL, et al. International workshop on Standardization in Clinical Magentic Resonance Spectroscopy Measurements: proceedings and recommendations.
Golman K, Ardenkjaer-Larsen JH, Petersson JS, Mansson S, Leunbach I. Molecular imaging with endogenous substances.
Lanza GM, Winter P, Caruthers S, Schmeider A, Crowder K, Morawski A, et al. Novel paramagnetic contrast agents for moleculare imaging and targeted drug delivery.
Saleem A, Aboagye EO, Price PM. In vivo monitoring of drugs using radiotracer techniques.
Gupta N, Price PM, Aboagye EO. PET for in vivo pharmacokinetic and pharmacodynamic measurements.
Saleem A, Harte RJ, Matthews JC, Osman S, Brown GD, Bleehen N, et al. Pharmacokinetic evaluation of N-[2-(dimethylamino)ethyl]acridine-4-carboxamide (DACA; XR5000) in patients by positron emission tomography.
Saleem A, Yap J, Osman S, Brady F, Suttle B, Lucas SV, et al. Modulation of fluorouracil tissue pharmacokinetics by eniluracil: in-vivo imaging of drug action.
Brock CS, Matthews JC, Brown G, Luthra SK, Brady F, Newlands ES, et al. The kinetic behavior of temozolomide in man [abstract].
Ginos JZ, Cooper AJ, Dhawan V, Lai JC, Strother SC, Alcock N, Rottenberg DA. [ 13 N]Cisplatin PET to assess pharmacokinetics of intra-arterial versus intravenous chemotherapy for malignant brain tumours.
Mitsuki S, Diksic M, Conway T, Yamamoto YL, Villemure JG, Feindel W. Pharmacokinetics of 11 C-labelled BCNU and SarCNU in gliomas studied by PET.
Inoue T, Kim EE, Wallace S, Yang DJ, Wong FC, Bassa P, et al. Preliminary study of cardiac accumulation of F-18 fluorotamoxifen in patients with breast cancer.
Saleem A, Harte RJH, Matthews C, Osman S, Brady F, Luthra SK, et al. Pharmacokinetic evaluation of N-[2-(dimethylamino)ethyl]acridine-4-carboxamide in patients by positron emission tomography.
Saleem A, Brown GD, Brady F, Aboagye EO, Osman S, Luthra SK, et al. Metabolic activation of temozolamide measured in vivo using positron emission tomography.
Tavitian B, Terrazzino S, Kuhnast B, Marzabal S, Stettler O, Dolle F, et al. In vivo imaging of oligonucleotides with positron emission tomography.
van Oosterom AT, Judson I, Verweij J, Strobants S, Donato di Paola E, Dimitrijevic S, et al. Safety and efficacy of imatinib (STI571) in metastatic gastrointestinal stromal tumours: a phase 1 study.
Young H, Baum R, Cremerius U, Herholz K, Lammertsma A, Hoekstra O, et al. Measurement of clinical and sub-clinical tumour response using [ 18 F]-fluorodeoxyglucose and positron emission tomography: review of the technique and 1999 EORTC recommendations.
Joensuu H, Dimitrijevic S. Tyrosine kinase inhibitor imatinib (STI571) as an anticancer agent for solid tumours.
Eary JF, Mankoff DA, Spence AM, Berger MS, Olshen A, Link JM, et al. 2-[C-11]thymidine imaging of malignant brain tumors.
Findlay M, Young H, Cunningham D, Iveson A, Cronin B, Hickish T, et al. Noninvasive monitoring of tumor metabolism using fluorodeoxyglucose and positron emission tomography in colorectal cancer liver metastases: correlation with tumor response to fluorouracil.
Wilson CB, Lammertsma AA, McKenzie CG, Sikora K, Jones T. Measurements of blood flow and exchanging water space in breast tumors using positron emission tomography: a rapid and noninvasive dynamic method.
Beaney RP, Lammertsma AA, Jones T, McKenzie CG, Halnan KE. Positron emission tomography for in-vivo measurement of regional blood flow, oxygen utilisation, and blood volume in patients with breast carcinoma.
Shields AF, Grierson JR, Dohmen BM, Machulla HJ, Stayanoff JC, Lawhorn-Crews JM, et al. Imaging proliferation in vivo with [F-18]FLT and positron emission tomography.
Lindholm P, Leskinen-Kallio S, Grenman R, Lehikoinen P, Nagren K, Teras M, et al. Evaluation of response to radiotherapy in head and neck cancer by positron emission tomography and [ 11 C]methionine.
Bergmann R, Pietzsch J, Fuechtner F, Pawelke B, Beuthien-Baumann B, Johannsen B, et al. 3- O -Methyl-6– 18 F-fluoro-l-dopa, a new tumor imaging agent: investigation of transport mechanism in vitro.
Beanlands RS, Bach DS, Raylman R, Armstrong WF, Wislon V, Montieth M, et al. Acute effects of dobutamine on myocardial oxygen consumption and cardiac efficiency measured using carbon-11 acetate kinetics in patients with dilated cardiomyopathy.
Wells P, Aboagye EO, Gunn RN, Osman S, Boddy A, Taylor G, et al. 2-[ 11 C]thymidine positron emission tomography as an indicator of thymidylate synthase inhibition in patients treated with AG337.
Collingridge DR, Carroll VA, Glaser M, Aboagye EO, Osman S, Hutchinson OC, et al. [ 124 I]Iodinated-VG76e: a novel tracer for imaging vascular endothelial growth factor in vivo using positron emission tomography.
Jayson GC, Zweit J, Mulatero C, Julyan P, Ranson M, Broughton L, et al. Molecular imaging and biological evaluation of HuMV833 anti-VEGF antibody: implications for trial design of antiangiogenic antibodies.
Smith-Jones PM, Solit DB, Akhurst T, Afroze F, Rosen N, Lasron SM. Imaging the pharmacodynamics of Her2 degradation in response to Hsp90 inhibitors.
Mortimer JE, Dehdashti F, Siegel BA, Katzenellenbogen JA, Fracasso P, Welch MJ. Positron emission tomography with 2-[ 18 F]fluoro-2-deoxy- D -glucose and 16α-[ 18 F]fluoro-17β-estradiol in breast cancer: correlation with estrogen receptor status and response to systemic therapy.
Rasey JS, Koh WJ, Evans ML, Peterson LM, Lewellen TK, Graham MM, et al. Quantifying regional hypoxia in human tumours with positron emission tomography of [ 18 F]fluoromisonidazole: a pretherapy study of 37 patients.
Barthel H, Wilson H, Collingridge DR, Brown G, Osman S, Luthra SK, et al. In vivo evaluation of [ 18 F]fluoroetanidazole as a new marker for imaging tumor hypoxia with positron emission tomography.
Dehdashti F, Mintum MA, Lewis JS, Bradley J, Govindan R, Laforest R, et al. In vivo assessment of tumor hypoxia in lung cancer with 60 Cu-ATSM.
Keen HG, Dekker BA, Disley L, Hastings H, Lyons S, Reader AJ, et al. Imaging apoptosis in vivo using 124 I-annexin and PET.
Collingridge DR, Glaser M, Osman S, Barthel H, Hutchinson OC, Luthra SK, et al. In vitro selectivity, in vivo biodistribution and tumour uptake of annexin V radiolabelled with a positron emitting radioisotope.
van de Weile C, Lahorte C, Vermeersch H, Loose D, Mervillie K, Steinmetz ND, et al. Quantitative tumor apoptosis imaging using technetium-99m-HYNIC annexin V single photon emission computed tomography.
Dekker BA, Keen HG, Shaw D, Disley L, Hastings D, Hadfield J, et al. Functional comparison of annexin V analogues labeled indirectly and directly with iodine-124.
Dekker BA, Keen HG, Lyons S, Disley L, Hastings H, Reader AJ, et al. MBP-annexin V radiolabeled directly with iodine-124 can be used to image apoptosis in vivo using PET.
Haubner R, Kuhnast B, Mang C, Weber WA, Kessler H, Wester H-J, et al. [ 18 F]Galacto-RGD: synthesis, radiolabeling, metabolic stability and radiation dose estimates.
Chen X, Liu S, Hou Y, Tohme M, Park R, Bading J, et al. MicroPET imaging of breast cancer αv-integrin expression with 64 Cu-labeled dimeric RGD peptides.
Tjuvajev JG, Avril N, Oku T, Sasajima T, Miyagawa T, Joshi R, et al. Imaging herpes virus thymidine kinase gene transfer and expression by positron emission tomography.
Gambhir SS, Bauer E, Black ME, Liang Q, Kokoris MS, Barrio JR, et al. A mutant herpes simplex virus type 1 thymidine kinase reporter gene shows improved sensitivity for imaging reporter gene expression with positron emission tomography.
MacLaren DC, Gambhir SS, Satyamurthy N, Barrio JR, Sharfstein S, Toyokuni T, et al. Repetitive, non-invasive imaging of the dopamine D2 receptor as a reporter gene in living animals.
Groot-Wassink T, Aboagye EO, Glaser M, Lemoine N, Vassaux G. Adenovirus biodistribution and non-invasive imaging of gene expression in vivo by positron emission tomography using the human sodium/iodide symporter as a reporter gene.
Jacobs A, Voges J, Reszka R, Lercher M, Gossmann A, Kracht L, et al. Positron-emission tomography of vector-mediated gene expression in gene therapy for gliomas.
Hendrikse NH, de Vries EG, Eriks-Fluks L, van der Graaf WT, Hospers GA, Willemsen AT, et al. A new in vivo method to study P-glycoprotein transport in tumours and the blood-brain barrier.
Goerres GW, Kamel E, Seifert B, Burger C, Buck A, Hany TF, et al. Accuracy of image coregistration of pulmonary lesions in patients with non-small cell lung cancer using an integrated PET/CT system.
Gunn RN, Yap JT, Wells P, Osman S, Price P, Jones T, et al. A general method to correct PET data for tissue metabolites using a dual-scan approach.
Aboagye EO. PET imaging of small animals in anticancer drug development.
Aboagye EO, Luthra SK, Brady F, Poole K, Anderson H, Jones T, et al. Cancer Research UK procedures in manufacture and toxicology of radiotracers intended for pre-phase I positron emission tomography studies in cancer patients.
Kola I, Landis J. Can the pharmaceutical industry reduce attrition rates?
De Gruttola VG, Clax P, DeMets DL, Downing GJ, Ellenberg SS, Friedman L, et al. Considerations in the evaluation of surrogate endpoints in clinical trials: summary of a National Institutes of Health workshop.
De Meyer G, Shapiro F. Biomarker development: The road to clinical utility.
Atkinson AJ. Biomarkers and surrogate endpoints: preferred definitions and conceptual framework.
Prentice RL. Surrogate endpoints in clinical trials: definition and operational criteria.
US Department of Health and Human Services, Food and Drug Administration, Centre for Drug Evaluation and Research (CDER). Draft guidance for industry, investigators and reviewers. Exploratory IND studies. Available at: http://www.fda.gov/cder/guidance/index.htm . [Last accessed: April 4, 2006.]
Gross S, Piwnica-Worms D. Spying on cancer: molecular imaging in vivo with genetically encoded reporters.
Ntziachristos V, Tung CH, Bremer C, Weissleder R. Fluorescence molecular tomography resolves protease activity in vivo.
Gelovani Tjuvajev J, Blasberg RG. In vivo imaging of molecular-genetic targets for cancer therapy.
Aboagye EO, Saleem A, Cunningham V, Osman S, Price P. Extraction of 5-fluorouracil by tumour and liver: a non-invasive positron emission tomography study of patients with gastrointestinal cancer.
Van den Abbeele AD, Badawi RD. Use of positron emission tomography in oncology and its potential role to assess response to imatinib mesylate therapy in gastrointestinal stromal tumors (GISTs).
Shields AF, Grierson JR, Dohmen BM, Machulla HJ, Stayanoff JC, Lawhorn-Crews JM, et al. Imaging proliferation in vivo with [F-18] FLT and positron emission tomography.
Buck AK, Halter G, Schirrmeister H, Kotzerke J, Wurzinger I, Glatting G, et al. Imaging proliferation in lung tumours with PET: 18 F-FLT versus 18 F-FDG.
Chin BB, Patel PV, Nakamoto Y, Cohade C, Osman M, Marshall LT, et al. Quantitative evaluation of 2-Deoxy-2-[ 18 F] Fluoro-D-Glucose Uptake in Hepatic Metastases with Combined PET-CT: Iterative Reconstruction with CT Attenuation Correction Versus Filtered Back Projection with 68 Germanium Attenuation Correction.
Rustin GJ, Galbraith SM, Anderson H, Stratford M, Folkes LK, Sena L, et al. Phase I clinical trial of weekly combretastatin A4 phosphate: clinical and pharmacokinetic results.
Anderson HL, Yap JT, Miller MP, Robbins A, Jones T, Price PM. Assessment of pharmacodynamic vascular response in a phase I trial of combretastatin A4 phosphate.
Galbraith SM, Maxwell RJ, Lodge MA, Tozer GM, Wilson J, Taylor NJ, et al. Combretastatin A4 phosphate has tumor antivascular activity in rat and man as demonstrated by dynamic magnetic resonance imaging.
Baselga J, Rischin D, Ranson M, Calvert H, Raymond F, Kieback DG, et al. Phase I safety, pharmacokinetic, and pharmacodynamic trial of ZD1839, a selective oral epidermal growth factor receptor tyrosine kinase inhibitor, in patients with five selected solid tumor types.
Gorre ME, Mohammed M, Ellwood K, Hsu N, Paquette R, Rao PN, et al. Clinical resistance to STI-571 cancer therapy caused by BCR-ABL gene mutation or amplification.
Kelly WK, Richon VM, O'Connor O, Curley T, MacGregor-Curtelli B, Tong W, et al. Phase I clinical trial of histone deacetylase inhibitor suberoylanilide hydroxamic acid administered intravenously.
Sawyers CL. Opportunities and challenges in the development of kinase inhibitor therapy for cancer.

