


Abstract
The brainstem nuclei of the reticular formation (RF) are critical for regulating homeostasis, behavior, and cognition. RF degenerates in tauopathies including Alzheimer disease (AD), progressive supranuclear palsy (PSP), and corticobasal degeneration (CBD). Although the burden of phopho-tau inclusion is high across these diseases, suggesting a similar vulnerability pattern, a distinct RF-associated clinical phenotype in these diseases indicates the opposite. To compare patterns of RF selective vulnerability to tauopathies, we analyzed 5 RF nuclei in tissue from 14 AD, 14 CBD, 10 PSP, and 3 control cases. Multidimensional quantitative analysis unraveled discernable differences on how these nuclei are vulnerable to AD, CBD, and PSP. For instance, PSP and CBD accrued more tau inclusions than AD in locus coeruleus, suggesting a lower vulnerability to AD. However, locus coeruleus neuronal loss in AD was so extreme that few neurons remained to develop aggregates. Likewise, tau burden in gigantocellular nucleus was low in AD and high in PSP, but few GABAergic neurons were present in AD. This challenges the hypothesis that gigantocellular nucleus neuronal loss underlies REM behavioral disorders because REM behavioral disorders rarely manifests in AD. This study provides foundation for characterizing the clinical consequences of RF degeneration in tauopathies and guiding customized treatment.
INTRODUCTION
Neurodegenerative diseases feature distinct patterns of neuronal loss and accumulation of proteinaceous inclusions, a phenomenon known as selective vulnerability or pathoklisis (1, 2). Despite its small size, the brainstem regulates vital functions for survival. Distributed between passing tracts and the cranial nuclei, the reticular formation (RF) extends from the midbrain to the medulla oblongata and encompasses numerous nuclei, including aminergic and cholinergic nuclei (3–5), making it a converging hub for afferent and central efferent communication. The RF orchestrates neuromodulatory functions via diffuse projections throughout the forebrain, brainstem, and spinal cord (6) and its structure is conserved in vertebrates. RF contributes to homeostatic regulation such as breathing and the sleep/wake cycle, especially via the ascending reticular activating system (ARAS) which maintains a waking state in both humans and animals and modulates mood (7–11). Furthermore, the RF modulates motor reflexes as well as voluntary control of basic behavior such as eating and drinking via the RF tracts descending to the spinal cord (8, 9). Symptoms attributed to RF disturbances are frequent, manifest early in the course of many neurodegenerative diseases, negatively impacting the quality of life of patients and caregiver, and constitute one of the most common reasons for having dementia patients institutionalized (12–18).
Most of the insights about RF function come from studies in animals. The lack of noninvasive methods to delineate and measure RF activity in vivo hampers studies in humans. In addition, regional neoplastic or vascular lesions show little about nucleus-specific functional anatomy in the RF because such lesions are rarely confined to a single nucleus.
Tauopathies, neurodegenerative diseases accruing hyperphosphorylated tau aggregated in the brain, include Alzheimer disease (AD), corticobasal degeneration (CBD), and progressive supranuclear palsy (PSP). In AD, 3- and 4-repeat tau isoforms aggregate (19), whereas in PSP and CBD, also known as 4-repeat tauopathies (4-RT), only 4-repeat tau isoforms aggregate (20, 21). Overall, the RF is heavily involved in all 3 tauopathies. In fact, the high levels of topographical overlap of tau aggregates in some RF nuclei, such as the locus coeruleus (LC) and dorsal raphe nucleus (DRN), suggest the RF share a similar pattern of vulnerability to distinct tauopathies. Nevertheless, symptoms associated with RF dysfunction as well as age at onset and stereotypical spread vary in these tauopathies. For instance, individuals with AD showing sleep disturbances redistribute sleep across night/day periods with minimal reduction in total sleep time (22). In contrast, individuals with PSP show a dramatic decrease in total sleep time and absent sleep during the day (23). Although sleep–wake circuits include cortical and subcortical structures, RF nuclei play major roles in sleep–wake regulation, and it is likely that distinct patterns of RF vulnerability contribute to differences in sleep dysfunction pattern in tauopathies. In light of these clinical and neuropathological differences among tauopathies, we hypothesize that RF nuclei show a distinct pattern of vulnerability, also within each nucleus to AD, CBD, and PSP that can be appreciated even at advanced disease stages.
Several functionally important RF nuclei are involved in tauopathies. For instance, the LC is the brain’s primary site of norepinephrine synthesis, a catecholamine acting as a hormone and neurotransmitter. Among the critical processes regulated by norepinephrine are wakefulness, alertness, and attention (24, 25). Norepinephrine strongly excites neurons belonging to the ARAS, and provides excitatory input to motor neurons during waking, increasing their response to excitatory input (26–28). The LC degenerates early and gradually along AD neuropathological progression (29, 30). Studies in animal models show that decline of norepinephrine levels negatively impact memory and learning abilities (31, 32). Moreover, LC degeneration may accelerate AD pathogenesis via dysregulation of microglia leading to increasing burden of amyloid-beta plaques (31). The substantia nigra (SN) comprises the largest network of dopaminergic cells in the brain. The ascending projections of the SN release dopamine into the basal ganglia and cortex, mediating voluntary movement, and reward and addictive behavior (3). The SN showed abundant tau inclusion burden and neuronal loss in PSP and CBD, possibly underlying the classical extrapyramidal signs seen in these patients. The gigantocellular nucleus (GCN) of the RF is a subregion of the medullary RF containing GABAergic, glycinergic, and glutamatergic neuronal populations. The function of GCN is poorly understood, but degeneration of the GCN has been associated with the loss of muscle atonia during REM sleep (33–35), regulation of the autonomic system (36), and hyperalgesia as part of the gain setting system (37, 38). This system, which also includes the caudal raphe nucleus and the LC, modulates somatosensory and viscerosensory input, as well as visceromotor and somatomotor output (36, 39). The pedunculopontine nucleus (PPN) is a core component of the ARAS and plays a role in generating and maintaining the rapid rhythms in the cortex associated with wakefulness and REM (40, 41). The PPN is classically defined as clusters of large cholinergic neurons at the junction of the midbrain and pons (42), but it also features separate populations of glutamatergic and GABAergic neurons (43, 44). Recent evidence suggests that activation of glutamatergic PPN neurons induces wakefulness, whereas inhibition increases non-REM sleep (45, 46). The DRN is the largest producer of serotonin in the brain. The DRN neurons degenerate in early AD stages (47) and serotonergic denervation correlates with behavioral changes in AD patients (48). Its wake-promoting neurons receive inputs from all other wake-active neuronal populations (49).
The concept of selective vulnerability refers to the brain areas that show increased protein aggregation or exhibit greater cell loss, and at a regional level, the cell subtypes that degenerate first following injury. Comprehensive studies addressing patterns of selective vulnerability of RF in different tauopathies are yet to be done. We used well-characterized human postmortem tissue from healthy elderly controls and patients with pure AD, PSP, or CBD to create and compare quantitative, multidimensional maps capturing the pattern of the selective neuronal vulnerability of selected RF nuclei for these tauopathies.
MATERIALS AND METHODS
Participants
This study was approved by University of California, San Francisco (UCSF) institutional review board. Human postmortem brainstem samples were sourced from the Neurodegenerative Disease Brain Bank (NDBB) at UCSF from cases procured in 2013 and 2014. The UCSF NDBB receives brain and spinal cord donations from patients enrolled in UCSF Memory and Aging Center research programs. All the “disease” subjects in this study passed away at advanced neuropathological stages (clinical dementia score [CDR] = 3 [50]). Control cases were supplied by the Brazilian BioBank for Aging Studies, formally known Brain Bank of the Brazilian Aging Brain Study Group (51, 52). Neuropathological assessment was performed following standardized protocols using immunohistochemistry and described in detail elsewhere (52–56).
For this study, subjects were selected based on a primary neuropathological diagnosis (AD, PSP, CBD, or normal controls). Exclusion criteria included an Axis 1 psychiatric diagnosis, gross nondegenerative structural brain pathology, and a postmortem interval ≥24 hours. All patients and controls were Caucasian (in Brazilian cases, ethnicity is determined by DNA ancestry markers to avoid bias in such an admixed population [57]). Tauopathy cases were excluded if the patient had another clinical neurological diagnosis besides dementia or met neuropathological criteria other than the target pathology for the given case. Control cases were free of any cognitive impairment (CDR = 0), neurological or neuropathological diagnosis and were scored A0B0C0 (Not Alzheimer’s Disease Neuropathologic Changes) according to the NIA-AA guidelines for neuropathological assessment of AD (58). Table 1 depicts the characteristics of the 41 cases (14 AD, 10 CBD, 14 PSP, and 3 controls). Neuronal quantification was done blinded to neuropathological and clinical diagnosis.
Demographics by Disease Status (n = 41)
| Demographics | Control (n = 3) | AD (all Braak VI) (n = 14) | CBD (n = 10) | PSP (n = 14) | p value |
|---|---|---|---|---|---|
| Age at death (years), mean (range) | 57.3 (45–66) | 68.3 (69–93) | 66.5 (68–73) | 70.5 (69–88) | 0.08 |
| Age at disease onset (years), mean (range) | NA | 57.2 (43–80) | 60.0 (61–67) | 61.7 (63–84) | 0.34 |
| Disease duration (years), mean (SD)a | NA | 10.4 (3.5) | 6.5 (2.4) | 8.8 (3.8) | 0.03 |
| Male sex, n (%)b | 1 (33.3) | 6 (42.9) | 4 (40.0) | 6 (42.9) | 1.00 |
AD, Alzheimer Disease; CBD, corticobasal degeneration; PSP, progressive supranuclear palsy.
One-way ANOVA.
Fisher’s exact test.
Regions of Interest
We examined 5 brainstem nuclei belonging to the RF. The nuclei were selected based on their involvement in the regulation of important physiological processes, especially the sleep/wake cycle and mood, as well as their vulnerability to accumulate tau-positive inclusions in all 3 diseases. We analyzed 1 horizontal histological section crossing each region of interest (ROI). We took measures to analyze each nucleus at the same level across all the cases, as follows: (1) the noradrenergic LC, at the level of upper third of the pons, (2) the dopaminergic SN, at the level of the caudal part of red nucleus (59), (3) the serotonergic DRN, at the level of the rostral part of the inferior colliculus, (4) the PPN, at the level of the rostral part of the inferior colliculus, and (5) the GABAergic gigantocellular nucleus of the RF (GCN), at the transition between pons and medulla oblongata.
Immunohistochemistry
Paraffin blocks containing the areas of interest were cut into 8-μm-thick sections that underwent double-labeled immunohistochemistry (IHC) (antibodies are described in Table 2). In short, BLOXALL blocking solution (Vector Labs SP-6000, Vector, Burlingame, CA) was used to inactivate endogenous peroxidase and alkaline phosphatase. Antigen retrieval was performed with the sections immersed in DIVA Decloaker (Biocare DV2004) in an autoclave at 121 °C for 5 minutes. For reducing nonspecific background staining, TBST/5% milk powder blocking solution was used, except in assays using the combination of antibodies against phospho-tau (CP13) and glutamate transporter 2 (VGlut2), where Background Sniper (Biocare Medical BS966) was used. When both primary antibodies were raised against the same species, an additional step with Denaturing Solution (DNS001H, 1:3, Biocare Medical) was added between the first and second primary antibody incubation. All sections were counterstained using QS hematoxylin (Vector Labs H-3404), blued with TBS and mounted. Positive and negative controls were included in all IHC runs.
Immunohistochemistry Information for Each Nucleus
| Region of Interest | First Primary Antibody and Dilution | Detection of First Primary Antibody | Second Primary Antibody and Dilution | Detection of Second Primary Antibody | Chromogen for Detecting First Primary Antibody | Chromogen for Detecting Second Primary Antibody |
|---|---|---|---|---|---|---|
| DRN | CP-13, mouse (p-tau, serine 202)1: 900, gift of Peter Davies, NY | Mach 2 Mouse HRP (MHRP520G, Biocare Medical) | Tryptophan hydroxylase (PH8, MAB5278 mouse, 1: 900, Millipore) | Biotinylated Horse Antimouse (Vector Labs BA-2000) + Vectastain ABC AP kit (AK-5000, Vector Labs) | Deep Space Black HRP (BR14015, Biocare Medical) | Vector Red Alkaline Phosphatase AP Substrate kit (SK-5100, Vector Labs) |
| GCN | CP-13, mouse, 1: 900 | Mach 2 Mouse HRP (MHRP520G, Biocare Medical) | GAD1 (MAB5406, rabbit, 1: 300, Millipore) | Mach 4 MR AP polymer (MRAP 536G, Biocare Medical) | Deep Space Black HRP | Vector Red Alkaline Phosphatase AP Substrate kit |
| LC | CP-13, mouse, 1: 900 | Mach 2 Mouse HRP (MHRP520G, Biocare Medical) | Tyrosine hydroxylase (TH, PA-1-4605, rabbit, 1: 700, Fisher Scientific) | Mach 2 Rabbit AP (RALP525, Biocare Medical) | Deep Space Black HRP | Vector Red Alkaline Phosphatase AP Substrate kit |
| PPN | CP-13, mouse, 1: 700 | Biotinylated Horse Antimouse (Vector Labs BA-2000) + Vectastain ABC HRP kit (Vector Labs AK-5000) | glutamate receptor (VGlut2, MAB 5504, mouse, 1: 800, Millipore) | Biotinylated Horse Antimouse (Vector Labs BA-2000) + Vectastain ABC AP kit (AK-5000, Vector Labs) | Deep Space Black HRP | Vector Red Alkaline Phosphatase AP Substrate kit |
| SN | CP-13, mouse, 1: 900 | Mach 2 Mouse HRP (MHRP520G, Biocare Medical) | Tyrosine hydroxylase (TH, PA-1-4605, rabbit, 1: 700, Fisher Scientific) | Mach 2 Rabbit AP (RALP525, Biocare Medical) | Deep Space Black HRP | Vector Red Alkaline Phosphatase AP Substrate kit |
DRN, dorsal raphe nucleus; GCN, gigantocellular nucleus; HRP, horseradish peroxidase; AP, alkaline phosphatase; LC, locus coeruleus; PPN, pedunculopontine nucleus; SN, substantia nigra; p-tau, phosphorylated tau.
Delineating the ROIs
The histological sections containing the ROIs were photographed using a high definition DSLR camera (EOS 5D Mark II, Canon, Tokyo, Japan) with macro lens mounted on a copy stand arm (Kaiser Fototechnik, Germany). The images were uploaded in Photoshop CS6 (Adobe System Inc., San Jose, CA) for stitching and adjustment of brightness, contrast, and white balance. The ROIs boundaries were traced over each image composite based on observation of the corresponding histological section under the microscope (Nikon labophot-2 microscope, at 40x magnification). Aided by the labeling of the neurotransmitter of interest, ROI boundaries were delineated based on Olszewski and Baxter’s Cytoarchitecture of the Human Brainstem (59), in a similar fashion we employed in previous studies (29, 30, 60).
Semiquantitative Analyses of the Markers of Interest
We counted all the neurons within the ROI at 1000x magnification and annotated the results in the corresponding digital photographs using the built-in counting tool in Adobe Photoshop CS6. The neurons were classified in 4 subgroups: (1) positive for the neurotransmitter of interest (NEU-positive), (2) bearing hyperphosphorylated tau neuronal cytoplasmic inclusions (tau-positive), (3) positive for the neurotransmitter of interest and bearing tau-positive (NEU-positive/tau-positive colocalized neurons), and (4) negative for NEU and tau. The total number of neurons was calculated by adding the numbers of tau-positive neurons, NEU-positive neurons, and neurons negative for both markers, and subtracting the number of colocalized (NEU-positive/tau-positive) neurons. Figure 1 depicts the conceptual scheme for subgrouping neurons, and Figure 2 illustrates IHC results. Although PSP and CBD show substantive glial tau inclusions in cortical and selective subcortical areas, neuronal inclusions predominate in our selected ROIs, thus we did not include glial inclusions in the counting.
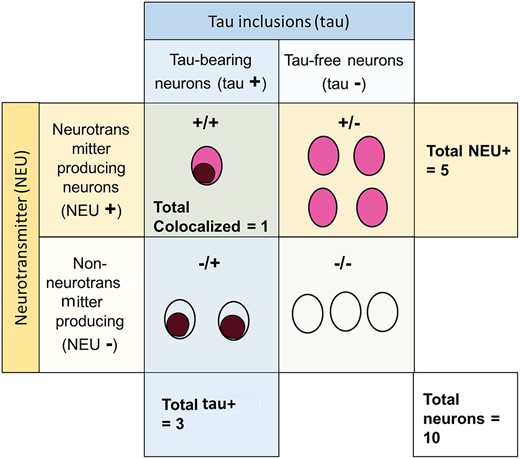
A diagram illustrating how cells were classified for analysis. Cells were classified as positive for the neurotransmitter of interest (NEU+) as indicated by the color red, or negative for the neurotransmitter of interest (NEU+) as indicated by a colorless circle. Cells were also classified by the presence of tau inclusions (tau+) indicated by a brown coloring within the cell, or the absence of tau inclusions (tau+). This generated 4 different groups: (i) number of colocalized neurons, (ii) number of NEU+ neurons, (iii) number of tau+ neurons, and (iv) the number of total neurons, including those negative for both tau and the neurotransmitter.
![Histological section (8-µm-thick) through the (A) dorsal raphe nucleus (double immunostained for phospho-tau [CP-13, in brown] and tryptophan hydroxylase [PH8, in red]) and (B) substantia nigra (CP-13, in brown) and tyrosine hydroxylase (PH8, in red)). The figure depicts some examples on how the neurons were classified: (1 and 6) tau-positive/NEU-positive colocalized; (2 and 5) neuron positive for neurotransmitter only (NEU-positive); (3) positive for phospho-tau only (tau-positive); and (4) neuron negative for phospho-tau and not expressing the neurotransmitter of interest.](https://oup.silverchair-cdn.com/oup/backfile/Content_public/Journal/jnen/77/2/10.1093_jnen_nlx113/1/m_nlx113f2.jpeg?Expires=1716322396&Signature=2hLFN1xLXrWGLmnauAuAnPc0bmFcCBgh0Zp7xJVPvsdKtqfBwjRz5V8hkcPvJNWzUd3bXMikABKGQfa9i3O~5RL05qSWB41wbhv2fglD35a6tXwQitaTtZ17aWgzTUxg04rSbpnvhcdZvy8S8T2G66XsvI5n5WtRLROvma~yoTInIiovd3WnDJc~D7nsEvjXpQovitK1o1WD6xjGuXxPmijEfL6UpVB5LQPpPESufFaU7Q02RQICNyDiYKf3iOXCkwXih2vEpXbl8Gp-jJa~zORPvGqSZOn07r6a5CxGSK0QiTXqAnPuzHxQBkmJZs-BQu0u1SP0zXHAvvdouVVzFA__&Key-Pair-Id=APKAIE5G5CRDK6RD3PGA)
Histological section (8-µm-thick) through the (A) dorsal raphe nucleus (double immunostained for phospho-tau [CP-13, in brown] and tryptophan hydroxylase [PH8, in red]) and (B) substantia nigra (CP-13, in brown) and tyrosine hydroxylase (PH8, in red)). The figure depicts some examples on how the neurons were classified: (1 and 6) tau-positive/NEU-positive colocalized; (2 and 5) neuron positive for neurotransmitter only (NEU-positive); (3) positive for phospho-tau only (tau-positive); and (4) neuron negative for phospho-tau and not expressing the neurotransmitter of interest.
Statistical Analysis
Neuronal counting was considered as absolute and relative numbers. The proportion of neurons from each subgroup was calculated by dividing the number of neurons positive in a given subgroup (1–3) by the total number of neurons counted in the same ROI. In addition, we also calculated the proportion of tau-bearing neurons (tau) relative to the total number of neurons positive for the neurotransmitter of interest in isolation (i.e. the percent of tau in serotonergic neurons in the DRN). For each nucleus, pairwise differences between each disease (AD, CBD, and PSP) and controls were evaluated using multivariable linear regression models adjusted for the age at death and disease duration. The alpha level was set at 0.05 and all tests were two-tailed. All analyses were conducted in the statistical computing program, R (61) with graphics generated using the package ggplot2 (62). We created multidimensional scatter plots (Fig. 3) to facilitate understanding of the results. We plotted the proportion of neurons positive for tau on the x-axis with the proportion of neurons positive for NEU on the y-axis. Each point represents a subject. The diameter of the point is proportional to the total number of neurons. The color of the point corresponds to the pathologically confirmed diagnosis, either AD, PSP, CBD, or control. Axes were scaled to maximize the spread of the points. In the same spirit, we also created neuroanatomical schemes (Fig. 4) generated by computing the difference between the results obtained for the given disease compared with the control. The number of neurons was expressed as the percent difference between the given disease and controls—the proportion of the beta coefficient from the regression to the arithmetic mean of the control, multiplied by 100. The percent tau and percent NEU illustrations depicted the difference between disease state and the control, given by the beta coefficient from the regression, which already refers to a percent.
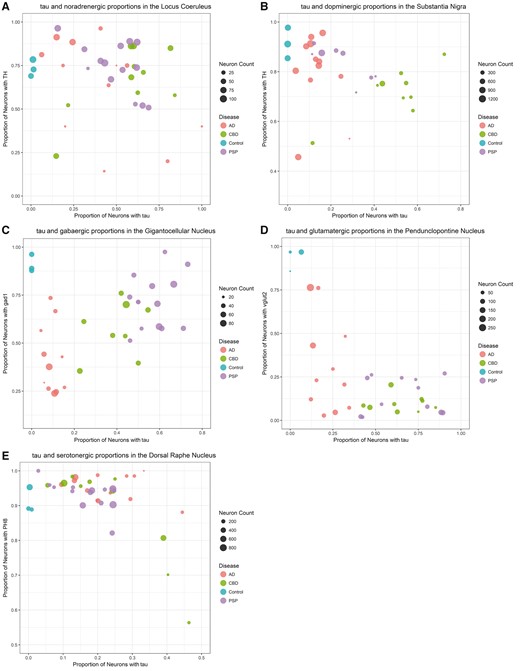
A multidimensional visual representation of the data of each of the 5 nuclei: locus coeruleus (A), substantia nigra (B), gigantocellular nucleus (C), pedunculopontine nucleus (D), dorsal raphe nucleus (E). The x-axis is the proportion of neurons bearing tau (tau+) and the y-axis is the proportion of neurons that express the neurotransmitter of interest (NEU+). The size of each dot is directly proportional to the neuronal numbers. The color of the dot indicates the diagnosis: Alzheimer disease (AD), progressive supranuclear palsy (PSP), corticobasal degeneration (CBD), or control.
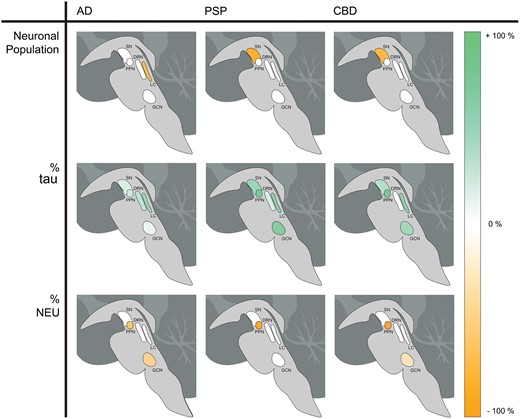
Neuroanatomical schemes showing the location of each nucleus of interest and the degree of difference between the disease compared with the control for the variable. The figure depicts the total number of neurons (upper row), percent of tau-bearing (tau-positive) neurons (middle row), and percent of neurotransmitter-synthesizing (NEU-positive) neurons (bottom row).
RESULTS
Table 1 summarizes the demographics of the 41 cases used in this study. The mean age of death was similar across the disease groups, but controls had a slightly lower age of death. All individuals died at advanced neuropathological stages and disease duration was longer in AD than in PSP and CBD. The results of the analyses are shown in Table 3. Figures 3 and 4 illustrate these results in a graphic manner.
Results Comparing Diseases in 5 Nuclei of Interest
| Control (n = 3) | AD (n = 14) | CBD (n = 10) | PSP (n = 14) | Control—AD | Control—CBD | Control—PSP | PSP—CBD | PSP—AD | CBD—AD | ||
|---|---|---|---|---|---|---|---|---|---|---|---|
| Locus coeruleus | |||||||||||
| Number of neurons | 70.7 (15.5) | 28.7 (26.9) | 52.1 (25.7) | 72.1 (23.0) | 47.88 (0.03) | 26.17 (0.21) | 8.81 (0.61) | 17.3 (0.14) | 44.98 (<0.001) | 19.79 (0.16) | |
| Proportion (%) of noradrenergic neurons | 73.4 (4.8) | 63.3 (28.0) | 66.4 (19.5) | 74.3 (14.5) | 0.12 (0.54) | 0.06 (0.67) | 0.04 (0.72) | 0.1 (0.21) | 0.11 (0.25) | 0.04 (0.78) | |
| Proportion (%) of tau-bearing neurons | 0.9 (0.8) | 41.6 (27.9) | 56.8 (22.4) | 59.6 (15.3) | −0.47 (0.03) | −0.54 (0.01) | −0.58 (<0.001) | −0.08 (0.35) | 0.14 (0.14) | 0.23 (0.13) | |
| Proportion (%) of tau bearing and noradrenergic neurons (colocalized) | 0 | 19.7 (15.4) | 39.8 (19.0) | 30.4 (12.2) | −0.25 (0.03) | −0.4 (0.02) | −0.37 (<0.001) | −0.09 (0.22) | 0.16 (0.01) | 0.24 (0.02) | |
| Proportion (%) of noradrenergic neurons bearing tau | 0 | 37.2 (35.0) | 56.7 (19.3) | 41.6 (15.0) | −0.46 (0.07) | −0.54 (<0.001) | −0.51 (<0.001) | −0.16 (0.04) | 0.11 (0.32) | 0.28 (0.1) | |
| Substantia nigra | |||||||||||
| Number of neurons | 898.0 (153.4) | 759.7 (309.2) | 258.7 (167.4) | 316.8 (313.3) | 212.7 (0.34) | 642.65 (<0.001) | 723.15 (0.02) | 1.02 (0.99) | −455.14 (0.01) | −440.62 (0.01) | |
| % of dopaminergic neurons | 91.4 (6.2) | 79.7 (15.5) | 71.8 (10.0) | 83.7 (7.0) | 0.08 (0.49) | 0.18 (0.05) | 0.11 (0.12) | 0.1 (0.07) | 0 (1) | −0.08 (0.23) | |
| % of tau-bearing neurons | 0.04 (0.07) | 13.4 (7.2) | 49.4 (16.7) | 24.8 (11.4) | −0.17 (<0.001) | −0.48 (<0.001) | −0.34 (<0.001) | −0.25 (0.01) | 0.13 (<0.001) | 0.3 (<0.001) | |
| % of colocalized neurons | 0.04 (0.07) | 8.0 (3.7) | 30.9 (16.2) | 11.9 (6.5) | −0.1 (<0.001) | −0.32 (0.03) | −0.15 (0.02) | −0.18 (0.04) | 0.05 (0.04) | 0.21 (<0.001) | |
| % of dopaminergic neurons bearing tau | 0.04 (0.07) | 9.8 (4.2) | 41.3 (17.5) | 14.5 (8.4) | −0.12 (<0.001) | −0.43 (0.01) | −0.19 (0.02) | −0.26 (0.01) | 0.06 (0.04) | 0.28 (<0.001) | |
| Gigantocellular nucleus | |||||||||||
| Number of neurons | 52.0 (2.65) | 43.4 (24.2) | 53.3 (18.9) | 57.4 (19.0) | 10.49 (0.55) | 5.24 (0.71) | 10.1 (0.48) | −2.26 (0.8) | 16.81 (0.06) | 16.8 (0.19) | |
| % of GABAergic neurons | 91.0 (5.0) | 41.1 (17.6) | 58.8 (14.2) | 71.8 (14.6) | 0.43 (<0.001) | 0.28 (0.03) | 0.04 (0.61) | 0.19 (0.01) | 0.34 (<0.001) | 0.21 (0.03) | |
| % of tau-bearing neurons | 0 | 9.4 (3.5) | 41.1 (11.1) | 57.8 (9.1) | −0.09 (<0.001) | −0.43 (<0.001) | −0.63 (<0.001) | 0.19 (<0.001) | 0.49 (<0.001) | 0.3 (<0.001) | |
| % of colocalized neurons | 0 | 4.4 (3.0) | 37.7 (10.5) | 54.4 (7.6) | −0.04 (0.11) | −0.41 (<0.001) | −0.61 (<0.001) | 0.2 (<0.001) | 0.51 (<0.001) | 0.33 (<0.001) | |
| % of GABAergic neurons bearing tau | 0 | 13.2 (12.0) | 65.8 (16.5) | 77.8 (14.0) | −0.08 (0.31) | −0.69 (<0.001) | −0.72 (<0.001) | 0.1 (0.22) | 0.65 (<0.001) | 0.53 (<0.001) | |
| Pedunculopontine nucleus | |||||||||||
| Number of neurons | 56.0 (58.6) | 90.6 (66.7) | 72.4 (36.5) | 68.6 (30.3) | −17.1 (0.74) | 8.76 (0.79) | −13.91 (0.64) | −10.53 (0.54) | −24.44 (0.34) | 3.1 (0.92) | |
| % of glutamatergic neurons | 93.1 (6.4) | 31.3 (26.7) | 9.6 (4.8) | 14.6 (10.3) | 0.58 (0.01) | 0.82 (<0.001) | 0.82 (<0.001) | 0.04 (0.28) | −0.22 (0.04) | −0.28 (0.04) | |
| % of tau-bearing neurons | 2.2 (3.8) | 21.7 (8.6) | 65.2 (14.5) | 66.0 (19.3) | −0.22 (<0.001) | −0.7 (<0.001) | −0.72 (<0.001) | 0.08 (0.34) | 0.45 (<0.001) | 0.38 (<0.001) | |
| % of colocalized neurons | 2.2 (3.8) | 4.8 (5.5) | 4.7 (3.3) | 7.5 (7.5) | −0.04 (0.32) | −0.01 (0.65) | −0.05 (0.39) | 0.02 (0.48) | 0.02 (0.52) | −0.03 (0.34) | |
| % of glutamatergic neurons bearing tau | 2.2 (3.9) | 16.0 (15.3) | 47.0 (33.0) | 47.7 (33.7) | −0.22 (0.04) | −0.33 (0.2) | −0.64 (0.02) | 0.03 (0.88) | 0.35 (0.01) | 0.3 (0.08) | |
| Dorsal raphe nucleus | |||||||||||
| Number of neurons | 356.7 (208.3) | 231.3 (165.9) | 319.7 (258.8) | 384.1 (256.4) | 171.68 (0.2) | −62.15 (0.76) | −19.64 (0.92) | −7.78 (0.95) | 194.54 (0.02) | 126.6 (0.24) | |
| % of serotonergic neurons | 91.1 (3.7) | 95.2 (3.7) | 88.2 (14.5) | 93.3 (4.1) | −0.05 (0.06) | 0.03 (0.78) | −0.03 (0.39) | 0.06 (0.22) | −0.02 (0.21) | −0.1 (0.07) | |
| % of tau-bearing neurons | 0.4 (0.5) | 23.3 (9.7) | 23.6 (14.0) | 16.8 (7.4) | −0.29 (<0.001) | −0.22 (0.06) | −0.17 (0.01) | −0.09 (0.07) | −0.07 (0.06) | 0.01 (0.9) | |
| % of colocalized neurons | 0 | 19.7 (15.4) | 39.8 (19.0) | 30.4 (12.2) | −0.25 (<0.001) | −0.12 (0.04) | −0.12 (0.02) | −0.04 (0.16) | −0.08 (0.01) | −0.08 (0.06) | |
| % of serotonergic neurons bearing tau | 0.3 (0.6) | 20.8 (9.0) | 16.6 (7.9) | 12.4 (6.5) | −0.26 (<0.001) | −0.14 (0.04) | −0.13 (0.02) | −0.06 (0.08) | −0.08 (0.01) | −0.06 (0.21) | |
The left side of the table gives the results of the one-way ANOVA, written as mean (SD). The right side of the table gives the results of the regression analysis comparing diseases, written as (p value). The value of reference is the first disease in the compared heading. Significant differences are bolded. When comparing a disease to controls the data were corrected for age and when a disease was compared with another tauopathy, the data were corrected for both age and disease duration. AD, Alzheimer disease; CBD, corticobasal degeneration; PSP, progressive supranuclear palsy.
Locus Coeruleus
Neurons were stained for tau (using antibody CP13) and tyrosine hydroxylase (TH), an enzyme involved in the synthesis of dopamine and noradrenaline. As expected, all 3 tauopathies had significantly more tau-positive neurons than the control cases. However, the proportion of tau-positive neurons was similar in the disease groups (Table 3). This is apparent in Figure 3A, as there is no distinct separation between the diseases along the x-axis which indicates the proportion of tau-positive neurons. When examining noradrenergic (TH-positive) neurons only, the proportion of tau-positive neurons relative to the total number of TH-positive neurons was significantly higher in CBD and PSP compared with controls, and AD showed a trend of higher proportion than controls (Table 3). All 3 diseases also had significantly more tau-positive/TH-positive colocalized neurons than control cases, and CBD and PSP had significantly more colocalized neurons than AD (Table 3). AD cases had the lowest number of total neurons. Although CBD and PSP cases showed similar total neuronal numbers to controls, AD cases had significantly fewer neurons than control and PSP cases. Although the CBD cases appear in an intermediate position between AD cases versus Control/PSP cases, the differences did not reach statistical significance (Table 3). In summary, all 3 diseases had similar proportions of tau burden but AD cases had fewer numbers of total neurons. Differences in neuronal number in AD and PSP cases are depicted in Figure 5A.
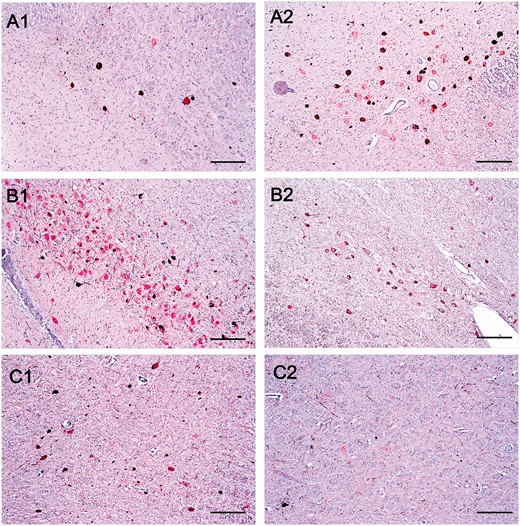
Comparison of histopathological features between Alzheimer disease (AD), corticobasal degeneration (CBD) and progressive supranuclear palsy (PSP). (A) Histological slides containing the locus coeruleus immunostained for phospho-tau and TH of an AD case (A1) and in a PSP case (A2). (B) Histological slides containing the substantia nigra immunostained for phospho-tau and TH of an AD case (B1) and a CBD case (B2). (C) Histological slides containing the gigantocellular nucleus in a PSP case (C1) and an AD case (C2). Scale bar: 25 µm.
Substantia Nigra
Neurons were stained for tau and TH. CBD and PSP cases had, in overall, fewer neurons than controls and AD cases. Although all 3 tauopathies showed a higher proportion of tau-positive neurons than controls, this proportion is the highest in CBD, followed by PSP and then by AD (Table 3). Figure 3B illustrates this, as the diseases are separated along the x-axis which describes tau-positive proportion. Concerning tau-positive/TH-positive colocalized neurons, the proportions are again higher in the 3 tauopathies than in controls and highest in CBD, then PSP, and finally AD. When isolating the dopaminergic (TH-positive) cells and analyzing the proportion of tau-positive and colocalized neurons relative to the total number of TH-positive cells, the same pattern was repeated: controls have the lowest proportion of tau-bearing neurons as expected, followed by AD, then PSP and CBD (Table 3).
In summary, CBD had the highest amount of tau burden followed by PSP, and both CBD and PSP had fewer total neurons than AD cases. Figure 5B shows the SN of an AD case as compared with that of a CBD case, illustrating the relative sparing of the SN in AD.
GCN of the RF
Neurons were stained for tau and glutamic acid decarboxylase 1 (GAD1), an enzyme that catalyzes the decarboxylation of glutamate to GABA and a canonical marker of GABAergic cells. Although PSP did not differ significantly from controls in the proportion of GABAergic (GAD-positive) neurons, both AD and CBD had a significantly smaller proportion of GAD-positive neurons than control and PSP, and AD had a significantly smaller proportion of GAD1-positive neurons than CBD. In fact, GABA-positive neurons were almost depleted in AD, and although the total number of GCN neurons between the diseases and controls were similar, the total number neurons in AD cases had a trend toward being fewer than in PSP (Table 3 andFig. 3C). Of the diseases, AD cases also showed the lowest proportion of tau-bearing neurons (tau-positive) and tau-positive/GAD1-positive colocalized neurons, whereas CBD was again in an intermediate position and PSP showed the highest proportion of both. Figure 3C shows a clear separation between the diseases along the x-axis, indicating a difference in proportion of tau-positive neurons, and AD cases were lower along the y-axis indicating a decreased proportion of GAD-positive neurons. When analyzing the GABAergic neurons only, both PSP and CBD had a significantly higher proportion of tau-positive neurons relative to total GAD-positive neurons than the controls and AD cases, but it is important to note that almost very few GAD-positive neurons were left in AD cases (Table 3).
In summary, AD cases had both a lower proportion of GABAergic neurons and tau-positive neurons when compared with PSP and CBD, and had a trend toward fewer total neurons compared with PSP. PSP cases had high proportions of both tau-positive neurons and GAD-positive neurons. Figure 5C illustrates the GCN of an AD case compared with a PSP case, illustrating the depletion of GAD1 immunoreactivity in GCN neurons in AD cases despite the lack of tau inclusions.
Pedunculopontine Nucleus
Neurons were stained for tau and glutamate transporter 2 (VGlut2), which is involved in packaging glutamate into vesicles and is a canonical marker of the brainstem’s glutamatergic neurons. The total neuronal numbers in controls and all 3 tauopathies were similar. However, in control cases, practically all neurons stained positive for VGlut2, whereas the percentage of neurons immunoreactive for VGlut2 dropped significantly in AD and reached the lowest point in CBD and PSP cases (Table 3), suggesting a possible neuronal dysfunction, despite the fact that such neurons show normal morphological features on hematoxylin staining. Figure 3D illustrates this, as the PSP and CBD cases are lowest on the y-axis which indicates proportion of Vglut2-positive neurons. Although as expected, all tauopathies had a significantly higher proportion of tau-bearing neurons than controls, this proportion was significantly higher in PSP and CBD than in AD, as Figure 3D illustrates with AD cases being lower on the x-axis (indicating lower proportions of tau-positive neurons) as compared with PSP and CBD, whereas PSP and CBD were not segregated along the x-axis. When isolating glutamatergic (VGlut2-positive) neurons, both PSP and CBD had a significantly higher proportion of tau-positive neurons relative to total number of VGlut2-positive neurons when compared with controls and AD.
In summary, compared with AD cases, PSP and CBD cases had higher levels of tau burden and lower proportions of glutamatergic neurons.
Dorsal Raphe Nucleus
Neurons were stained with tau and tryptophan hydroxylase (PH8), an enzyme that converts 5-hydroxy-tryptophan to serotonin. Disease and control cases showed similar total neuronal number or proportion of serotonergic (PH8-positive) neurons. As expected, all 3 tauopathies showed a higher proportion of tau-bearing (tau-positive) neurons and tau-positive/PH8-positive colocalized neurons than controls (Table 3 andFig. 3E). In addition, AD showed a higher proportion of tau-positive/PH8-positive colocalized neurons than PSP. The proportion of tau-positive neurons relative to the total number of PH8-positive neurons was higher in AD than in PSP, corroborating the result above.
In summary, all 3 diseases showed increased tau burden as compared with controls, but there was no significant decrease in neuronal number in any of the diseases and proportions of tau did not very greatly among the tauopathies.
DISCUSSION
Here, we analyzed neuropathological changes and patterns of selective neuronal vulnerability in 5 human brainstem nuclei from individuals with AD, CBD, or PSP. Although we found phospho-tau aggregates in all 5 nuclei, the patterns of vulnerability, highlighted by multidimensional analysis, varied in each disease.
AD Versus 4-Repeat Tauopathies (PSP and CBD)
All 5 nuclei showed a distinct pattern of vulnerability to AD and 4-RT. Interestingly, despite sharing multiple features (neurotransmitter precursor, presence of neuromelanin, and large cellular bodies) SN neurons (total numbers and dopaminergic only) died significantly more in 4-RT than in AD, whereas LC neurons (total numbers and noradrenergic only) died at large numbers in AD, but not in 4-RT. Our findings on SN and LC agree with RF-associated phenotype in these tauopathies. Although AD patients manifest reverse learning dysfunction (a hippocampal dependent function modulated by the LC) at early stages, parkinsonism (a symptom associated with SN degeneration) manifests in PSP and CBD (63, 64). In addition, degeneration of the wake-promoting LC neurons may partially explain why AD patients experience multiple periods of falling asleep during the day (sundowning) (65, 66). Previous studies had shown LC vulnerability and SN sparing to AD (67), but here, we highlighted these differences by comparing the 3 tauopathies side by side and combining countings of neuronal subpopulations and tau burden. It has been hypothesized that LC neurons are more vulnerable than SN neurons to AD because the latter have more dendritic ramifications (67), which potentially confers resilience against neurodegenerative processes (68). However, our results failed to support this theory since in 4-RT SN neurons were more depleted than LC neurons.
Had we compared the number of phospho-tau bearing LC neurons only, as done previously (69), results would suggest that LC is more vulnerable to 4-RT than to AD. However, using multidimensional analyses, we found a smaller number of tau bearing neurons in AD reflecting an extreme neuronal loss, rather than a lower predisposition of LC neurons to develop AD-type tau aggregates. Indeed, the proportions of LC neurons bearing tau inclusions were similar across the diseases, suggesting either a higher toxicity of AD-type tau inclusions to LC cells, or a linear relationship between disease duration (longer in AD) and neuronal loss regardless of the disease. Examining on noradrenergic neuronal subpopulation, AD showed fewer neurons and lower proportion of tau aggregates relative to the noradrenergic population in LC, corroborating the hypothesis that noradrenergic neurons are more vulnerable to AD than to 4-RT. In SN, CBD showed the lowest number of dopaminergic neurons but still, the proportion of colocalized neurons was higher in CBD. As all cases are at advances stages, it is possible that SN dopaminergic neurons bearing tau inclusions would have died if the disease took a longer course. However, toxicity of tau inclusion in CBD may not reach a high enough threshold to cause massive cell death implying that treatment targeting disease process may rescue SN function in CBD even at severe stages.
Patterns of selective vulnerability between AD and 4-RT also vary in GCN and PPN. In GCN, we found a trend for lower overall neuronal numbers in AD compared with PSP. However, GABAergic cells were highly depleted in AD, whereas GABAergic cells remained present in PSP and CBD. In addition, GCN neurons accrued high numbers of phospho-tau inclusions in PSP and CBD and almost no tau-positive neurons were found in AD. These results indicate a couple of possibilities: either GCN neurons are not susceptible to accrue AD-type tau inclusion and another AD-associated change is toxic to GCN neurons causing interruption of GABA synthesis, or AD-type tau inclusions accumulate at early stages of the disease triggering interruption of GABA synthesis and eventual cell loss. Studies using cases at early AD stages may clarify this question. Regardless of the mechanisms involved in the loss of GABAergic neurons, our results certainly challenge the concept that REM behavioral disorder (RBD) follows GCN neuronal loss (33, 34). AD patients remain free of RBD along the disease course, except in rare cases that are yet to be confirmed by autopsy (70, 71). In fact, while the GCN has been associated with nociceptive control and the gain setting system, the function of the GCN in humans is poorly understood (38).
Neuronal numbers in PPN remain similar to controls in all 3 tauopathies. Although most neurons in controls are glutamatergic, their numbers drop in AD and are reduced even more in the 4-RT. It is possible that tau inclusions hamper PPN neurons ability to produce glutamate without killing the cells. In fact, tau burden is higher, and the proportion of glutamatergic neurons is lower in 4-RT than in AD. Recent findings suggest that glutamatergic transmission from the PPN could play a role in parkinsonian-like conditions (72) and in regulating non-REM sleep (46), both present in PSP. We recently demonstrated that PSP patients feature a unique signature of sleep deprivation coupled with non-REM dysfunction (23). As dopaminergic neurons of the SN receive input from glutamatergic neurons of the PPN (73), loss of glutamatergic neurons from the PPN could contribute to depletion of dopaminergic SN neurons seen in 4-RTs.
Finally, the pattern of selective vulnerability in the DRN was the most similar across the diseases. All 3 tauopathies were largely spared from cell death despite accruing tau inclusions. AD showed slightly higher numbers of serotonergic neurons bearing tau inclusions than 4-RTs, but this difference was only statistically significant when compared with PSP. In a previous publication, we demonstrated that DRN start accruing tau inclusions in AD earliest stages (47) and other studies suggest AD-related neuronal loss in DRN (3, 67). However, in a recent study with an independent sample using stereology, we failed to show AD-associated neuronal loss in DRN, even at late disease stage (30).
Neuronal loss strongly correlates to clinical symptoms in neurodegenerative diseases and factors associated with neuronal resilience against phospho-tau inclusions may explain why accruing tau inclusions causes variable loss of neurons (74). However, it is important to notice that neuronal dysfunction in viable neurons also impacts brain function. Although studies in postmortem tissue are not suitable for investigating neuronal function, by probing neurons for presence of neurotransmitters, we demonstrated differences in neuronal vulnerability patterns to tau inclusions not captured by comparing tau accrual and total neuronal numbers. Finally, it has been shown that other tau posttranslational modifications can be even more neurotoxic than phospho-tau (75). Comparing accrual of other tau posttranslational modifications to neuronal dysfunction and actual death in tauopathies could help refine the understanding of tau toxicity and neuronal dysfunction.
PSP Versus CBD
The patterns of vulnerability between CBD and PSP were slightly different, especially in the SN and the GCN. In the SN, CBD and PSP showed similar total number of neurons, although the numbers of dopaminergic neurons were lower in CBD. This higher vulnerability of dopaminergic neurons to CBD could reflect in worse parkinsonism severity, for instance. Further studies integrating clinical phenotypes associated with distinct SN degeneration in PSP and CBD could assist in customizing symptomatic treatment in 4-RT. In the GCN, PSP cases showed a slightly higher proportion of GABAergic neurons than CBD, although these neurons also showed a higher phospho-tau burden. Either, we captured a scenario in which tau inclusions would drive loss of GABA synthesis, had the disease duration been longer, or CBD-type tau inclusions are more toxic to GABAergic neurons than the PSP counterpart. We failed to find any discernible difference in the PPN between PSP and CBD. Our results contradict a previous study which found a higher of PPN neuronal tau inclusions in PSP than CBD. However, that study had a significantly smaller sample size (3 PSP cases and 1 CBD case) and lacked healthy controls (76).
Limitations
Although this study represents a step ahead in the understanding of the selective vulnerability of RF nuclei to tauopathies, it also has limitations. First, the quantitative approaches employed can potentially lead to biased results. Aiming to minimize this limitation, we emphasized mainly changes in proportions rather than absolute numbers. Unbiased stereological studies require sampling the full extent of the ROI. As PSP and CBD are rare diseases, tissue repositories prioritize sharing the samples with a large number of investigators, thus making it challenging to obtain the tissue necessary for stereology. Here, we prioritized increasing the sample size and investigating multiple ROIs. In addition, AD is very prevalent, and most of our ROIs accrue AD-type tau from early stages (77). Therefore, we could only use a fraction of the PSP and CBD available in UCSF/NDBB, because we had to exclude cases with AD pathology. Furthermore, this study is cross-sectional, an inherent limitation of postmortem studies, and only includes cases at late disease stages. As RF associated disturbances are present from early stages of all of these tauopathies, studies including postmortem tissue from patients at different disease stages, similar to those we conducted in AD (29, 30, 78) would provide more information about the onset of abnormal tau accumulation and neuronal dysfunction. However, PSP and CBD neuropathological staging systems are still a work in progress and patients passing away at early stages of 4-RT rarely come to autopsy. Another limitation refers to the high variability of neurons in healthy subjects. Therefore, without knowing the neuronal number at baseline for each subject, it is not possible to determine if a smaller number of neurons in disease groups compared with controls represents a real neuronal loss or a lower neuronal number at baseline. In addition, the use of potentially biased quantitative methods may mask effects of tissue volume shrinkage into neuronal densities. For instance, if a certain region of interest loses more tissue volume during the disease progression (because of neuronal shrinkage or degeneration of processes) than neurons, the neuronal density increases in disease cases compared with controls. We found a high magnitude of change in neuronal numbers (total, NEU-positive only, or both) in cases compared with controls in LC, SN, and PPN. The absence of evident neuronal loss in DRN, and PPN and GCN (concerning total neuronal numbers) could be a result of a subtle neuronal loss in this ROI coupled with lack of statistical power. There is also the possibility of type 1 error since we investigated several associations and we did not correct the results for multiple comparisons. Finally, cross-sectional studies are correlative and cannot infer causation. Thus, caution should be exerted in interpreting the results.
In summary, this study shows a unique pattern of selective vulnerability in AD, PSP, and CBD. These differences vary for each nucleus, and are highlighted in the multidimensional analyses (including tau burden, neuronal counts by neuronal type, and so forth). This study represents a novel effort to characterize differential patterns of neuropathological changes among these tauopathies that may serve as a groundwork for understanding the neurobiological basis of brainstem dysfunctions in these 3 tauopathies that may guide customized symptomatic treatment. Moreover, probing distinct neuronal types may provide insights on factors influencing neuronal resilience and encourage studies using cell models including expanding on neuronal types to which these cells are differentiated for deciphering the mechanisms of neuronal vulnerability to tau inclusions.
ACKNOWLEDGMENTS
The authors thank the patients and their families for their invaluable contribution to brain aging neurodegenerative disease research.
REFERENCES
Author notes
This study was supported by the Tau Consortium/Rainwater charity foundation and grants from the Institutional grants P50AG023501, P01AG019724. LTG mentoring efforts is supported by K24AG053435. RE was awarded the URAP summer stipend from UC Berkeley's Undergraduate Research Apprentice Program.
The authors have no duality or conflicts of interest to declare.
