


Abstract
Respiratory syncytial virus (RSV) is a major cause of hospitalizations in young children. We estimated the burden of community-onset RSV-associated hospitalizations among US children aged <2 years by extrapolating rates of RSV-confirmed hospitalizations in 4 surveillance states and using probabilistic multipliers to adjust for ascertainment biases.
From October 2014 through April 2015, clinician-ordered RSV tests identified laboratory-confirmed RSV hospitalizations among children aged <2 years at 4 influenza hospitalization surveillance network sites. Surveillance populations were used to estimate age-specific rates of RSV-associated hospitalization, after adjusting for detection probabilities. We extrapolated these rates using US census data.
We identified 1554 RSV-associated hospitalizations in children aged <2 years. Of these, 27% were admitted to an intensive care unit, 6% needed mechanical ventilation, and 5 died. Most cases (1047/1554; 67%) had no underlying condition. Adjusted age-specific RSV hospitalization rates per 100 000 population were 1970 (95% confidence interval [CI],1787 to 2177), 897 (95% CI, 761 to 1073), 531 (95% CI, 459 to 624), and 358 (95% CI, 317 to 405) for ages 0–2, 3–5, 6–11, and 12–23 months, respectively. Extrapolating to the US population, an estimated 49 509–59 867 community-onset RSV-associated hospitalizations among children aged <2 years occurred during the 2014–2015 season.
Our findings highlight the importance of RSV as a cause of hospitalization, especially among children aged <2 months. Our approach to estimating RSV-related hospitalizations could be used to provide a US baseline for assessing the impact of future interventions.
Respiratory syncytial virus (RSV) is a major cause of respiratory infections and hospitalizations among young children in the United States [1–4]; RSV generally circulates from October through early May [5]. Several RSV vaccine candidates and long-acting monoclonal RSV-neutralizing antibodies are under development, with candidates in phase 1–3 trials [6]. Children aged <2 years are a priority target for vaccination as they have a high burden of severe RSV-associated disease and contribute to the spread of RSV in the community [7]. With RSV vaccines expected to be available in the upcoming years, it is important to establish nationally representative baseline estimates of RSV hospitalizations. These estimates can help to inform vaccination or monoclonal antibody strategies, and if these candidates are licensed, may be used to evaluate their impact post-introduction.
Traditionally, hospital discharge records have been used to estimate national RSV-associated hospitalizations. However, this approach has lacked individual-level laboratory-confirmed RSV data and may be subject to misclassification of RSV with discharge diagnosis likely including other causes of acute respiratory infections [8, 9]. Laboratory-confirmed, prospective, population-based RSV disease burden estimates have been limited by small catchment size [1, 10, 11]. We adapted an influenza disease–burden model that uses data from a national population-based surveillance platform of laboratory-confirmed RSV hospitalized cases. We developed probabilistic multipliers that account for testing practices and test method sensitivities to adjust for biases in RSV case ascertainment [12]. In this pilot study, we aimed to estimate age-specific RSV-associated hospitalization rates among children aged <2 years and to describe the epidemiological and clinical characteristics of US children hospitalized with RSV.
METHODS
RSV Surveillance
From 1 October 2014 through 30 April 2015, we identified laboratory-confirmed RSV-associated hospitalizations among children aged <2 years from 4 Influenza Hospitalization Surveillance Network (FluSurv-NET) sites: California, Georgia, Minnesota, and Oregon [13]. The 4 participant sites encompassed 20 hospitals and had a catchment population of approximately 4% of the US population aged <2 years. Hospitalization was defined as an admission to an inpatient hospital ward regardless of whether the patient stayed overnight. Date of hospital admission was defined as the date of admission to the inpatient ward. RSV cases were identified through hospital admission, discharge, laboratory, and infection-control practitioner logs. Laboratory testing for RSV was clinician-driven, and cases were identified by positive test results based on polymerase chain reaction (PCR), rapid test (antigen detection), viral culture, or fluorescent antibody. Children were included in surveillance if they were aged <2 years, a resident in the surveillance catchment area, and had community-onset RSV, defined as diagnosis of laboratory-confirmed RSV infection within 7 days prior to or 3 days after hospital admission. We aimed to identify acute cases (diagnosed no longer than 10 days from illness onset). Only cases identified as laboratory-confirmed RSV in the first 3 days of hospitalization were included to avoid inclusion of possible nosocomial RSV infections. Medical records were reviewed for sociodemographic data (age, sex, race, ethnicity, insurance type), RSV testing results, medical history, palivizumab receipt (any time and any number of doses during the season), and clinical course, including admission to an intensive care unit (ICU), need for mechanical ventilation (including extracorporeal membrane oxygenation), and diagnosis of coinfections with other bacterial or viral pathogens.
Correction of Case Ascertainment
To adjust for under-ascertainment of cases, we collected additional data about RSV testing from a sample of patients admitted to each surveillance hospital who met our definition for acute respiratory illness (ARI). For this, we screened hospital discharge logs for predefined International Classification of Diseases, Ninth Revision, Clinical Modification
(ICD-9) codes (079.6, RSV; 466.11, acute bronchiolitis due to RSV; 466.19, acute bronchiolitis due to other infectious agents; and 799.02, hypoxemia for children aged <6 months and 079.6, 466.11, 466.19, 486 [pneumonia], and 382.9 [unspecified otitis media] for children aged 6–23 months of age). The code selection was based on a population-based study that tested prospectively all children with respiratory illness for RSV using PCR. Testing was done as part of research, and results were not shared with clinicians [11]. We looked at the most common ICD-9 codes used in children aged <2 years who were hospitalized with respiratory illness and confirmed as RSV that covered >95% of the cases. We selected a stratified random sample of at least 80 eligible patients per month (December through April) and by age group (15 from <3 months, 15 from 3–5 months, 20 from 6–11 months, and 30 from 12–23 months). For each selected patient, we collected the following information from medical charts: whether the patient was tested for RSV and, among those tested, the test type and results and hospitalization outcomes (ie, ICU admission and death).
Estimating RSV Disease Burden
Following a previously described method [12], we used the FluSurv-NET site-specific surveillance catchment population of the 4 sites included in this study (overall 309 000 children aged <2 years) to estimate age-specific (ie, 0–2, 3–5, 6–11, 12–23 months) rates of RSV-associated hospitalization, adjusting for detection probabilities (ie, testing practices and test method sensitivity). Detection probabilities were estimated as the inverse product of the proportion of patients tested for RSV and the sensitivities of the tests performed, adjusted by site. The sensitivity of rapid antigen tests varies from 70% to 90% [14–16]. For the purpose of this analysis, we used an estimated sensitivity of 80% for rapid antigen tests in a pediatric population [14, 15], 100% for molecular diagnosis [15, 17, 18], 90% for cell culture [19], and 85% for immunofluorescence [20, 21]. The 95% confidence intervals (CIs) for hospitalization rates were calculated by bootstrapping the number of hospitalizations and the detection multiplier, accounting for variability of testing and test sensitivities by site. Assuming the observed rates were similar to the true rates, we extrapolated these rates and their 95% CIs to the US population using 2014 census data to estimate the burden of community-onset RSV-associated hospitalizations for the entire US population. All analyses were performed using R software (version 3.4.0) and Microsoft Excel 2016 (v16.0).
Ethics
This study was considered nonresearch for public health purposes by the Centers for Disease Control and Prevention (CDC). Participating sites obtained approval for the FluSurv-NET RSV surveillance protocol from their respective state and local institutional review boards, as needed.
RESULTS
RSV Surveillance: Characteristics and Outcomes of Laboratory-Confirmed RSV Cases
A total of 1554 laboratory-confirmed RSV cases who met the inclusion criteria were identified at the 4 FluSurv-NET sites during the study period. Of these, 40% (614), 17% (262), 19% (300), and 24% (378) were aged 0–2, 3–5, 6–11, and 12–23 months, respectively (Table 1). Race/ethnicity varied by site; Hispanic children were more frequently represented in California (44%), black non-Hispanic (45%) children in Georgia, and white non-Hispanic children in Oregon (53%) and Minnesota (44%). Public health insurance was frequent (approximately 70% of cases) in California, Georgia, Oregon, whereas 62% of RSV cases in Minnesota had private insurance. Sixty-seven percent (1047) had no underlying medical condition. Among the remaining 507 children, the most common underlying medical conditions included prematurity, defined as neonates born at <37 weeks of gestation (51%; 257/507); asthma (17%; 86/507); cardiovascular diseases (15%; 75/507); and neurologic/neuromuscular disorders (15%; 76/507). Signs and symptoms at admission did not differ substantially by site, although some variations were observed, including shortness of breath (range by site, 59%–85%), tachypnea (41%–73%), and hypoxemia (6%–37%). Palivizumab use was reported in 19 children (aged 3–19 months). Among all cases, 27% (416) were admitted to the ICU (range, 13%–45% by site), with a median of 4 days for ICU length of stay (interquartile range [IQR], 3, 7). Overall, 6% (93) of admissions required mechanical ventilation (range, 2%–9% by site). The median length of hospital stay was 3 days (IQR, 2, 5). There were 5 deaths; among them, 4/5 were aged ≤6 months, 3/5 were born prematurely (range, 33–35 weeks of gestation), and we did not identify palivizumab receipt in any of these cases, although outpatient records were not reviewed. All of them (5/5) were admitted to the ICU; 3/5 received mechanical ventilation, and their hospital length of stay ranged from 2 to 120 days (further detail are provided in Supplementary Table 1).
Demographic and Clinical Characteristics of Respiratory Syncytial Virus Hospitalizations Among Children Aged <2 Years, by Study Site, Influenza Hospitalization Surveillance Network, October 2014–April 2015
| Characteristic | California N = 393 n (%) | Georgia N = 491 n (%) | Oregon N = 187 n (%) | Minnesota N = 483 n (%) | Total N = 1554 n (%) |
|---|---|---|---|---|---|
| Age group, months | |||||
| 0–2 | 161 (41) | 187 (38) | 83 (44) | 183 (38) | 614 (40) |
| 3–5 | 53 (13) | 73 (15) | 38 (20) | 98 (20) | 262 (17) |
| 6–11 | 81 (21) | 91 (19) | 33 (18) | 95 (20) | 300 (19) |
| 12–23 | 98 (25) | 140 (29) | 33 (18) | 107 (22) | 378 (24) |
| Sex | |||||
| Female | 161 (41) | 201 (41) | 83 (44) | 214 (44) | 659 (42) |
| Race/Ethnicity | |||||
| Hispanic | 172 (44) | 101 (21) | 47 (25) | 40 (8) | 360 (23) |
| White non-Hispanic | 49 (12) | 133 (27) | 100 (53) | 212 (44) | 494 (32) |
| Black non-Hispanic | 41 (10) | 219 (45) | 13 (7) | 102 (21) | 375 (24) |
| Other a | 45 (11) | 26 (5) | 19 (10) | 78 (16) | 168 (11) |
| Missing data | 86 (22) | 12 (2) | 8 (4) | 51 (11) | 157 (10) |
| Health insurance | |||||
| Public | 283 (72) | 361 (74) | 126 (67) | 166 (34) | 936 (60) |
| Private | 89 (23) | 123 (25) | 57 (30) | 298 (62) | 567 (36) |
| Both | 14 (4) | 2 (0) | 4 (2) | 17 (4) | 37 (2) |
| None | 4 (1) | 2 (0) | 0 (0) | 2 (0) | 8 (1) |
| Underlying condition | |||||
| No underlying condition or born premature | 277 (70) | 318 (65) | 103 (55) | 349 (72) | 1047 (67) |
| Yes | |||||
| Prematurityb Gestational age in weeks (min-max) | 66 (17) 25–36 | 81 (16) 23–36 | 30 (16) 24–36 | 80 (17) 25–36 | 257 (17) 23–36 |
| Asthma | 24 (6) | 38 (8) | 8 (4) | 16 (3) | 86 (6) |
| Cardiovascular disease | 14 (4) | 25 (5) | 21 (11) | 15 (3) | 75 (5) |
| Neurologic/neuromuscular disorders | 16 (4) | 30 (6) | 14 (7) | 17 (4) | 76 (5) |
| Chronic lung disease | 16 (4) | 10 (2) | 6 (3) | 12 (2) | 44 (3) |
| Abnormality of upper airway | 4 (1) | 6 (1) | 10 (5) | 10 (2) | 30 (2) |
| Blood disease | 3 (1) | 7 (1) | 3 (2) | 4 (1) | 17 (1) |
| Renal disorder | 4 (1) | 1 (0) | 5 (3) | 2 (0) | 12 (1) |
| Immunocompromised condition | 1 (0) | 0 (0) | 1 (1) | 3 (1) | 5 (0) |
| Chronic metabolic disease | 1 (0) | 1 (0) | 0 (0) | 2 (0) | 4 (0) |
| Liver disease | 0 (0) | 1 (0) | 1 (1) | 1 (0) | 3 (0) |
| Other conditionsc | 22 (6) | 46 (9) | 37 (20) | 20 (4) | 125 (8) |
| Signs and symptoms at admission | |||||
| Cough | 348 (89) | 406 (83) | 177 (95) | 389 (81) | 1320 (85) |
| Congested/runny nose | 335 (85) | 349 (71) | 163 (87) | 300 (62) | 1147 (74) |
| Shortness of breath/respiratory distress | 248 (63) | 292 (59) | 159 (85) | 336 (70) | 1035 (67) |
| Fever/chills | 246 (63) | 303 (62) | 125 (67) | 256 (53) | 930 (60) |
| Tachypnead | 234 (60) | 203 (41) | 136 (73) | 309 (64) | 882 (57) |
| Inability to eat, poor feeding | 242 (62) | 241 (49) | 158 (84) | 131 (27) | 772 (50) |
| Vomiting | 183 (47) | 141 (29) | 87 (47) | 131 (27) | 542 (35) |
| Wheezing | 123 (31) | 95 (19) | 83 (44) | 122 (25) | 423 (27) |
| Hypoxemiae | 99 (25) | 28 (6) | 62 (33) | 177 (37) | 366 (24) |
| Diarrhea | 79 (20) | 56 (11) | 45 (24) | 59 (12) | 239 (15) |
| Lethargy | 87 (22) | 23 (5) | 62 (33) | 42 (9) | 214 (14) |
| Dehydration | 49 (12) | 1 (0) | 43 (23) | 28 (6) | 121 (8) |
| Cyanosis | 29 (7) | 28 (6) | 23 (12) | 14 (3) | 94 (6) |
| Ear infection | 12 (3) | 1 (0) | 27 (14) | 22 (5) | 62 (4) |
| Decreased vocalization or stridor | 10 (3) | 7 (1) | 9 (5) | 4 (1) | 30 (2) |
| Seizures | 11 (3) | 6 (0) | 2 (1) | 6 (1) | 25 (2) |
| Hypothermia | 4 (1) | 1 (0) | 2 (1) | 0 (0) | 7 (0) |
| Time from symptom onset to admission, days | |||||
| ≤2 | 110 (28) | 218 (44) | 42 (22) | 199 (41) | 569 (37) |
| 3- 00204 | 150 (38) | 146 (30) | 64 (34) | 162 (34) | 522 (34) |
| ≥5 | 128 (33) | 113 (23) | 79 (42) | 115 (24) | 435 (28) |
| Severity measures | |||||
| ICU admission | 72 (18) | 223 (45) | 58 (31) | 63 (13) | 416 (27) |
| ICU LOS, median (IQR), days | 4 (2,7) | 4 (3,7) | 4 (3,8) | 5 (3,8) | 4 (3,7) |
| Mechanical ventilation | 9 (2) | 46 (9) | 10 (5) | 28 (6) | 93 (6) |
| Death | 0 (0) | 4 (1) | 0 (0) | 1 (0) | 5 (0) |
| Hospital LOS (median/IQR), days | 3 (2, 4) | 4 (2, 6) | 3 (2, 5) | 3 (2, 5) | 3 (2, 5) |
| Bacterial infection | |||||
| Tested for bacteria f | 165 (42) | 258 (53) | 76 (41) | 199 (41) | 698 (45) |
| Bacteria confirmation from those tested f | 9/165 (5) | 14/258 (5) | 6/76 (8) | 14/199 (7) | 43/698 (6) |
| Viral codetection | |||||
| Tested for other viruses g | 330 (84) | 480 (98) | 122 (65) | 456 (94) | 1388 (89) |
| Coinfection with other virus, confirmation from those tested | 23/330 (7) | 94/480 (20) | 8/122 (7) | 19/456 (4) | 144/1388 (10) |
Abbreviations: ICU, intensive care unit; IQR, interquartile range; LOS, length of stay.
a Other category includes Asian/Pacific Islander, American Indian or Alaska Native, or multiracial, non-Hispanic.
f By any culture type.
g Test type not known.
bPrematurity defined as neonates born at <37 weeks of gestation.
cOther conditions include drug exposure, congenital malformations, small for gestational age, all remaining conditions <10 observations.
dTachypnea definition: if 0–5 months and relative risk >55; if 6–11 months and relative risk >50; if 12–23 months and relative risk >46.
eHypoxemia definition: minimum oxygen saturation <90%.
Eighty-nine percent of cases were tested for other viruses. Among those tested, 10% (144/1388) had other viruses detected simultaneously with RSV. The most frequent viral codetections were with rhinovirus/enterovirus (48%), followed by influenza A (24%), coronavirus (15%), adenovirus (10%), and influenza B (8%; Supplementary Table 2). Forty-five percent of cases were tested for bacterial pathogens by any culture type; 43 (6%) had a positive blood culture. The most frequently identified bacterial pathogens from any culture type were Haemophilus influenzae (23%) and Streptococcus pneumoniae (12%; Supplementary Table 3).
Table 2 shows the frequency of severe outcomes during RSV-associated hospitalization, stratified by age groups. Overall, children aged 0–2 months represented the largest proportion of ICU admissions (35%; 95% CI, 23% to 48%) and mechanical ventilation (11%; 95% CI, 6% to 15%). Age-associated risk for severity was only statistically significant for mechanical ventilation; children aged 0–2 months were 3.5 times more likely to require mechanical ventilation compared with the older age groups (data not shown). We also stratified outcomes by the presence or absence of underlying medical conditions (healthy, at least 1 underlying condition, premature); these data are presented in Supplementary Tables 4–6.
Frequency of Children Aged <2 Years With Severe Respiratory Syncytial Virus–Associated Outcomes During Hospitalization, Influenza Hospitalization Surveillance Network, October 2014–April 2015
| Age Group, months | Intensive Care Unit Admission, if Hospitalized | Mechanical Ventilation, if Hospitalized | Death, if Hospitalized | |||
|---|---|---|---|---|---|---|
| % (95% CIa) | n/n | % (95% CIa) | n/n | % (95% CIa) | n/n | |
| 0–2 | 35 (23–48) | (217/614) | 11 (6–15) | (65/614) | 0.3 (0–0) | (2/614) |
| 3–5 | 25 (11–41) | (65/262) | 3 (0–6) | (8/262) | 0.4 (0–0) | (1/262) |
| 6–11 | 18 (5–30) | (53/300) | 3 (0–5) | (9/300) | 0.7 (0–2) | (2/300) |
| 12–23 | 21 (10–30) | (81/378) | 3 (0–5) | (11/378) | …- | (0/378) |
Abbreviation: CI, confidence interval.
aThe95% confidence intervals were adjusted by site.
Case Ascertainment Adjustment
The percentage of children hospitalized with ARI who were tested for RSV varied across sites and by age group (Figure 1). The percentage of children tested was highest in the 0–2 month age group (84%; range, 76%–93%) and lowest in the 12–23 month age group (71%; range, 64%–78%). Figure 2 shows the distribution of RSV test types used by site and age group among the ARI cases. RSV test types varied by site. Whereas Georgia exclusively reported using molecular diagnostic testing (100%), the other sites reported use of rapid antigen tests in a range of 5% to 51% and other tests including culture and fluorescent antibody in a range of 1% to 26%. We estimated a combined test sensitivity of approximately 95% per age group (Supplementary Table 7). Estimated multipliers for correction of RSV case ascertainment by age group were 1.2, 1.3, 1.4, and 1.5 for children aged 0–2, 3–5, 6–11, 12–23 months, respectively. The estimated multipliers were lower among those aged 0–2 months (1.2; 95% CI, 1.2 to 1.3) and higher among those aged 12–23 months (1.5; 95% CI, 1.3 to 1.6; Supplementary Table 8).
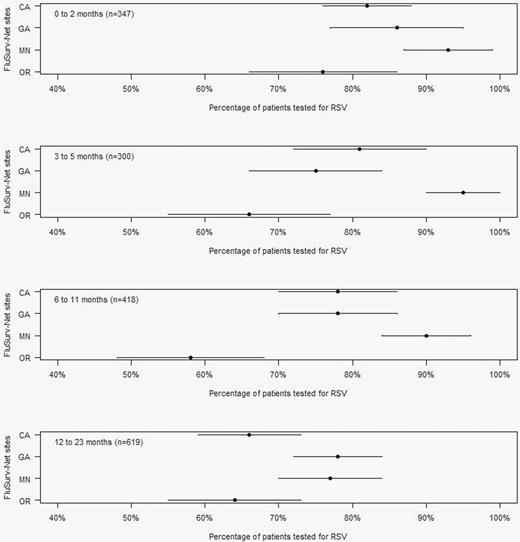
Proportion of patients tested for RSV by age group and study site, Influenza Hospitalization Surveillance Network, December 2014–April 2015. Abbreviation: RSV, respiratory syncytial virus.
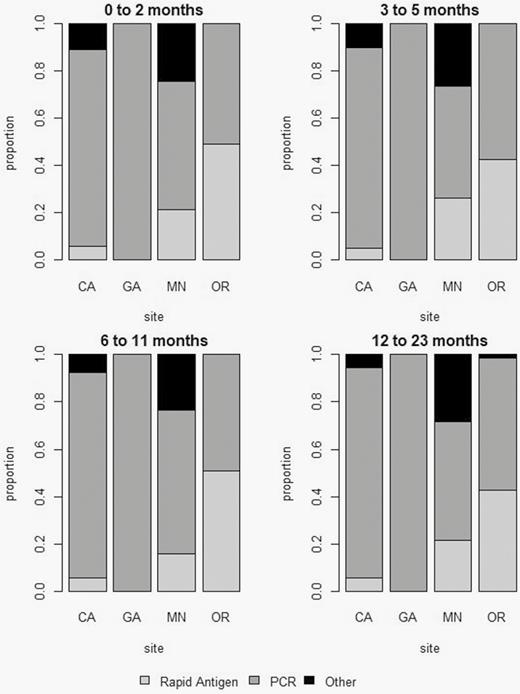
Distribution of respiratory syncytial virus (RSV) test type use by site and age group in children aged <2 years hospitalized with RSV, Influenza Hospitalization Surveillance Network, December 2014–April 2015. *Other: Viral culture, other unknown. Abbreviations: CA, California; GA, Georgia; MN, Minnesota; OR, Oregon; PCR, polymerase chain reaction.
Estimating RSV Disease Burden
The age-specific adjusted community-onset RSV hospitalization rates per 100 000 population for the 2014–2015 season were 1970 (95% CI, 1787 to 2177), 897 (95% CI, 761 to 1073), 531 (95% CI, 459 to 624), and 358 (95% CI, 317 to 405) for children aged 0–2, 3–5, 6–11, and 12–23 months, respectively (Table 3). Extrapolating to the US population, an estimated 49 509–59 867 community-onset RSV-associated hospitalizations may have occurred in children aged <2 years during the 2014–2015 season.
Estimates of Respiratory Syncytial Virus Disease Burden in Rates per 100 000 Children and Total Counts per Age Group, Influenza Hospitalization Surveillance Network, October 2014–April 2015
| Hospitalizations | Age Group, months | Rate (95% CIa) | Number (95% CIa) |
|---|---|---|---|
| 0–2 | 1970 (1787−2177) | 25 940 (23 527−28 667) | |
| 3–5 | 897 (761−1073) | 11 803 (10 016−14 128) | |
| 6–11 | 531 (459−624) | 6988 (6039−8210) | |
| 12–23 | 358 (317−405) | 14 132 (12 517−15 988) | |
| <24 | 687 (627−758) | 54 237 (49 509−59 867) |
Counts are extrapolation of rates to US population.
Abbreviation: CI, confidence interval.
aThe 95% confidence intervals were adjusted by bootstrapping the number of hospitalizations and the detection multiplier, accounting for variability of testing and test sensitivities by site.
Discussion
Using a different approach to estimate rates for community-onset RSV-associated hospitalizations during the 2014–2015 season in the United States, we demonstrated the high burden of RSV among children aged <2 years. Estimated RSV-associated hospitalization rates for the 2014–2015 season were particularly high among children aged 0–2 months, with an incidence of 1970 RSV-associated hospitalizations per 100 000. To better understand the impact of these rates, we extrapolated our data to the US population and estimated 49 509–59 867 RSV-associated hospitalizations may have occurred in children aged <2 years during the 2014–2015 season, underscoring the importance of prioritizing public health interventions for young children at high risk of severe RSV disease.
Our overall hospitalization rates for children aged <2 years (678 per 100 000 children) were consistent with those reported in 2013 by the CDC-supported New Vaccine Surveillance Network (NVSN), a prospective, active, population-based surveillance network for children hospitalized with ARI that had been implemented in 3 hospitals by 2005, each in a different state, and had a surveillance population of 132 085 children aged <2 years [1, 22]. Hall et al [1] estimated an annual average of 520 RSV-associated hospitalizations per 100 000 children aged <2 years between 2000 and 2005. Moreover, Iwane et al [22] reported 1850 and 740 RSV-associated hospitalizations per 100 000 children aged 0–5 months and 6–11 months, respectively, for 1 season. Similar to FluSurv-NET, RSV was identified by molecular assays; however, NVSN systematically tests those who meet the ARI case definition, whereas FluSurv-NET collects data on patients with an RSV-confirmed diagnosis who were tested at the discretion of clinicians, hence, the need for case ascertainment adjustments. Other studies that used different estimation methods presented similar findings [8, 9, 23–26]. Nonetheless, compared with our study, Homaira et al [25], in New South Wales, Australia, used administrative datasets that followed 870 314 children aged <5 years from 2001 to 2010 and reported higher annual incidence rates for RSV hospitalizations among healthy children aged 0–3, 4–6, 7–11, and 12–24 months to be 2560, 1670, 470, and 280 per 100 000, respectively [25]. Similarly, a prospective severe respiratory illness surveillance study in 3 hospitals in 2 South African provinces reported an incidence of RSV-associated hospitalizations of 6593, 3411, 1494, and 409 per 100 000 for children aged 0–2, 3–5, 6–11, and 12–23 months, respectively [27]. Hospitalization rates from these 2 studies were higher compared with our estimate. In Australia they did not have laboratory-confirmed cases and relied on administrative codes for acute lower respiratory tract infections and RSV, which could partly explain the higher rates. There could also be differences due to the underlying characteristics of the study populations, including a high prevalence of human immunodeficiency virus in South Africa [28]. Notably, for all of these approaches and in all settings, the highest rates were in the youngest age group, which is an important consideration for targeting interventions.
Estimates of RSV-associated hospitalization rates for children aged <12 months are higher than estimates of influenza-associated hospitalization rates for children aged <12 months using the same methodology. Rates of hospitalization per 100 000 children for RSV and influenza were 1970 vs 328 for children 0–2 months, 897 vs 117 for 3–5 months, and 531 vs 101 for 6–11 months [29]. A limitation to this comparison is that the above-mentioned influenza data are from 2003 to 2012, whereas the RSV data are from the 2014–15 season. Despite this limitation, a number of other studies have found RSV to have a higher incidence among children aged <5 years compared with influenza [4, 8, 24, 26, 29, 30]. Our findings reaffirm that among young children in the United States, RSV represents a major cause of respiratory disease–associated hospitalizations.
The RSV clinical course described in our study follows trends that are similar to those presented in other studies, but site-specific variation in severity was observed [3, 31–35]. Severity indicators such as respiratory distress (59% in Georgia to 85% in Oregon) and wheezing (19% in Georgia to 44% in Oregon) varied by site, which could indicate different criteria for admission or different underlying characteristics of the populations at each study site. We observed that ICU admission varied substantially among our 4 study sites (from 13% to 45%), which could be explained by different thresholds for admission and different testing practices among participating FluSurv-NET hospitals [36]. Overall, 90% of the ICU-admitted children were tested for RSV compared with 75% among those not admitted to the ICU. Testing rates among ICU-admitted children and non–ICU-admitted children were similar among the very young age group, but differences up to approximately 20% can be seen among older age groups (Supplementary Table 9). When we looked at variation of testing by site and ICU admission, Georgia and Oregon were 40% more likely to test children in the ICU than those not in the ICU. Other factors, including gestational age at delivery, age at hospital admission, and type of insurance, may also influence ICU admission practices [33]. Most importantly, Georgia had the highest rate of ICU admissions and children requiring mechanical ventilation (9% compared with a low of 2% in California), and 4 of the 5 identified deaths occurred in Georgia. Overall, the proportion of ICU admissions in our study was higher than described in the US study by Rodriguez-Fernandez et al (10% vs 27% reported in our study), which was based on 2 pediatric hospitals [34], but with a substantially smaller sample size (253 children aged <2 years compared with our sample of more than 1500 children) that may explain the variation. Similar to other studies [3, 32], mechanical ventilation was used in <10% of the cases. Furthermore, 67% of all hospitalized cases had no clear risk factor for severe disease, consistent with a previous report [35] and highlighting the importance of developing new interventions that can be broadly applied to infants.
This study highlights the opportunity to adapt an existing platform for influenza hospitalization surveillance in order to monitor RSV in the United States. In 2014–2015, the RSV and influenza seasons largely overlapped (the RSV season nationally ranged from 11 October 2014 to 9 May 2015, peaking on 7 February 2015) [5]. However, this is not the case every year and would need to be taken into account to avoid substantial underestimation of RSV-associated burden. We applied a previously described method to adjust for inherent factors of the surveillance system such as under-ascertainment of cases due to variability in testing practices and diagnostic test sensitivity [12, 15, 16]. Although RSV testing overall was high among children aged <2 years with respiratory symptoms, we observed a substantial decrease in testing among children aged ≥6 months, necessitating the adjustment.
The study included several limitations. First, due to limited funding, the study was limited to 4 of the 13 states that currently participating in FluSurv-NET [13]. Nonetheless, the 4 sites together provided a diverse population, and their catchment population reflected 4% of the US population aged <2 years. However, results may not be generalizable to the entire US population. Including additional hospitals in the future would allow for more robust assessments, lessening the impact of variability in clinical practices among healthcare settings. Second, surveillance was limited to 1 season. Several years of surveillance are needed for robust burden estimates because there can be variations in RSV circulation and severity from year to year [11]. Third, we only obtained data on RSV testing practices from December 2014 to April 2015 and did not include October 2014 and November 2014. While this may have underestimated our rate calculation, the observed variability for the underdetection multipliers by month is small, particularly among children aged 0–2 months (Supplementary Table 8). Fourth, we used 90% sensitivity for viral culture based on a previous reference [19]. Weinberg et al [37] found low sensitivity for RSV diagnosis by culture (36%) when compared with real-time polymerase chain reaction (RT-PCR) [37]. However, for the analytic part of this study, culture represented only approximately 6% of those tested. Finally, we based the correction of case ascertainment on ICD-9 codes that were preselected based on the most common codes identified through surveillance among RSV cases from other studies [1]. As such, we may have inadvertently missed RSV cases who did not meet the preselected criteria, which could have led to a slight underestimation of hospitalization rates. On the other hand, since several of the preselected ICD-9 codes are not specific for RSV, we may have included hospitalizations associated with other respiratory viruses that cocirculated during this time [38]. Despite these limitations, our estimates of RSV-associated hospitalization rates were similar to those previously reported in systematic surveillance following the ARI case definition (sudden symptom onset with fever and/or respiratory symptoms and other related conditions including apnea and rule-out sepsis) [22, 39], validating the capability of FluSurv-NET to provide estimates of RSV-associated hospitalization rates.
Our findings emphasize the importance of RSV as a cause of hospitalization in young children, especially those aged 0–2 months, regardless of their gestational age at birth. This laboratory-based approach that adjusts for testing practices and diagnostic testing sensitivity may produce robust estimates of RSV disease burden to inform prevention strategies and, when used over the years (as it is the case for influenza), could allow for the assessment of the impact of public health interventions. Future studies using this approach could consider a correction factor for differential testing based on severity, as we reported above to be the case for ICU-admitted children in some sites, and should consider expanding surveillance to best capture RSV seasons that do not overlap with circulation of influenza viruses.
Notes
Acknowledgments. We thank all of those involved in respiratory syncytial virus hospitalization surveillance at each of the Influenza Hospitalization Surveillance Network sites, including Stepy Thomas, Suzanne Segler, Emily Fawcett, and Shelton Bartley from the Georgia Emerging Infections Program and Charisse Nitura from the Centers for Disease Control and Prevention (CDC).
Disclaimer. The findings and conclusions in this report are those of the authors and do not necessarily represent the official position of the CDC.
Potential conflicts of interest. E. J. A. has received research funding unrelated to this article from Novavax, Pfizer, GSK, Merck, Sanofi-Pasteur, Regeneron, Micron, and Medimmune and has also consulted for AbbVie and Pfizer unrelated to this article. All remaining authors: No reported conflicts of interest. All authors have submitted the ICMJE Form for Disclosure of Potential Conflicts of Interest. Conflicts that the editors consider relevant to the content of the manuscript have been disclosed
References
Stockman LJ, Curns AT, Anderson LJ, Fischer-Langley G .
Jain S, Williams DJ, Arnold SR, et al .
Rose EB, Wheatley A, Langley G, Gerber S, Haynes A .
Goldstein E, Nguyen HH, Liu P, et al.
Matias G, Taylor R, Haguinet F, Schuck-Paim C, Lustig R, Shinde V.
Zhou H, Thompson WW, Viboud CG, et al.
DeVincenzo JP, Ambrose CS, Makari D, Weiner LB .
McMorrow ML, Tempia S, Walaza S, et al.
