


Abstract
Neonates are at increased risk for developing sepsis, but this population often exhibits ambiguous clinical signs that complicate the diagnosis of infection. No biomarker has yet shown enough diagnostic accuracy to rule out sepsis at the time of clinical suspicion.
We show that a gene-expression–based signature is an accurate objective measure of the risk of sepsis in a neonate or preterm infant, and it substantially improves diagnostic accuracy over that of commonly used laboratory-based testing. Implementation might decrease inappropriate antibiotic use.
Neonatal sepsis can have devastating consequences, but accurate diagnosis is difficult. As a result, up to 200 neonates with suspected sepsis are treated with empiric antibiotics for every 1 case of microbiologically confirmed sepsis. These unnecessary antibiotics enhance bacterial antibiotic resistance, increase economic costs, and alter gut microbiota composition. We recently reported an 11-gene diagnostic test for sepsis (Sepsis MetaScore) based on host whole-blood gene expression in children and adults, but this test has not been evaluated in neonates.
We identified existing gene expression microarray-based cohorts of neonates with sepsis. We then tested the accuracy of the Sepsis MetaScore both alone and in combination with standard diagnostic laboratory tests in diagnosing sepsis.
We found 3 cohorts with a total of 213 samples from control neonates and neonates with sepsis. The Sepsis MetaScore had an area under the receiver operating characteristic curve of 0.92–0.93 in all 3 cohorts. We also found that, as a diagnostic test for sepsis, it outperformed standard laboratory measurements alone and, when used in combination with another test(s), resulted in a significant net reclassification index (0.3–0.69) in 5 of 6 comparisons. The mean point estimates for sensitivity and specificity were 95% and 60%, respectively, which, if confirmed prospectively and applied in a high-risk cohort, could reduce inappropriate antibiotic usage substantially.
The Sepsis MetaScore had excellent diagnostic accuracy across 3 separate cohorts of neonates from 3 different countries. Further prospective targeted study will be needed before clinical application.
Accurate diagnosis of sepsis in newborn and preterm infants is difficult. Subtle ambiguous clinical signs that overlap with developmental immaturity or transitional physiology can reduce the accuracy and utility of both consensus definitions for neonatal sepsis [1, 2] and traditional clinical and laboratory criteria [3–7]. This difficulty, combined with poor outcomes in septic neonates with delayed treatment [8], frequently prompts neonatologists to treat presumptively and then rule out sepsis in any neonate in whom it is suspected. Thus, suspected sepsis is the most common diagnosis among neonates, and its treatments (antimicrobial agents) are the most commonly used medications in the neonatal intensive care unit [9]. This practice results in early-life broad-spectrum antimicrobial exposure for a substantial percentage of hospitalized newborns and preterm infants worldwide, the great majority of whom have ambiguous clinical signs but do not have a bacterial infection [10–13]. This liberal antimicrobial use is associated with increased numbers of drug-resistant organisms and with adverse outcomes in preterm infants, including an increased risk of subsequent sepsis during the birth hospitalization and necrotizing enterocolitis [14–18]. Emerging evidence also suggests that early antibiotic-induced disruption of the developing microbiome can have detrimental developmental consequences [19]. Altogether, these data underscore the critical need for accurate diagnostic testing for sepsis in neonates to help guide the clinician’s decision to initiate antibiotics at the time of suspicion for sepsis.
We recently described an 11-gene diagnostic score called the Sepsis MetaScore (SMS) based on the host transcriptomic response to infection that can discriminate children and adults with sepsis from those with noninfectious inflammation (and from healthy controls) [20]. The biological mechanisms of the 11 SMS genes are described in the original publication; they are known to be linked to both immature neutrophils and a downregulation of adaptive immunity [20]. We have since validated the diagnostic accuracy of the SMS in several transcriptomic cohorts of adults and children and by using targeted assays such as the NanoString nCounter [21, 22]. However, because the host response in neonates might be affected by the timing of sepsis (early and late after birth) [23], unique pathogens in this age group [24, 25], and by developmental age (preterm neonates, term neonates, infants, etc) [26], the accuracy of the SMS must be verified in this unique population.
The SMS is calculated by measuring the relative quantities of its 11 constituent messenger RNAs; as a result, it can be calculated easily from existing genome-wide expression data. Such studies can be used to validate the diagnostic accuracy of the SMS across different cohorts. In this study, we gathered all known transcriptomic cohorts from neonates with sepsis to evaluate whether the SMS is useful as a diagnostic tool in this distinct clinical population.
METHODS
We designed this study as a secondary data analysis of cohorts from previously published studies. We searched for genome-wide expression studies of neonatal sepsis in PubMed, NCBI GEO, and EBI ArrayExpress. We included data sets only from studies of both neonates with sepsis and a reference/control class. For each study, we contacted the authors to gather laboratory data, including white blood cell (WBC) count, absolute neutrophil count (ANC), and C-reactive protein (CRP) level. CRP levels from the Smith et al [27, 28] cohort were not available.
Sepsis Definitions
In each cohort, sepsis was defined the same as it was by the initial authors. In the Cernada et al [29] study (ArrayExpress accession number E-MTAB-4785), sepsis was diagnosed when a microorganism was isolated from blood and clinical signs and risk factors were concomitantly present. At least 3 of the following clinical signs were required: temperature instability (rectal temperature of ≥38°C or ≤36°C); respiratory symptoms (distress, apnea, or cyanosis); cardiovascular symptoms, including hypotension (blood pressure at <5th percentile for age), tachycardia (heart rate of >180 beats/minute), bradycardia (heart rate of <100 beats/minute), or poor perfusion; neurological symptoms (clinical or electrical seizures, hypotonia, or lethargy); or gastrointestinal symptoms (vomiting, poor feeding or feeding intolerance, or abdominal distension). Two positive blood culture results were required for the diagnosis of coagulase-negative staphylococcal sepsis (CoNS).
In the Smith et al [27, 29] study (NCBI accession number GSE25504), samples taken from a usually sterile body site from patients with suspected clinical infection that proved to have microbiological evidence of infection were identified and formed the infected group. Full clinical assessment for early and late symptoms and signs of sepsis followed presentation criteria for neonatal sepsis (included respiratory, cardiovascular, and/or metabolic symptoms, temperature instability, feeding intolerance, lethargy/low tone, jaundice, and/or ill appearance/poor color), and the blood culture was used as the gold standard for diagnosis of sepsis. For CoNS-positive patient samples, full clinical assessment was conducted independently by 2 clinicians, and clinical evidence that supported or refuted inclusion was reviewed. The neonatal unit uses the definitions of the Vermont Oxford Network for infection surveillance, and associated clinical deterioration, repeat CoNS isolates, and deranged blood counts were also examined. CoNS samples were only included as positive if both clinicians agreed that infection was present. Patients with “possible” infection were those who were evaluated for sepsis but for whom positive microbiological results were not found; these patients were grouped by the original authors as having a low, medium, or high probability of sepsis on the basis of clinical suspicion [28]. The patients in this cohort with possible infection were not considered as either a case or control in the construction of receiver operating characteristic (ROC) curves because of the diagnostic uncertainty and lack of confirmatory laboratory data.
In the Wynn et al [23] study (NCBI accession number GSE69686), infants evaluated for sepsis had blood collected prospectively and were classified retrospectively as having sepsis on the basis of the presence of all 3 of the following criteria: (1) persistently abnormal clinical examination results (≥2 days of clinical signs [ill appearance, respiratory and cardiovascular signs]), (2) positive blood culture results, and (3) a peak CRP level of >45 mg/L within 48 hours of evaluation. Infants with negative culture results who met the other 2 criteria were classified as “clinical sepsis” (because of their persistently abnormal clinical examination results and very high CRP values) and so were included in the transcriptomic analysis (in contrast to the possible-sepsis samples in the Smith et al [27] study). Because there is diagnostic uncertainty without microbiological confirmation (even in the face of persistently abnormal clinical examination findings and elevated CRP levels [>45 mg/L]), we examined the clinical-sepsis and culture-positive-sepsis cases separately (with clear designations when considered separately). The control groups consisted of neonates suspected of having sepsis but without the persistently abnormal examination and CRP findings listed above; some neonates were exposed to chorioamnionitis [30].
Microarray Normalization
For each cohort, microarrays were renormalized from raw data using the RMA normalization method [31] (if they were Affymetrix microarrays) or normal-exponential background correction followed by quantile normalization. Probes were summarized to genes within data sets using a fixed-effects model [32]. Data were log2 transformed before analysis [33].
For the Smith et al cohort, samples were split across 4 array types. To analyze this as a single pooled cohort, we used COmbat CO-Normalization Using conTrols (COCONUT) conormalization [22]. For the Smith et al [27] cohort after COCONUT conormalization and for the Wynn et al [23] cohort, technical replicates were summarized as the mean gene expression level.
Diagnostic Calculations
The 11-gene SMS is calculated according to the formula below, in which each gene represents its relative expression value in a given sample [20]. If a gene is not measured in a given microarray cohort, its value is replaced with 1 in the formula.
For each cohort, we examined the diagnostic accuracy of standard laboratory values (total WBC count, ANC, and CRP level) and the SMS, both separately and in combination. In addition, we examined the laboratory values both in raw form and dichotomized at standard cutoff values for sepsis diagnosis to estimate a standardized analysis (WBC count of <3000 or >15 000, ANC of <1500 or >12 000, or CRP level of >10) [5, 6]. We assessed diagnostic power primarily by using ROC curves. Given the devastating consequences of a missed infection, we set the point estimates for sensitivity and specificity at the sensitivity nearest 95% to maximize the negative predictive value. Laboratory values were not available for all patients; thus, ROC curves for the SMS alone describe the entire cohort, whereas those for laboratory tests and laboratory tests + SMS describe subgroups for which laboratory values were available.
We used logistic regression models to integrate standard laboratory values and the SMS with presence of sepsis as the predicted variable without interaction terms. Then, we constructed ROC curves from predicted probabilities within each given cohort. We calculated net reclassification (with or without SMS) from these regression models using the R package PredictABEL [34].
All analyses were conducted in R 3.1.1. P values were 2 tailed. Data from Cernada et al [29] are newly available under ArrayExpress accession number E-MTAB-4785. The COCONUT-normalized samples from the Smith et al [27] study are posted on our website (see http://khatrilab.stanford.edu/sepsis).
RESULTS
Description of the Cohorts
Our search identified 3 cohorts of neonates with sepsis who were profiled for genome-wide expression (total of 214 unique patients) (Table 1) [23, 27, 29]. Each of the 3 studies examined different clinical cohorts in different countries. Cernada et al [29] (ArrayExpress accession number E-MTAB-4785) specifically enrolled very-low-birth-weight (VLBW) (<1500 g) neonates at a mean of 27 to 28 weeks' gestational age; enrollment of the control and septic neonates occurred at a mean 11 and 14 days of age, respectively (range, 2–26 days). Control neonates were not suspected of being septic and were matched 1:1 with septic neonates (2 extra controls were also included in the original study, and they were included here). Smith et al [27] (NCBI accession number GSE25504) enrolled neonates suspected of having sepsis, and control samples were taken mostly from screening blood collections from healthy term neonates. Septic neonates were mostly of VLBW (mean, 1100–1200 g [range, 430–3380 g]); their mean gestational age was 28 to 29 weeks, and their samples were obtained approximately 2 to 4 weeks after birth. Wynn et al [23] (NCBI accession number GSE69686) enrolled infants who were evaluated and treated empirically for sepsis and retrospectively categorized as uninfected, uninfected but histologically chorioamnionitis exposed [30], or septic (either microbiologically confirmed or clinical). The samples were subdivided further according to the timing of the sepsis evaluation in days since birth (<3 days [early] vs ≥3 days [late]). The sepsis samples were categorized as showing clinical sepsis, on the basis of the persistence of both systemic inflammation (elevated CRP level, peak greater than 45 mg/L) and clinical signs of inflammation, or confirmed sepsis, on the basis of a positive culture result in addition to the criteria for clinical sepsis. Uninfected control neonates and septic neonates had similar birth weights (mean, 930–2090 g [range, 500–3480 g]) and gestational ages (mean, 26–33 weeks [range, 23–41 weeks]).
Cohorts Examining Genome-Wide Expression in Whole Blood From Neonates With Sepsis
| Year | Study | Accession No. | Country | Controls | Condition | Platform(s) | No. of Controls | No. With Sepsis |
|---|---|---|---|---|---|---|---|---|
| 2014 | Cernada et al [29] | E-MTAB-4785 (ArrayExpress) | Spain | Matched VLBW neonates without signs of infection | Confirmed sepsis (VLBW neonates) | GPL6244 | 19 | 17 |
| 2014 | Smith et al [27]a | GSE25504 (NCBI) | United Kingdom | Neonates without signs of infection | Confirmed sepsis (neonates) | GPL570, GPL6947, GPL13667, GPL15158 | 45 | 49 |
| 2015 | Wynn et al [23] | GSE69686 (NCBI) | United States | Neonates ruled out for sepsis | Clinical or confirmed sepsis (neonates) | GPL20292 | 46 | 37 |
Abbreviation: VLBW, very low birth weight.
aSmith et al also included a group of neonates with what they considered possible sepsis (not listed).
Diagnostic Accuracy of the SMS
We first tested the SMS for diagnostic accuracy in distinguishing septic neonates from controls in each of the 3 cohorts according to the sepsis definitions defined in Methods. The SMS had a consistently high diagnostic accuracy in each cohort (area under the receiver operating characteristic curve [AUC] [95% confidence interval (CI)], 0.93 [0.89–0.98] [Cernada et al], 0.92 [0.89–0.94] [Smith et al], and 0.92 [0.89–0.95] [Wynn et al]) (Figure 1). Violin plots are shown in Supplementary Figure 1. The range of AUCs was small (0.92–0.93) despite significantly different control groups in the 3 cohorts; the Wynn et al controls were suspected of having sepsis but ruled out, whereas the controls in the other 2 cohorts were not suspected of having infection. It should be noted that no significant change in diagnostic accuracy was found in the Wynn et al cohort when considering only confirmed sepsis (ie, not including clinical sepsis) versus uninfected infants or when split into early and late time points (Supplementary Figure 2). In addition, in the Smith et al cohort, when the possibly septic neonates (not included in the Figure 1 ROC curves) were compared with those with confirmed bacteremia, the SMS had excellent discriminatory accuracy (AUC, 0.90). Given the very low pretest probability for actual infection in possible cases of sepsis, this discriminatory ability suggests real clinical utility of the SMS.
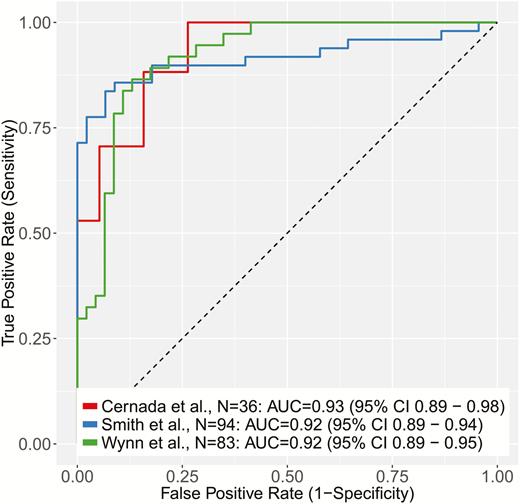
Receiver operating characteristic (ROC) curves of the Sepsis MetaScore comparing noninfected controls with neonates with sepsis (as defined by the original authors of each cohort). Abbreviations: AUC, area under the receiver operating characteristic curve; CI, confidence interval.
Point Estimates of Predictive Value
To assess the clinical impact of the diagnostic performance of the SMS, we took point estimates for each ROC curve of the SMS alone at the highest specificity near a 95% sensitivity. The mean sensitivity and specificity were 94.9% and 60.3%, respectively (Table 2). We also computed point estimates using the Youden method [35] to jointly maximize sensitivity and specificity, and we found 90.0% sensitivity with 84.7% specificity (Table 2). Because the 3 studies all had slightly different enrollment, criteria, and comparison groups, these mean test characteristics are only estimates of the real-world diagnostic accuracy of the SMS, but they offer the benefit of integrating several different clinical scenarios. Using these mean estimates for sensitivity and specificity at 2 different potential thresholds, the SMS would have a negative likelihood ratio of 0.085 to 0.117. We next calculated test characteristics at both point estimates assuming that the test was run in a cohort of neonates who had screened as high risk using a neonatal sepsis clinical risk predictor [4, 36]. Assuming that the test was applied to 10 000 high-risk term neonates with a 1 in 118 prevalence of sepsis (as estimated by Escobar et al [4] for their clinical risk predictor), 84 cases of sepsis would be found. A test that performed with the mean characteristics of the SMS would correctly diagnose 76 to 80 of 84 septic infants while avoiding 5979 to 8398 unnecessary courses of antibiotics (Tables 3 and 4). If, instead, the test were applied to a group of VLBW or preterm neonates with a blood-culture–proven sepsis prevalence of 8.9% [11], the SMS would identify 802 to 845 of 890 septic infants while avoiding 5493 to 7716 unnecessary courses of antibiotics (Supplementary Table 1). Of course, these estimates assume a single “bright-line” cutoff for the SMS; a more real-world application of the SMS might be the eventual calibration of probabilities of sepsis.
Point Estimates of Sensitivity and Specificity of the SMS in the Three Tested Cohorts
| Study (no. in cohort) | Set at Sensitivity of 95% | Set at Youden Optima | ||
|---|---|---|---|---|
| Sensitivity | Specificity | Sensitivity | Specificity | |
| Smith et al [27] (94) | 0.959 | 0.356 | 0.837 | 0.933 |
| Wynn et al [23] (84) | 0.946 | 0.717 | 0.865 | 0.870 |
| Cernada et al [29] (36) | 0.941 | 0.737 | 1 | 0.737 |
| Overall mean | 0.949 | 0.603 | 0.901 | 0.847 |
Two methods for choosing an optimal point were used, a minimum sensitivity (95%) and the Youden joint maximization.
Evaluation of Test Characteristics at the Mean Outcome for a Sensitivity Near 95%
| Test Result | True Positive | True Negative | Total |
|---|---|---|---|
| Positive | 80.5 | 3936.3 | 4016.8 |
| Negative | 4.3 | 5978.9 | 5983.2 |
| Total | 84.8 | 9915.2 | 10 000.0 |
| Test Result | True Positive | True Negative | Total |
|---|---|---|---|
| Positive | 80.5 | 3936.3 | 4016.8 |
| Negative | 4.3 | 5978.9 | 5983.2 |
| Total | 84.8 | 9915.2 | 10 000.0 |
Test estimates for the mean performance at both points were calculated using the assumption of prevalencein a high-risk screening cohort (Escobar et al [4]) of 1 in 118 (0.85%). Shown are hypothetical test characteristics in 10 000 tested neonates. Sensitivity = 94.9%, specificity = 60.3%, negative likelihood ratio = 0.085, positive likelihood ratio = 2.39, prevalence = 0.848%, negative predictive value = 99.93%, and positive predictive value = 2.0%.
Evaluation of Test Characteristics at the Mean Outcome at the Youden Optima
| Test Result | True Positive | True Negative | Total |
|---|---|---|---|
| Positive | 76.4 | 1517.0 | 1593.4 |
| Negative | 8.4 | 8398.2 | 8406.6 |
| Total | 84.8 | 9915.2 | 10 000.0 |
| Test Result | True Positive | True Negative | Total |
|---|---|---|---|
| Positive | 76.4 | 1517.0 | 1593.4 |
| Negative | 8.4 | 8398.2 | 8406.6 |
| Total | 84.8 | 9915.2 | 10 000.0 |
Test estimates for the mean performance at both points were calculated using the assumption of prevalence in a high-risk screening cohort (Escobar et al [4]) of 1 in 118 (0.85%). The likelihood ratio, negative predictive value, and positive predictive value were calculated in the standard manner from the given sensitivity and specificity. Sensitivity = 90.1%, specificity = 84.7%, negative likelihood ratio = 0.12, positive likelihood ratio = 5.89, prevalence = 0.848%, negative predictive value = 99.90%, and positive predictive value = 4.8%.
Comparison of the SMS to the Diagnostic Accuracy of Laboratory Tests
For each cohort, we tested the diagnostic accuracy of standard clinical laboratory test results (WBC count, ANC, CRP level) both in raw form and at standard cutoff values [5, 6]. Because laboratory values were not available for all patients, we used subsets of the overall cohorts. For Wynn et al [23], we tested results individually for each subgroup (early vs late and clinical vs confirmed sepsis). CRP levels had a much greater diagnostic value (both raw and dichotomized) then either the WBC count or ANC, as was expected (Supplementary Figures 3–5).
We next compared the diagnostic accuracy of all 3 laboratory tests either alone or in combination with SMS (in the subset of patients with both laboratory values and transcriptomic data available). We combined data using a logistic regression model and constructed ROC curves from the resulting predicted class probabilities (Figure 2). In all cases, there was an increase in the ROC AUC when laboratory test results and SMS were combined. In addition, as a more clinically relevant measure of the usefulness, we calculated the net reclassification index (NRI) from laboratory results alone and laboratory results + SMS for each cohort. For the NRI, it is necessary to select discrete probability ranges for diagnosis; we assumed ranges of 0% to 1% (very low suspicion, safe to not treat), 1% to 15% (medium suspicion, requires further evaluation), and >15% (high suspicion, treatment recommended). The SMS showed significant NRI values (range, 0.3–0.69; P < .05) for all cases except the Smith et al binary laboratory results comparison (NRI, 0.13; P = .11) (Supplementary Tables 2–4). Most improvement from the SMS came from reclassifying patients as being in a lower-risk category (ruling out sepsis), likely because clinical laboratory tests for sepsis are designed to have very high sensitivity at the expense of specificity.
![Receiver operating characteristic (ROC) curves for logistic models of the Sepsis MetaScore (SMS) alone (replotted to account for patients with missing laboratory data), plus clinical laboratory results in binary or raw form, with or without the SMS, for each cohort: (A) Cernada et al [29] (n = 36); (B) Smith et al [27] (n = 68) (no CRP data were available for this cohort); and (C) Wynn et al [23] (n = 83) (all 4 subgroups are combined because no substantial differences were found in subgroup analysis for individual laboratory results; thus, the same controls were counted twice in their respective comparison groups). Abbreviations: AUC, area under the receiver operating characteristic curve; CI, confidence interval; CRP, C-reactive protein.](https://oup.silverchair-cdn.com/oup/backfile/Content_public/Journal/jpids/7/2/10.1093_jpids_pix021/1/m_pix02102.jpeg?Expires=1716320141&Signature=1Weo4qRrOa1kksUMpJNm2c8CM-W8vKm9cX8mjbhOIazWSOQfXZR3rGVO2qjPpSOQ8oHotcOZqMQYM6Kf2awJOnpnGYN6YpzNbXNXiTLO~LEGsQwjtBVB5-Z-8154fvK4gpS-69El~T7~wrx3QDj2-2kVLA2DOhdLtvwjazpa5UFgdNNmmcynJfyeeHtnLP4LlkmQFgatVCOdFeW4fv~PyEanzwxIxDl~rOcUfVOLgbPHRJEzwKcGsuIktGGvpyEnsUAracdN-Kqm8gpD3Yt9XL0RXWQdHxBcoKzj6UhpbzRTyM9hrrC9z9kz1rVSqVT8CpjZ9w2~mYbwwe4C~Pb3mA__&Key-Pair-Id=APKAIE5G5CRDK6RD3PGA)
Receiver operating characteristic (ROC) curves for logistic models of the Sepsis MetaScore (SMS) alone (replotted to account for patients with missing laboratory data), plus clinical laboratory results in binary or raw form, with or without the SMS, for each cohort: (A) Cernada et al [29] (n = 36); (B) Smith et al [27] (n = 68) (no CRP data were available for this cohort); and (C) Wynn et al [23] (n = 83) (all 4 subgroups are combined because no substantial differences were found in subgroup analysis for individual laboratory results; thus, the same controls were counted twice in their respective comparison groups). Abbreviations: AUC, area under the receiver operating characteristic curve; CI, confidence interval; CRP, C-reactive protein.
DISCUSSION
We previously validated the 11-gene SMS to accurately diagnose sepsis as opposed to noninfectious inflammation in multiple cohorts in both children and adults [20–22]. Here, we further validated and extended the clinical utility of the SMS for diagnosing sepsis in 3 independent cohorts of neonates, in particular as a rule-out test (negative likelihood ratio, 0.085–0.117), but these measures are only estimates of real-world performance and might change with prospective validation. It should be noted that both the Wynn et al [23] and Cernada et al [29] data were not available at the time of the publication of the SMS report, which lends validity to the independence of these cohorts [20]. In addition to the diagnostic accuracy of the SMS alone, we also found that, combined with standard clinical laboratories, the SMS contributes to improved diagnosis of sepsis (mostly via reclassification of patients at low risk) even when the definition between cohorts varied.
In our study, we evaluated the diagnostic accuracy of common clinical laboratory tests for sepsis at the time of clinical suspicion. The CRP level is most specific when it can be measured longitudinally; in this study, we examined the diagnostic accuracy of only the initial values. In the Wynn et al [23] cohort, an elevated CRP level (peak, >45 mg/L within 48 hours) was part of the definition of sepsis; however, because we examined only the initial value that the clinician would have available rather than the peak among serial values obtained over the first 48 hours of illness, the use of CRP level in diagnosis is not circular reasoning. Furthermore, to the degree that this initial laboratory value might have been involved in the definition of sepsis, its utility in the diagnosis of sepsis relative to that of the SMS is actually overestimated. The fact that in this cohort the SMS at enrollment was able to diagnose later persistent CRP level elevations suggests its clinical utility at the time of initial suspicion for sepsis.
Although it is a necessary minimum standard, the key diagnostic comparison is not in differentiating neonates with confirmed bacteremia and healthy neonates. Instead, the critical unmet need is the ability to distinguish neonates with sepsis from neonates who also appear sick but are not infected (such as in the Wynn et al [23] study, in which diagnostic accuracy remained high). The problem with such a study is that there is neither a gold standard nor an accepted consensus definition for infection among neonates [37]. For instance, we ultimately do not know the infection status of the neonates in the Smith et al study with culture-negative suspected sepsis (because we do not have longitudinal data, such as serial examination results or CRP levels). However, it is encouraging that the SMS was mostly negative in these culture-negative cases, given the very low pretest probability for sepsis in neonates. Host–response biomarkers such as the SMS ultimately might contribute to the formation of a gold standard that can help to adjudicate culture-negative cases.
One potentially informative facet our study could not evaluate is the value of historical and clinical parameters to stratify the risk of sepsis. The neonatal sepsis clinical risk score from Puopolo et al [36], for instance, estimates the risk of sepsis using gestational age, maternal antepartum temperature, time since rupture of membrane, maternal group B Streptococcus status, and the duration of intrapartum antibiotic prophylaxis [4]. Stratification of patients by using such a clinical score before the use of molecular in vitro diagnostics such as the SMS might be a cost-effective approach; such a hypothesis requires further study.
The SMS requires quantitation of 11 host genes expressed in whole blood. Other groups have described similar gene-expression–based diagnostics specifically for infants [38] and children [39]. It should be noted that the 11 genes in the SMS have only 1 overlap with the other previously described gene-expression scores (BATF; Mahajan et al [38]). Because all of these gene signatures are selected for sparsity and a high expression correlation exists among similar genes, it is perhaps unsurprising that similar diagnostics can be made from different variables. One benefit of tests that use the host response is that RNA can be amplified from a very small amount of blood, whereas looking directly for pathogens (via culture or nucleic acid amplification tests) requires more sample volume to avoid Poisson limits (no capture of rare bacteria). Thus, the SMS can be optimized to a small-blood-volume bedside test as would be necessary for preterm infants. Several technologies (such as multiplex quantitative polymerase chain reaction [qPCR]) could be used as a platform for a point-of-care assay with a turnaround time of 60 minutes [40]; this is an area of active research.
A possible limitation of our validation study is that it was performed on cohorts assayed with microarrays. Microarrays are not optimal for quantitating gene expression compared to qPCR, although the relative differences between samples are largely preserved [41]. However, despite the high technical heterogeneity across the cohorts, the SMS still showed excellent diagnostic performance, demonstrating its robustness. Prospective study with a targeted assay is needed. Another limitation was the variability in the definitions of sepsis used among the 3 cohorts. Despite this variability, the SMS performed well in all the cohorts, which indicates its robustness.
CONCLUSIONS
Neonatal sepsis remains a difficult clinical challenge. The consequences of missed or delayed antibiotics are potentially devastating; thus, most patients for whom there is a clinical suspicion of sepsis are empirically treated until further confirmatory testing results are available. Improved diagnostic testing would enable potentially earlier intervention and more judicious use of antibiotics. Whether the SMS allows for improved outcomes as a result of earlier recognition or a reduction of unnecessary antimicrobial exposure requires prospective confirmation. This endeavor, in turn, will require optimization of the SMS into an assay with a clinically relevant turnaround time. Toward that goal, we have validated the diagnostic accuracy of the SMS in neonatal sepsis in 3 separate cohorts.
Supplementary Data
Supplementary materials are available at the Journal of the Pediatric Infectious Diseases Society online.
Notes
Acknowledgments. We thank the patients and families who participated in the studies described here. We thank Dr. Claire Smith, Dr. Thorsten Forster, Dr. Paul Dickinson, and Dr. Peter Ghazal for helpful discussion regarding their cohort. We also thank Dr. Lyle Moldawer for helpful comments in revising the manuscript.
Author contributions. T. E. S. conceived the study, performed the computations, interpreted data, drafted the manuscript, and revised and approved the final manuscript. J. L. W. conceived the study, contributed data, interpreted data, drafted the manuscript, and revised and approved the final manuscript. H. R. W. conceived the study, contributed data, interpreted data, and revised and approved the final manuscript. M. C., E. S., H. V. B., and M. V. contributed data, interpreted data, and revised and approved the final manuscript. P. K. conceived the study, interpreted data, and revised and approved the final manuscript.
Disclaimer. Inflammatix played no role in this article.
Financial support. This work was supported by the Bill and Melinda Gates Foundation (to P. K.), the National Institute for Allergy and Infectious Diseases (grants 1U19AI109662, U19AI057229, and U54I117925 [to P. K.]), the Gerber Foundation (to J. L. W.), the National Institutes for General Medical Sciences (grant GM106143 [to J. L. W.]), Rio Hortega (to M. C.), and a PI14/0443 grant and grant RD12/0026/011 RETICS funded by the PN 2018-2011 (Spain), ISCIII-Sub-Directorate General for Research Assessment and Promotion and the European Regional Development Fund (FEDER), reference RD12/0026 (Spanish Ministry of Economy and Competitiveness) (to M. V.).
Potential conflicts of interest. T. E. S. and P. K. are named as inventors on a patent for the SMS filed by Stanford University and are cofounders of Inflammatix, Inc, which plans to pursue commercialization of the SMS. The other authors report no conflicts. All authors have submitted the ICMJE Form for Potential Conflicts of Interest. Conflicts that the editors consider relevant to the content of the manuscript have been disclosed.
References
Author notes
T. E. S. and J. L. W. contributed equally to this work.
