


Abstract
Coyotes are ubiquitous in habitats across North America, including in urban areas. Reviews of human–coyote encounters are limited in scope and analysis and predominantly document encounters that tend to be negative, such as human–wildlife conflict, rather than benign experiences. The objective of our study was to use citizen science reports of human–coyote interactions entered into iNaturalist to better understand the range of first person accounts of human–coyote encounters in Madison, WI. We report 398 citizen science accounts of human–coyote encounters in the Madison area between October 2015 and March 2018. Most human–coyote encounters occurred during coyote breeding season and half of all encounters occurred in moderate development land cover. Estimated level of coyote aggressiveness varied significantly, with 90% of citizen scientists scoring estimated coyote aggression as a 0 and 7% scoring estimated aggression as a 1 on a 0–5 scale (with 0 being calm and 5 being aggressive). Our best performing model explaining the estimated distance between the human observer and a coyote (our proxy for a human–coyote encounter) included the variables distance to nearest paved road, biological season of the year relative to coyote life history, and time of day/night. We demonstrate that human–coyote interactions are regularly more benign than negative, with almost all first-hand reported human–coyote encounters being benign. We encourage public outreach focusing on practices that can foster benign encounters when educating the public to facilitate human–coyote coexistence.
Introduction
Due to their adaptability, omnivorous diet, and ability to successfully use a variety of habitats, coyotes (Canis latrans) have experienced a continent-wide range expansion (Gehrt and Riley 2010; Hody and Kays 2018). Historically confined to the southwestern region of the United States and into Mexico, coyotes are now found throughout North America, including all of southern Canada. Moreover, coyotes have colonized urban areas and they are commonly found in human-dominated landscapes throughout their current range. Coyotes can be an important and beneficial addition to the urban landscape because they will depredate pest or overabundant wildlife species and their presence adds to the local biodiversity (Hudenko et al., 2010). However, these and other benefits are often overlooked because of perceived or real human–coyote conflicts (Soulsbury and White 2015; Poessel et al. 2017b). Human–wildlife conflict occurs when humans determine that wildlife caused a real or perceived negative biological, political, economic or social effect (Frank 2016).
Although seemingly increasing in frequency, coyote attacks on pets and humans are rare (White and Gehrt 2009; Breck et al. 2019). White and Gehrt (2009) examined coyote attacks on humans in the United States and Canada and found that 59% of the attacks were classified as either predatory or investigative. Coyote attacks on children and adults were about equal, but predatory attacks were significantly greater on children than on adults (White and Gehrt 2009). Poessel et al. (2017b) found that coyote attacks on humans occurred with greater frequency in large urban areas in the western USA relative to other areas of the USA and occurred in areas with greater human development and less forest cover. Wine et al. (2015) found that coyote encounters in the Charlotte, NC, area occurred in areas with increased building density, which resulted in greater opportunity for human–coyote encounters because of relatively higher densities of humans in a concentrated area.
Past studies of human–coyote encounters are limited in scope and analysis (White and Gehrt 2009). Of the quantitative studies, Wine et al. (2015) found that coyote encounters occurred in areas with higher income levels because more food subsidies (e.g. compost and birdseed) were on the landscape relative to lower income areas. Areas of Charlotte where occupations required outdoor labor (e.g. landscapers) also experienced higher human–coyote encounters because people spent more time outdoors and had greater opportunities to encounter a coyote (Wine et al. 2015). Murray et al. (2015) found that coyotes that were diseased (e.g. mange) in cities in Canada were more likely to come closer to humans, likely because they were looking for food subsidies that could be acquired with little energy expended. However, most accounts are based on human dimension surveys and media stories or are anecdotal (White and Gehrt 2009; Poessel et al. 2013; Lu et al. 2016) and reported accounts predominantly document encounters that tend to be negative rather than benign experiences (Lu et al. 2016). Few published studies document first person accounts of encounters with coyotes.
As part of an ongoing research project live trapping and radio-collaring red foxes (Vulpes vulpes) and coyotes in Madison, WI (the UW Urban Canid Project), we developed a citizen science page where citizen scientists could record reports of encounters with these two urban canid species. In this article, we are reporting only the encounters with coyotes, including time, date and location of encounter, estimated distance to coyote and estimated level of coyote aggression, among other specifics. Our objective was to use coyote-specific reports to better understand first person accounts of human–coyote encounters in Madison. We broadly define the term human–coyote encounter to include reports of encounters with coyotes, such as an iNaturalist user seeing a coyote in their yard, from their car window, or while walking or jogging. Rather than iNaturalist users seeking out coyotes, we believe that the human–coyote encounters were happenstance due to the type of reported encounters. Based on nominal media reports of human–coyote interactions in Madison, we hypothesized that the majority of human–coyote encounters would be benign. We used distance between an observer and a coyote as a proxy for human–coyote encounters (Taylor and Knight 2003). Based on results from Poessel et al. (2013), we predicted that human–coyote encounters would occur most frequently during daylight hours when coyotes could be seen easier than during nocturnal hours and during the months (December to March) that coincided with coyote breeding season when coyotes tend to be more territorial and active (Lukasik and Alexander 2011).
Methods
Study area
Our study area was located in the greater Madison, WI, area, an urban area in Dane County that is 245 km2 in area (Fig. 1). Madison is the second largest city in Wisconsin, with a population of approximately 260 000 people (United States Census Bureau 2020). Mean temperatures ranged from −10.4°C in winter to 20.6°C in summer with mean yearly precipitation of 87.38 cm (http://www.aos.wisc.edu/∼sco/clim-history/state/4700-climo.html). Our study area included the University of Wisconsin-Madison (UW) campus, along with a mosaic of residential, commercial and semi-isolated natural areas bounded by developed roads and neighborhoods. Our study area also encompassed several public natural areas, including the UW Arboretum, and parks within the Madison Parks system. Habitats consisted of upland broadleaf deciduous forests, restored tallgrass prairie, oak savanna, human-planted coniferous forests and various wetland complexes.
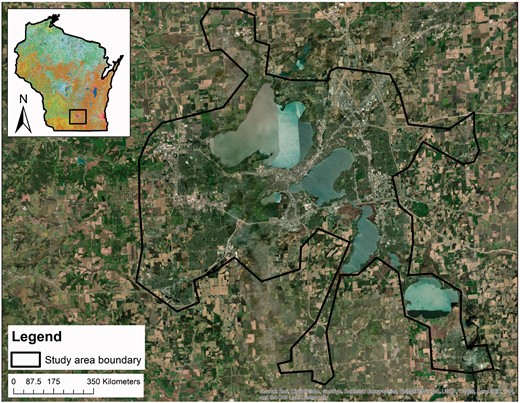
Study area in Madison, WI.
iNaturalist
We established a project-specific iNaturalist page in June, 2015 dedicated to capturing citizen-science sightings of coyotes and red fox in Madison. iNaturalist is an online social network designed to allow citizen scientists to record and share observational data of the biotic community. Over 890,000 observers have recorded observations of over 251,000 species worldwide since its launch in 2014 (www.inaturalist.org). We promoted the project through the UW Urban Canid Project Facebook Page (https://www.facebook.com/uwurbancanidproject/), website (http://uwurbancanidproject.weebly.com/reporting-an-observation.html), and local media. Each citizen-generated observation contained information about each unique coyote sighting, including time, location, and seven optional and brief questions about the observation. The optional questions were as follows: (i) Did you have a domestic dog with you? (ii) Did the coyote see you? (iii) If the coyote saw you, did it move away from you? (iv) How close were you to the coyote (estimated in yards)? (v) On a scale of 0 (calm) to 5 (aggressive), estimate the aggression of the coyote, (vi) Was the coyote wearing a radio collar? (vii) Was the coyote wearing ear tags? We included the last two questions because we were curious if ear tagged or radio collared coyotes were seen more frequently than non-tagged or collared animals. Other than asking each iNaturalist user to complete the above questions, instructions were minimal.
We omitted any observations from the same user that occurred within 24 hours of the previous observation to attempt to reduce the effects of observers making repeated observations of the same animal. We did not have the ability to verify that an iNaturalist-reported coyote was truly a coyote. However, we are confident that iNaturalist reports were accurate for a number of reasons. First, we screened all iNaturalist observations at least weekly and in some instances asked for, and received, additional information from an iNaturalist user to verify the observation. Second, many iNaturalist users uploaded pictures of their observation, and all of the uploaded pictures matched their reported observation. Third, in many areas where iNaturalist reports were located we also were able to document presence of a radio-collared coyote in the same area (Mueller et al. 2019).
Data variables
We included each of the variables from our iNaturalist questionnaire in statistical analyses. We estimated distance in yards to next nearest iNaturalist observation (hereafter INAT). We used a Geographic Information System (GIS; ESRI 2017. ArcGIS Desktop: Release 10.4. Redlands, CA: Environmental Systems Research Institute) to create a habitat map of our study area based on National Land Cover Data (NLCD 2011; 30 × 30 m resolution; Albers Conical Equal Area projection; 1983 North American datum), especially pertaining to human development. Using Gosselink et al. (2003) and Mueller et al. (2019) for guidance on urban coyote habitat selection, we omitted or combined the original 20 land cover classifications in the 2011 NLCD to arrive at the five land cover categories used in our analysis: developed open space (turf fields, non-forested parks, cemeteries; hereafter OPEN), moderate-intensity development (20–79% impervious surface, residential neighborhoods; hereafter MODR), high-intensity development (>80% impervious surface, industrial and commercial land; hereafter HIGH), non-developed (natural areas, including forest, grassland, emergent wetlands; hereafter NATR) and water (open bodies of water; hereafter WATER).
We estimated local population density (humans/km2; hereafter HUMN) data from the National Historical Geographic Information System based on which 2011 US Census block the coyote observation was recorded. We calculated distance in yards from nearest paved road to reported human–coyote encounter using local road data (Dane County Land Information Office 2020; hereafter ROAD). We categorized seasons (hereafter SEASON) based on biologically meaningful periods in the life of coyotes: breeding (December to March), pup-rearing (April to July), and non-breeding (August to November) (Bekoff and Gese 2003). We calculated time of day (hereafter TIME) based on local sunrise and sunset times using three periods: crepuscular (sunrise [time of sunrise ± 2 h] combined with sunset [time of sunset ± 2 h]), day (began after sunrise period and lasted until sunset period) and night (began after sunset period and lasted until sunrise period). This approach led to uneven temporal lengths of time periods but more accurately reflected seasonal changes to photoperiods and coyote activity periods.
Statistical analysis
For questions with a binary response (e.g. “Did you have a domestic dog with you?”; YES or NO), we counted the number of affirmative or negative responses. For variables that had multiple options (e.g. number of iNaturalist observations per each of the five NLCD land cover types), we counted the number of answers or observations per category. We asked each iNaturalist observer to estimate distance between themselves and the observed coyote based on pre-defined distance categories that were in gradations of 10 yards. We took the midpoint of each observers estimated distance category as the number of yards between the observer and coyote. We reported the distance between each iNaturalist observation and nearest paved road based on the distance tool in ArcGIS. We used a series of χ2 tests to determine if sightings varied by season, time of day, land cover, or estimated aggressiveness of coyotes. We deemed results significant if P ≤ 0.05.
We developed 10 a priori models (Table 1) using an Akaike information criteria (AIC) framework (Burnham and Anderson 2002) where “Estimated distance between observer and coyote (DIST)” was our response variable. Our predictor variables included summarized answers to the six optional questions asked of each person submitting an iNaturalist observation [Was a dog present during the human–coyote interaction (DOG)? Did the coyote see you (SEE)? If the coyote saw you, did it move away (AWAY)? Estimated aggression of the observed coyote (AGG) and Was the coyote wearing a radio collar (COLLAR) or ear tags (TAGS)?], our five NLCD land cover categories (OPEN, MODR, HIGH, NATR and WATER), human population density (HUMN), distance to nearest road (ROAD), biological meaningful season when observation occurred (SEAS) and time of day of observation (TIME). We tested for correlation between our predictor variables using the Pearson correlation function in R (V. 3.5.1, R Foundation for Statistical Computing, Vienna, Austria). We considered two variables to be correlated if the Pearson correlation coefficient was > 0.75. Whether the observed coyote was wearing ear tags and a radio collar were correlated, so we randomly chose to use the response to the question about observing a coyote wearing a radio collar. Because of repeated sampling likely due to multiple observations of the same coyote, we used the lme4 package in program R to run each of the linear mixed effect regression models. We used the distance to the next nearest iNaturalist observation as our random effect to try and account for variation among individual coyotes. We modeled all other predictor variables as fixed effects. We considered the top model to be the one with the lowest AICc value and the greatest weight. We considered any variable(s) within our top models to be significant at the P ≤ 0.05.
A priori models explaining estimated distance between human observer and coyote (proxy for human–coyote encounter) in Madison, WI, October 2015 to March 2018
| Model | AICc | ΔAIC | Wi |
|---|---|---|---|
| ROAD + SEASON + TIME | 3645.3 | 0 | 0.96 |
| COLLAR | 3652.7 | 7.3 | 0.03 |
| ROAD | 3655.8 | 10.5 | 0.005 |
| SEASON + TIME | 3658.5 | 13.2 | 0 |
| ROAD + NLCD | 3660.1 | 15.7 | 0 |
| HUMN + ROAD + NLCD | 3661.0 | 14.8 | 0 |
| SEE + AGG + AWAY | 3669.0 | 23.7 | 0 |
| NULL | 3672.2 | 26.9 | 0 |
| DOG | 3673.9 | 28.6 | 0 |
| NLCD | 3675.2 | 29.9 | 0 |
Our data will be deposited in the Illinois Data Bank upon acceptance.
Results
Our project (UW Urban Canid Project’s iNaturalist page) included reports from 1024 iNaturalist users, the majority of which reported encounters with red foxes. We report 398 iNaturalist accounts of human–coyote interactions in the Madison, WI, area between October 2015 and March 2018. Response rate varied for the seven optional questions that each iNaturalist observer was asked to complete. One hundred percent of iNaturalist users answered if a dog was present with them when they encountered a coyote and provided a distance estimate between themselves and the coyote. Ninety-nine percent (n = 394) provided an estimated level of coyote aggression, and 98% (n = 390) answered the question about whether the coyote moved away if it saw the iNaturalist observer. Eighty-seven percent (n = 346) of iNaturalist users answered the question “Did the coyote see you?” Only 45% (n = 179) of iNaturalist users provided an answer to the question about seeing a radio collar or ear tags on the coyote they encountered.
Of those who provided an answer, 34% (n = 61) noticed ear tags and 35% (n = 62) noticed a radio collar on the coyote they observed. The average distance from a reported human–coyote encounter to the nearest paved road was 55 yards (±93 yards). A domestic dog was not present with the person reporting a coyote encounter 77% (n = 308) of the time. The average estimated distance between the iNaturalist observer and the observed coyote was 25 yards (±25 yards; minimum distance = 5 yards and maximum distance = 100 yards). Sixty-two percent (n = 214) of the time the coyote saw the observer and 55% (n = 216) of the time the coyote moved away from the observer once the observer was seen by the coyote.
The time period that human–coyote encounters occurred was not significant (χ2 = 4.9, P = 0.09), with 38.4% during the daytime, 35.5% during crepuscular times and 26.1% during nighttime. The season of human–coyote encounters varied significantly (χ2 = 27.1, P < 0.0001), with 51% occurring during the coyote breeding season (December to March; Fig. 2). The land cover where human–coyote encounters occurred also varied significantly (χ2 = 166.8, P < 0.0001; Fig. 3), with 50% (n = 200) of the reported encounters occurring in the moderate-intensity development (MODR; 20–79% impervious surface, built environment) and 27% (n = 107) occurring in non-developed (NATR; natural areas, including forest, grassland, emergent wetlands). The estimated level of coyote aggressiveness in human–coyote encounters varied significantly (χ2 = 467.4, P < 0.0001; Fig. 4), and the vast majority of the iNaturalist users estimated the aggression level of the coyote they encountered as either 0 (n = 356; 90%) or 1 (n = 27; 7%).
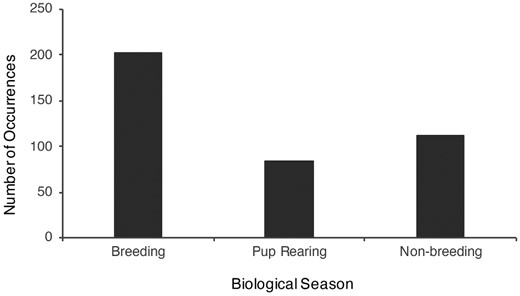
Number of human–coyote encounters by coyote biological season in Madison, WI, October 2015 to March 2018.
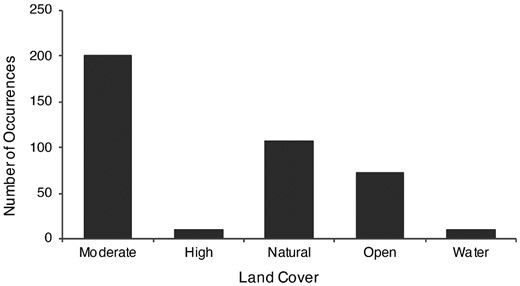
Land cover types in Madison, WI, where human–coyote encounters occurred, October 2015 to March 2018.
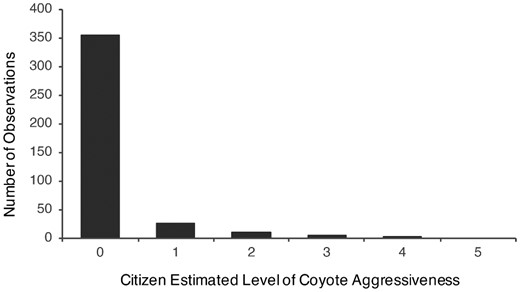
Estimated coyote aggression based on human–coyote encounters in Madison, WI, October 2015 to March 2018. Zero indicates calm and 5 indicates aggressive.
For our models determining factors driving the estimated distance between iNaturalist observers and coyotes, one model was clearly our top model (wi = 0.96; Table 1). This model contained the variables DIST (distance between human–coyote encounter and nearest paved road; β = 0.05 ± 0.01 SE), SEAS (biological season of the year; β = ‒ 4.5 ± 1.38 SE), and TIME (time of day/night human–coyote encounter occurred; mean β = ‒ 5.86 ± 3.75 SE).
Discussion
The objective of our study was to use our project-specific iNaturalist page to quantify first person accounts of human–coyote encounters in Madison, WI. Most studies examining human–coyote encounters are based on human dimension surveys (Jackman and Rutberg 2015; Lu et al. 2016), second-hand accounts (Poessel et al. 2013) or media reports (Alexander and Quinn 2011). Our prediction that the majority of human–coyote encounters in Madison, WI, would be benign held true. Contrary to what is reported in the peer-reviewed literature and through media accounts (White and Gehrt 2009; Alexander and Quinn 2011), the overwhelming majority of first-hand reported human–coyote encounters were benign, with 97% of iNaturalist users scoring estimated coyote aggression as a 0 or 1 on a 0–5 scale. Admittedly, estimated level of coyote aggression is a subjective answer, but we suggest that the consistency with which 97% of iNaturalist users answered the question indicates the vast majority of coyote encounters were non-aggressive. Additionally, most of the time (62%) the coyote saw the iNaturalist observer and more than half the time (55%) the coyote moved away from the iNaturalist observer after seeing the human. Poessel et al. (2017b) reported that between 2003 and 2010, >92% of human–coyote conflicts in the Denver Metropolitan Area involved attacks on domestic pets. However, Alexander and Quinn (2011) reported that only 24% of negative human–coyote encounters involved people with dogs. Only 23% of iNaturalist users in our study reported having a dog with them when they encountered a coyote.
We predicted that human–coyote encounters would occur most frequently during daylight hours when coyotes could be seen easier than during nocturnal hours and during the months (December to March) that coincided with coyote breeding season when coyotes tend to be more territorial and active (Lukasik and Alexander 2011). The greatest number of reports of human–coyote encounters in our study area occurred during the coyote breeding season (December–March), but coyote encounters were observed commonly during pup rearing and non-breeding seasons. Lukasik and Alexander (2011) also found that the greatest number of sightings of coyotes in Calgary occurred during the coyote breeding season and suggested that breeding season was the time of the year coyotes were most active and therefore presented the most opportunity to be seen. In addition, coyote breeding season coincided with winter months, a period of the year when foliage is absent from woody vegetation, thereby providing better sightlines. Poessel et al. (2013) reported coyote observations in the Denver Metropolitan Area more than twice as often on average during winter than any other time of year. However, Weckel et al. (2010) found no seasonal effect in coyote sightings in Westchester County, NY.
Schmidt and Timm (2007) suggested seven steps of increasingly troublesome coyote behavior. The first step in the progression being an increase in observing coyotes in yards and on streets at night and the seventh step culminating in coyotes acting aggressively towards humans in mid-day. Based on the human–coyote interactions observed in Madison, it would seem that coyotes are demonstrating behavior equivalent to step 3 on the Schmidt and Timm (2007) scale; that being crepuscular and daylight observance of coyotes on streets and in parks and yards. Although appearing during daylight hours may be a reason for concern that coyotes were habituating to people, thereby leading to possible aggressive coyote behavior, that does not seem to be the case in our study area. Coyotes typically are most active during nocturnal and crepuscular hours (Mueller et al. 2019), but are obviously easiest seen during daylight times. However, other studies have found that most coyote observations were noted during nocturnal hours (Grinder and Krausman 2001; Riley et al. 2003; Weckel et al. 2010). One explanation for coyotes often being seen during crepuscular hours in our study may be due to most observations coming during the winter months, and as winter days become shorter, schedules for dogwalkers and recreationists are more likely to coincide with crepuscular coyote activity patterns (Poessel et al. 2013).
Our best performing model explaining the estimated distance between the human observer and a coyote (our proxy for a human–coyote encounter) included distance to nearest paved road, biological season of the year relative to coyote life history, and time of day/night. Distance to nearest paved road may have improved sight lines for the iNaturalist observer and made it easier to see a coyote because vegetation on each side of a roadway is oftentimes cleared so drivers have improved safety via clear sightlines and the ability to see wildlife and other animals coming into the roadway (Eck and McGee 2008). Mueller et al. (2019) noted that coyotes were seen more frequently in areas of Madison, WI, with moderate human development and less frequently in areas with natural vegetation. In suburban NY, coyotes were observed and reported by citizen scientists on average 50% closer to forests, 36% closer to grasslands and 66% farther from medium- to high-density development (Weckel et al. 2010). Cover provided by forests may help reduce encounters between coyotes and people and their pets (Poessel et al. 2017a). In the Denver Metropolitan Area, coyote conflicts were more frequent than expected in developed and open space land cover types, possibly because of dense concentrations of people and pets, thereby providing more chances for a human–coyote encounter (Poessel et al. 2013, 2017a). Human–coyote conflicts in Calgary occurred in areas of the city with dense human population, which may be associated with greater availability of anthropogenic food sources, leading to food-conditioned coyotes (Lukasik and Alexander 2011).
Poessel et al. (2017a) found that >80% of large and medium-sized cities reported human–coyote conflicts. While coyote attacks on pets have occurred in Madison, WI in past years, our study area may be unique in that human–coyote conflicts are rare and human–coyote encounters seem to be overwhelmingly benign relative to what is reported in the literature and media accounts. Drake et al. (2020) found that a city’s identity shaped support and risk perceptions for urban coyotes, and previous studies have linked place identity with initiatives that supported the environment (Belanche et al. 2017). In a survey of public opinion toward urban red foxes and coyotes in Madison, WI, Nardi et al. (2020) found that the public had a more favorable attitude toward urban foxes relative to urban coyotes. In general, 34% of the people surveyed had positive or very positive attitudes toward coyotes compared to 63% who had a positive or very positive attitude toward foxes. Regardless, low mastery worldviews (e.g. belief that wildlife should be protected, should have rights and are an important part of the community), low perceptions of risks and high perceptions of benefits were related to a favorable attitude toward both urban coyotes and urban foxes. Approximately 33% of the people surveyed had negative views towards coyotes compared to only 5% for foxes.
The length of tenure of coyotes in an urban area tends to lead to tolerance of human–coyote encounters. Residents of an area typically have more benign views toward urban coyotes the longer coyotes have been present in the area (Hudenko et al. 2008; Lawrence and Krausman 2011). Zimmerman et al. (2001) suggested that people support the presence of urban coyotes as people get acclimated to them. Jackman and Rutberg (2015) found growing acceptance of urban coyotes and increased opposition to lethal control, even in areas where human–coyote conflicts have occurred. There are no known records of when coyotes first colonized Madison, WI, but coyotes have been in the city limits since at least the 1980s based on media reports, so residents of our study area have a relatively lengthy co-existence with coyotes.
The use of citizen science data for research comes with inherent limitations, and iNaturalist is no exception. For example, we experienced uneven spatial and temporal sampling, and it is important to understand these limitations and how they may be affected by the life history of a target species (Mueller et al. 2019). However, the value of the data collected through our iNaturalist project is the quality of responses we received to detailed questions about each encounter. This allowed us to examine individual human–coyote encounters, which is often a missing component of human-wildlife interaction studies.
Although coyote habituation towards humans in our study area seems to be increasing, the habituation does not seem to be leading to aggressive behavior based on the iNaturalist estimates of coyote aggression. We do not have empirical evidence to support our contention, but we suggest that the outreach efforts associated with our larger UW Urban Canid Project are educating the general public on what to do and not do in order to promote human–coyote co-existence. Siemer et al. (2014) described windows of opportunities following coyote attacks on children in New York, and resulting media coverage, at which time the public’s awareness about coyotes and receptiveness to coyote-related education may change the public’s perceptions about coyote risk and tolerance. Coyote attacks on pets in Madison that occurred in 2009, 2011 and 2015 received considerable media attention and community town hall events were organized following the attacks. Outreach and education regarding how to live with coyotes were disseminated at the events. Our UW Urban Canid Project outreach efforts, on the other hand, are constant and have been an integral part of our research project since we started in 2014. As part of our outreach efforts, we collaborated with the Madison and Dane County (WI) Public Health Department to produce a You Tube video titled “How to Haze a Coyote”, which as of April 2020 had received over 48 000 views. We also promote ways to decrease coyote habituation of people via public talks, and using our UW Urban Canid Project’s social media and website outlets. Lastly, we instruct people to call either 9-1-1 or the Wisconsin Department of Natural Resources should they feel threatened by a coyote or when a coyote is aggressive toward them, their children, or their pets.
Conclusions
Coyotes are common in urban areas of North America and will be a consistent presence arguably for as long as cities exist. As humans, it would behoove us to figure out ways to peacefully co-exist with urban wildlife, especially apex predators like coyotes. Our study did not elucidate the mechanisms that provide a recipe for favorable human–coyote interactions, but it does demonstrate that human–coyote interactions can be more benign than negative. Drake et al. (2020) posited that targeting people’s emotional connections to animals like coyotes will be a more effective strategy to increase support for coyotes than increasing the public’s knowledge about urban coyotes. While we will always create opportunities to improve the public’s knowledge about urban coyotes using research-based information, we also agree with Drake et al. (2020) and suggest that citizen science opportunities like iNaturalist have the potential to provide an avenue to engage the public so they may report the connection they experienced seeing a coyote.
Acknowledgments
We thank Meghan Pluemer for assistance with ArcGIS. We thank Morgan Farmer for creating Fig. 1. We thank the citizens of Madison, WI for taking time to report sightings of coyotes and red foxes to our iNaturalist page.
Conflict of interest statement. None declared.
