


Abstract
One way to increase yield potential in wheat is screening for natural variation in photosynthesis. This study uses measured and modelled physiological parameters to explore genotypic diversity in photosynthetic capacity (Pc, Rubisco carboxylation capacity per unit leaf area at 25 °C) and efficiency (Peff, Pc per unit of leaf nitrogen) in wheat in relation to fertilizer, plant stage, and environment. Four experiments (Aus1, Aus2, Aus3, and Mex1) were carried out with diverse wheat collections to investigate genetic variation for Rubisco capacity (Vcmax25), electron transport rate (J), CO2 assimilation rate, stomatal conductance, and complementary plant functional traits: leaf nitrogen, leaf dry mass per unit area, and SPAD. Genotypes for Aus1 and Aus2 were grown in the glasshouse with two fertilizer levels. Genotypes for Aus3 and Mex1 experiments were grown in the field in Australia and Mexico, respectively. Results showed that Vcmax25 derived from gas exchange measurements is a robust parameter that does not depend on stomatal conductance and was positively correlated with Rubisco content measured in vitro. There was significant genotypic variation in most of the experiments for Pc and Peff. Heritability of Pc reached 0.7 and 0.9 for SPAD. Genotypic variation and heritability of traits show that there is scope for these traits to be used in pre-breeding programmes to improve photosynthesis with the ultimate objective of raising yield potential.
Introduction
There is no doubt that wheat yields need to increase markedly as the global population rises (Fischer et al., 2014). Wheat yield can be factored into the two major components of biomass and harvest index (Reynolds et al., 2009). It is widely believed that the genetic potential for improvements in harvest index has been largely exhausted in rice and wheat, resulting in crop biomass becoming a major breeding target (Parry et al., 2011). Improvements in crop biomass can come about via increased light interception and radiation use efficiency (RUE), where photosynthesis plays an important role (Singh et al., 2014; Furbank et al., 2015; Ort et al., 2015). Evidence from modelling and CO2 enrichment suggests that RUE of wheat could be increased by up to 50% with improvement in photosynthetic traits (Reynolds et al., 2012), and there are large international efforts to engineer photosynthetic improvements in model plants and cereal crops which could be deployed in wheat (Furbank et al., 2015; Simkin et al., 2019). In the few surveys on genetic variation in photosynthetic performance in wheat, spot measurements of CO2 assimilation rate (A) and stomatal conductance (gs) were made. Some studies have shown diversity in A across wheat genotypes and a positive correlation with yield and year of release (Reynolds et al., 1994, 2000; Fischer et al., 1998; Tang et al., 2017), while others found little or no correlation (Murthy and Singh, 1979; Evans, 1993; Sadras et al., 2012).
An alternative to using single point measurements of A is to measure CO2–response curves and derive underlying biochemical parameters (Farquhar et al., 1980; von Caemmerer et al., 1994). Two important modelled parameters are maximum Rubisco activity (Vcmax) and electron transport rate (J). While these parameters require more than a single point measurement of A, they show promise as robust traits to assess photosynthetic capacity in C3 plants since they are independent of gs (Condon et al., 2004; Feng et al., 2018). In the last 20 years, Vcmax and J have become common parameters used in both plant physiology and ecophysiology, probably because of the increased availability of portable commercial instruments to assess A in the field (Long et al., 1996). Interest in these modelled parameters, rather than single point determination of A, has also increased with the development of leaf reflectance models to rapidly predict these photosynthetic traits without measuring gas exchange (Silva-Perez et al., 2018) and the development of high-throughput gas exchange techniques (Stinziano et al., 2017). However, few papers have been published analysing genetic variation for Vcmax and J in wheat (Driever et al., 2014; Jahan et al., 2014; Carmo-Silva et al., 2017), and these measurements were done in isolation from other important leaf traits. If we intend to use such derived traits for selecting wheat varieties with high RUE, it is necessary to compile more information about the genotypic variation for Vcmax and J and have a better understanding of these traits as a measure of photosynthetic capacity. In this study, we analyse genotypic variation in Vcmax and J measured entirely in situ in the field using specific Rubisco kinetic parameters to calculate Vcmax25 (normalized at 25 °C) and J in wheat (Silva-Pérez et al., 2017).
Leaf nitrogen (N) is also relevant to the study of photosynthetic performance because about half of the N in a C3 leaf is directly associated with photosynthesis and 20% with Rubisco (Evans and Clarke, 2019). While A is positively correlated with leaf N, there is variation in A for a given leaf N content (Evans, 1989). This indicates that there is genetic variation in apportioning of leaf N to photosynthetic proteins and enzyme performance, and hence leaf N alone is not a robust indicator of photosynthetic capacity. Carboxylation efficiency (Rubisco carboxylase activity per unit of leaf N) has also been used to describe variation in photosynthetic performance between two Triticum species (Evans and Seemann, 1984). Therefore, it would be useful to analyse Vcmax25 as an indicator of Rubisco capacity per unit leaf area, and also expressed per unit leaf N (Vcmax25/Narea), which we call photosynthetic efficiency (Peff).
Determining the physiological mechanisms underlying variation in photosynthetic traits will permit us to understand the relationship between leaf biochemistry and leaf anatomy. Leaf dry mass per unit area (LMA) correlates with the leaf lamina thickness. High LMA can be due to a thick leaf and/or high leaf density, and a higher chloroplast area (Poorter et al., 2009), and is often reported to be a major driver of interspecific variation in photosynthetic capacity per unit of leaf area (Ellsworth and Reich, 1993). Studying genetic variation in LMA and its relationship to photosynthetic capacity is essential to dissect the contributions of photosynthetic machinery, leaf N, or leaf structural support components such as cellulose to functional traits such as CO2 assimilation and mesophyll conductance (Jahan et al., 2014; Osnas et al., 2018).
It is known that chlorophyll content is related to leaf N, Rubisco activity, and photosynthetic capacity (Evans, 1983; Seemann et al., 1987), and quantitatively related to the green colour of leaves (Inada, 1963). There are several portable non-destructive instruments to measure leaf chlorophyll, such as the Minolta SPAD chlorophyll meter. Although it is known that the Minolta SPAD saturates at high chlorophyll contents (Monje and Bugbee, 1992), it is widely used and provides a good indicator of leaf N and chlorophyll content in a range of plants (Bullock and Anderson, 1998; Chang and Robison, 2003; Lopez-Bellido et al., 2004). As SPAD has been used to detect variation in chlorophyll in wheat (Hamblin et al., 2014), and is a leaf functional trait that is easily obtained, it was included in our assessment of photosynthetic diversity in wheat.
This study investigates genetic variation in wheat flag leaf functional traits measured in germplasm previously used to build predictive machine learning models based on leaf hyperspectral reflectance data (Silva-Perez et al., 2018). In this study we use two parameters, Pc and Peff, to describe wheat photosynthetic performance. Photosynthetic capacity (Pc) is defined as the Rubisco activity or electron transport rate under high irradiance per unit leaf area (i.e. Vcmax25 or J) when crop growth is not limited by water, light, or N. We define photosynthetic efficiency (Peff) as the photosynthetic capacity per unit of leaf N. Genotypic variation for these metrics of photosynthetic performance is examined from two perspectives. First, we consider plant physiological and biochemical mechanisms by comparing in vitro Rubisco content against Vcmax25, LMA, leaf N, and SPAD. Secondly, we assessed photosynthetic diversity and heritability of all measured plant functional traits, including modelled traits (Vcmax25, J), single point traits (A, gs), and leaf structural traits (leaf N, LMA, SPAD). The effects of environmental conditions on Pc and Peff across elite wheat genotypes were determined to evaluate if these traits are robust enough to be used in pre-breeding and to increase genetic gain in breeding programmes.
Materials and methods
Plant material and experimental conditions
Three sets of wheat (Triticum aestivum L. and T. turgidum L.) and triticale (Triticosecale.) germplasm were used in these experiments (Supplementary Tables S1, S2, S3 at JXB online): (i) Early Vigour (EV); (ii) Best and unreleased Yield Potential (BYP); and (iii) CIMMYT core germplasm subset II (C). These sets of wheat genotypes were evaluated in four experiments as described in Silva-Perez et al. (2018).
(i) In Aus1, the EV set was planted in a glasshouse in Canberra, Australia (35°16'18.8''S, 149°06'50.3''E). Artificial light was used in June to extend the photoperiod to 16 h and temperature was controlled to 25/15 °C (day/night) using gas heating and evaporative cooling. Plants were irrigated optimally by watering to field capacity. Two seeds of the EV set were sown in cylindrical pots of 1.06 litres (15×5 cm) with 75:25 loam:vermiculite containing basal fertilizer, and one plant per pot was kept for the experiment. The experiment was designed with two N treatments, one with optimal N fertilizer (+N) and the other with a severe low N treatment with three repetitions. Extra fertilizer (Thrive, ~300 ml per pot of 1.77 g l−1; 27% N, 5.5% P, 9% K) was applied each week for the +N treatment until 83 DAE (days after emergence). The low N treatment was obtained by watering the pots without fertilizer for 1.5 months before measurements. Plant emergence was on 8 April 2012 and measurements were done at the end of booting and during anthesis (EVA) in 16 wheat genotypes, 73–83 DAE.
(ii) In Aus2, the BYP set was planted and grown in the same glasshouse conditions as in experiment Aus1. Three seeds of the BYP set were sown in 5 litre pots with a similar soil mix to the Aus1 experiment, and two plants per pot were kept for the experiment. The experiment included one N treatment with optimal N fertilizer (+N) and a moderate low N treatment (–N). Extra fertilizer (Aquasol, ~300 ml per pot of 1.77 g l−1; 27% N, 5.5% P, 9% K) was applied every 3 d from 41 to 46 DAE. The low N treatment was obtained by watering the plants without fertilizer which leached out soil nutrients over 10 d before measurements. There were three blocks with two plants per pot; in two blocks, one plant per pot was used to get two repetitions for +N treatment and in the third block, two plants from the same pot were used to get two repetitions for –N treatment. Plant emergence was on 17 October 2012 and measurements were done before anthesis (BYPB) in 21 wheat genotypes plus nine triticale genotypes. The flag leaf was measured before anthesis from 48 to 56 DAE.
(iii) In Aus3, the BYP set and C set were sown adjacent to each other in the field at Ginninderra Experimental Station, Australia (35°11'59.4''S, 149°05'27.2''E), at a density of ~200 plants m−2. From 1 to 75 DAE, the average temperature was 22.4 °C/7.7 °C (max/min) and relative humidity was 76.6/35.4 (max/min), there was a total rainfall of 142 mm, an accumulative thermal time of 1126.8 °C d (base temperature 0 °C), and average solar radiation of 24 MJ m−2 (Supplementary fig. S1 in Silva-Perez et al., 2018). Due to late sowing and long days (~11 h), the wheat life cycle was short. The experiment was designed in two replicated blocks, fertilized and irrigated optimally. Plant emergence was on 4 October 2013. Two plants per plot (four plants per genotype) from six triticale genotypes and 20 wheat genotypes were measured in the BYP set before anthesis (BYPB) at 46–54 DAE and 22 wheat genotypes from C after anthesis (CA) at 60–67 DAE.
(iv) In Mex1, the C set was planted in the field at Centro Experimental Norman E. Borlaug, Sonora, Mexico (27°22'15.0''N, 109°55'49.3''W), at a density of ~165 plants m−2. From 1 to 138 DAE, the average temperature was 26 °C/8.3 °C (max/min) and relative humidity was 90.9/34.4 (max/min), with a total rainfall of 15.4 mm, an accumulative thermal time of 2364.6 °C d, and average solar radiation of 17 MJ m−2 (Supplementary fig. S1 in Silva-Perez et al., 2018). The experiment was organized in a lattice design with three replicate blocks fertilized and irrigated optimally. First fertilizer application was at soil preparation with 50 kg ha−1 of N and 50 kg ha−1 of P, and second fertilizer application was in the first irrigation with 150 kg ha−1 of N. Irrigation was delivered in five events, in total ~500 mm of water. Plants emerged on 2 December 2012. One plant per plot was measured in 30 wheat genotypes in two plant stages, before anthesis (CB) 67–82 DAE and after anthesis (CA) 88–103 DAE.
In a fifth experiment, Cabinet, four genotypes from the BYP set (Espada, Merinda, Mace, and Hawkeye) were grown in the same glasshouse and conditions as in the Aus2 experiment. Plants were transferred into a controlled-environment cabinet (Thermoline Scientific Model-TRIL/SL) during gas exchange measurements at different temperatures (experiment from Silva-Pérez et al., 2017). Only gas exchange measurements done at 25 °C were used in this study (Table 1).
Overview of experiments
| Experiment | Genotypes (DAE) | Plants measured | Traits measured (no. of genotypes) |
|---|---|---|---|
| Aus1 | EVA (73–83) | 3 (+N) | Single point, modelled, and leaf structural traits (16) |
| 3 (–N) | |||
| Aus2 | BYPB (48–56) | 2 (+N) | Single point, modelled, and leaf structural traits (30) |
| 2a (–N) | Rubisco in vitro (5) | ||
| Aus3 | BYPB (46–54) | 4a | Single point and modelled traits (25) |
| Leaf structural traits (28) | |||
| Rubisco in vitro (5) | |||
| CA (60–67) | 4a | Single point, modelled, and leaf structural traits (20) | |
| Mex1 | CB (67–82) | 3 | Single point traits (30) |
| SPAD (30) | |||
| CA (88–103) | 3 | Single point and modelled traits (29) | |
| Leaf structural traits (30) | |||
| Cabinet | Merinda (51–53) | 4 | Single point, modelled, and leaf structural traits, and Rubisco in vitro (4) |
| Espada (39 and 50) | 2 | ||
| Mace (57–59) | 4 | ||
| Hawkeye (58–59) | 3 |
Aus1, glasshouse experiment, Australia (2012); Aus2, glasshouse experiment, Australia (2012); Aus3, field experiment GES-CSIRO Australia (2013); Mex1, field experiment, CENEB-CIMMYT, Mexico (2012–2013); Cabinet, glasshouse grown and measured in growth cabinet (2014), Australia; Stage B, before anthesis; Stage A, after anthesis; DAE, days after emergence; –N, low nitrogen treatment; +N, normal nitrogen treatment
a Two plants were measured in the same pot in Aus2 or the same plot in Aus3. Single point traits (A, gs, and Ci/Ca), modelled traits (Vcmax25, J, and J/Vcmax), and leaf structural traits (Nmass, LMA, Narea, and SPAD).
Measured traits
Single point traits are traits obtained from leaf gas exchange with a Li-Cor (LI-6400XT) with 1800 µmol quanta m−2 s−1: Assimilation rate (A, µmol CO2 m−2 s−1), stomatal conductance (gs, mol H2O m−2 s−1), and ratio of internal to atmospheric CO2 concentration (Ci/Ca) were obtained at inlet 400 µmol CO2 (mol air)−1 from A:Ci curves. Modelled traits were estimated from the same A:Ci curves lasting ~20–25 min: velocity of carboxylation (Vcmax, µmol CO2 m−2 s−1), velocity of carboxylation at 25 °C (Vcmax25, µmol CO2 m−2 s−1), electron transport rate (J, µmol e− m−2 s−1), J/Vcmax [mol e− (mol CO2)−1], and Vcmax25/Narea [µmol CO2 s−1 (g N−1)] using the C3 biochemical model of photosynthesis (Farquhar et al., 1980). Vcmax was the trait most sensitive to temperature and we have addressed this issue by normalization to 25 °C (Silva-Pérez et al., 2017). Leaf structural traits were measured on the same leaf following gas exchange measurements: leaf dry mass per area (LMA, g m−2), leaf N concentration (Nmass, mg N g−1), leaf N per unit area (Narea, g N m−2), and SPAD as a surrogate for chlorophyll content. Details of protocols can be found in Silva-Perez et al. (2018). Additionally, in the Mex1 experiment, the apparent electron transport rate from chlorophyll fluorescence (ETR) and the photochemical efficiency of PSII (ΦPSII) were measured with an inlet CO2 concentration of 400 µmol CO2 (mol air)−1 at the end of the A:Ci curve using the 2 cm2 circular fluorescence head (Li-6400-40; LI-COR Inc.). The 6 cm2 rectangular head was used for experiments Aus1, Aus3, and Aus3.
Gas exchange traits (A, gs, Ci/Ca, Vcmax25, and J) and their respective sampling for laboratory analyses were done within a maximum of 10 d, and genotypes were grouped by plant stage to obtain measurements at a similar plant stage. In Mex1, different plants from the same plot were measured and sampled in each plant stage (CB and CA). As the A:Ci curves measured in experiment CB_Mex1 included fewer CO2 concentrations, they have not been used to derive values for Vcmax25 and J. Leaf area was not measured in the CB_Mex1 experiment so Narea and LMA were not calculated. Therefore, Nmass was added in this study. Due to a lack of time, only 20 of the 30 genotypes from the C set were measured in Aus3.
Yield was measured in the Mex1 experiment after wheat physiological maturity following CIMMYT protocols (Pask et al., 2012) and calculated from a subsample of grain harvested in 4.8 m2.
Rubisco content in vitro was quantified from leaf tissue of genotypes Espada, Merinda, Mace, Drysdale, and Hawkeye from BYPB experiments for plants grown in glasshouse (Aus2) or field (Aus3) environments. The piece of leaf that was enclosed in the Li-Cor leaf chamber was frozen immediately in liquid N and stored at –80 °C for later determination of Rubisco content. Rubisco quantification was estimated by the irreversible binding of 14C-labelled carboxyarabinitol-1,5-bisphosphate (CABP) to the fully carbamylated enzyme (Ruuska et al., 1998). Leaf tissue (0.25 cm2) was ground in a Ten Broek homogenizer in 1 ml of ice-cold extraction buffer [50 mM Epps-NaOH pH 8.0, 1 mM EDTA, 1% (w/v) polyvinylpolypyrrolidone (PVPP), 10 mM MgCl2, 10 mM NaHCO3, 10 mM DTT, 0.01% Triton] with 5 μl of plant protease inhibitor cocktail (Sigma), and centrifuged at 17 000 g for 5 min at 4 °C. A 25 μl aliquot of the supernatant liquid plus 75 μl of extraction buffer were mixed and incubated with 1 μl of [14C]CABP at room temperature. After >30 min, [14C]CABP bound to Rubisco was separated from free [14C]CABP using gel filtration through 0.7×27 cm columns of Sephadex G-50 fine, equilibrated with 20 mM Bicine-NaOH buffer, pH 8, containing 75 mM NaCl. Fractions with Rubisco–CABP complexes were collected and [14C]CABP was determined by liquid scintillation using a Liquid Scintillation Analyzer (Tri-Carb 2800TR; Perkin Elmer).
Statistical methods
Statistical analyses were undertaken using linear mixed models with residual maximum likelihood (REML) estimation, using the software package Asreml-R V4 (Butler et al., 2017). Genetic effects were fitted as random terms in each analysis, and best linear unbiased predictors (BLUPs) were predicted for each genotype (detailed descriptions of the model constructs are provided in Supplementary Table S4). In the case of a trial with a single measurement time and no treatment applied (eg. CA_Aus3), the linear mixed model for the trait y may be written as
where τ is a vector of fixed effects with design matrix X, ug is a vector of random variety (or genetic) effects, with design matrix Zg, uo is a vector of other non-genetic random effects (e.g. replicate effects) with design matrix Zo, and e is the vector of random residual effects. For the random effects we assume ug~N(0,Gg), uo~N(0,Go), and e~N(0,R). Here Gg is given by Gg=σ 2gIm where σ2g is the genetic variance component and Im is the identity matrix so that genotypes are assumed independent.
The residual covariance matrix R was given by:
where σ 2e is the estimated residual variance component and Σ c and Σ r are the column and row spatial correlation matrices (to account for the fact that neighbouring plots are likely to be spatially correlated) usually taken as autoregressive models of order 1 (ar1) (Gilmour et al., 1997). Further spatial row and column terms (for global spatial trends across the trial) were tested following the approach of Gilmour et al. (1997) and Stefanova et al. (2009). Identity matrices were assumed for Σ c and Σ r in glasshouse trials (Aus1 and Aus2). Two different LI-6400XT were used in each experiment (BYPB_Aus2, BYPB_Aus3, CB_Mex1, and CA_Mex1) and instruments used were different between Australia and Mexico. Therefore, each instrument (LI-6400XT) was accounted for by including a random instrument effect for gas exchange traits (A, gs, Ci/Ca, Vcmax, Vcmax25, J, and J/Vcmax). Stomatal conductance (gs) was the only trait obtained from LI-6400XT found to be affected by the time of day, so the time of day was included as a covariate when analysing gs variation.
Multi-environment analyses were conducted to estimate the genetic correlations between environments including glasshouse and field, and locations Australia and Mexico using common genotypes across sites. Multi-time analyses were also conducted (within the Mex1 trial) for each trait across the two measurement times. A series of bivariate analyses were also conducted between pairs of traits to estimate genetic correlations between traits. In each of these multivariate analyses the same underlying mixed model (Equation 1) is assumed; however, the variance matrix Gg for the genetic effects (ug) across measurement times, trials, or traits was represented by:
where Gt, the genetic variance matrix consisting of genetic variances for each trial, sampling time, or trait (and covariances), was modelled using an unstructured covariance matrix.
In the case of a multi-site analysis, the full residual covariance matrix R is given by a block diagonal matrix R=diag(Rt) where Rt is the residual variance matrix for the tth trial. Therefore, each trial has its own residual covariance structure of the form given in Equation 2, and residuals are assumed to be independent between trials.
The multi-trait and multi-time analyses accounted for the between trait or temporal correlation between repeated measurements as well as any spatial correlation using a three-way separable spatio-temporal residual process (Smith et al., 2007; De Faveri et al., 2015). Therefore, the structure for R is assumed to be:
where Rt is the residual between trait or temporal covariance matrix, modelled using unstructured models, and Σ ct and Σ rt are the column and row spatial correlation matrices.
In the case of a single site and single time analysis with treatment effects, the genetic covariance matrix Gt for genetic effects across treatments may be modelled as in Equation 3, but with a residual model as in Equation 2. Significant genetic variances were detected using REML likelihood ratio tests (REMLRT).
Broad-sense mean line heritability (h2) for each trait at each experiment was estimated using the formula of Cullis et al. (2006):
where avsed2 is the average variance of difference between genotype BLUPs, and σ 2g is the genetic variance.
Results
This study examines genetic variation in wheat for three types of leaf functional traits related to photosynthetic performance: (i) single point traits (A, gs, and Ci/Ca); (ii) modelled traits (Vcmax25, J, and J/Vcmax); and (iii) leaf structural traits (Nmass, LMA, Narea, and SPAD), measured in Australia and Mexico (Fig.1). The electron transport rate was also independently estimated with chlorophyll fluorescence (ΦPSII and ETR) in Mexico.
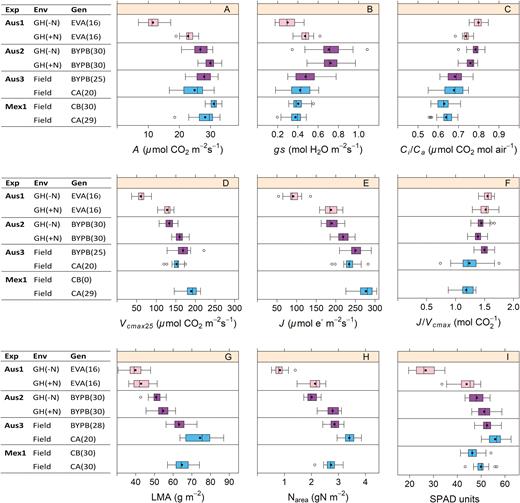
Wheat and triticale germplasm was measured for (A) A, (B) gs, (C) Ci/Ca, (D) Vcmax25, (E) J, (F) J/Vcmax25, (G) LMA, (H) Narea, and (I) SPAD, in three experiments measured in Australia (Aus1, Aus2, and Aus3) and one in Mexico (Mex1). Some experiments were set up in the glasshouse (GH) and others in the field. Three sets of genotypes were assessed: Early Vigour set, EV (pink); BUNYIP set, BYP (purple); and CIMCOG set, C (blue). An extra ‘B’ in the acronyms means measured before anthesis and an extra ‘A’ means after anthesis. The numbers of genotypes measured are in parentheses. The coloured section is the interquartile range (IQR), representing 50% of the data. The lower IQR edge is the point at 25% of the data. The middle black point is the mean, and the line is the median. The upper IQR edge is the 75% point. The whiskers are 1.5 times the IQR, showing the minimum and maximum data. Circles are outliers.
Rubisco activity and electron transport rate as a measure of photosynthetic capacity
One main focus of this work was to determine if Vcmax25 could be used in wheat to accurately estimate Rubisco amounts and as a metric for determining genetic variation in photosynthetic capacity (Pc). We compared modelled Vcmax25 against Rubisco content using four wheat genotypes and one triticale genotype from the BYPB set. Rubisco active site content per unit leaf area was highly correlated with Vcmax25 calculated from gas exchange (Fig. 2).
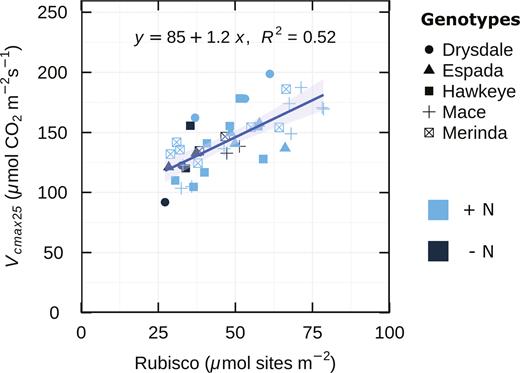
Maximum carboxylation rate in vivo (Vcmax25) as a function of leaf Rubisco content. Data from four wheat genotypes and a triticale (Hawkeye) measured and sampled in an environment cabinet, glasshouse, and the field, n=41. R2 is the coefficient of determination. The shaded band indicates the level of uncertainty of the regression line.
The correlation between stomatal conductance and other measured or modelled photosynthetic traits is shown in Table 2. In all experiments, A was also highly correlated with gs, whereas Vcmax25 and J showed weaker correlations with gs (Table 2). Vcmax25 may be a good parameter for determining genetic variation in Pc in wheat because Vcmax25 correlated well with Rubisco active site content and showed relatively little influence of gs.
Genetic and phenotypic correlations of stomatal conductance (gs) with traits A, Vcmax25, and J
| Experiment | Genetic correlation | Phenotypic correlation | ||||
|---|---|---|---|---|---|---|
| A | Vcmax25 | J | A | Vcmax25 | J | |
| EVA_Aus1 | 0.91* | 0.87* | 0.72* | 0.81 | 0.70 | 0.60 |
| BYPB_Aus2 | 0.61 | 0.01 | 0.20 | 0.74 | 0.48 | 0.36 |
| BYPB_Aus3 | 0.78 | 0.27 | 0.36 | 0.82 | 0.20 | 0.31 |
| CA_Aus3 | 0.97 | 0.68 | 0.32 | 0.94 | 0.57 | 0.43 |
| CA_Mex1 | 0.97 | 0.42 | 0.17 | 0.92 | 0.36 | 0.41 |
| CB_Mex1 | NA | – | – | 0.83 | – | – |
Experiments Aus1 and Aus2 were calculated using both nitrogen treatments, unless marked with an asterisk
NA, insufficient genetic variance for the calculation.
The electron transport rate was independently calculated from CO2 response curves (J) and from chlorophyll fluorescence (ETR) in the CA_Mex1 trial. Positive genetic (0.66) and phenotypic (0.59) correlations were found (Supplementary Table S5). Therefore, electron transport rate could also provide a screening parameter for photosynthetic capacity (Pc) in wheat.
Rubisco activity and leaf nitrogen as a measure of photosynthetic efficiency
Results of the experiment investigating the relationship between Vcmax and Rubisco active site content (Fig. 2) provide independent validation of this diversity in allocation of leaf N to Rubisco and the lack of correlation with LMA. Rubisco content varied almost 3-fold over an LMA range of only 45.8–65 g m−2 (Fig. 3A). While leaf N showed a positive correlation with Rubisco in vitro, there was diversity in Rubisco content at a given leaf N, particularly at high Narea values (Fig. 3B).
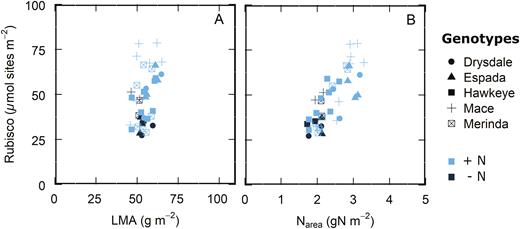
Leaf Rubisco content as a function of (A) leaf mass area (LMA) and (B) leaf nitrogen per area (Narea). Data from wheat genotypes and a triticale from Fig. 2 measured and sampled in a controlled growth chamber, glasshouse, and the field, n=41.
When LMA and Vcmax25 were compared across genotypes, it was found that thicker leaves are generally associated with higher photosynthetic capacity (Fig. 4A). However, there was also considerable variation in Vcmax25 at a given LMA, consistent with the Rubisco content data in Fig. 3A. A lack of correlation between LMA and Vcmax25 was found in most of the experiments (Table 3). In the case of leaf N, while there was a positive correlation between Vcmax25 and Narea, it was not always high (Table 3), particularly at high leaf N contents (Figs 3B, 4B).
Phenotypic correlations of Rubisco activity (Vcmax25) with leaf mass per area (LMA) and leaf nitrogen per area (Narea)
| Experiment | Vcmax25 versus LMA | Vcmax25 versus Narea |
|---|---|---|
| EVA_Aus1 | 0.47 | 0.61 |
| BYPB_Aus2 | 0.30 | 0.46 |
| BYPB_Aus3 | –0.02 | 0.23 |
| CA_Aus3 | –0.11 | 0.11 |
| CA_Mex1 | 0.10 | 0.26 |
| Experiment | Vcmax25 versus LMA | Vcmax25 versus Narea |
|---|---|---|
| EVA_Aus1 | 0.47 | 0.61 |
| BYPB_Aus2 | 0.30 | 0.46 |
| BYPB_Aus3 | –0.02 | 0.23 |
| CA_Aus3 | –0.11 | 0.11 |
| CA_Mex1 | 0.10 | 0.26 |
Experiments Aus1 and Aus2 were calculated using both nitrogen treatments.
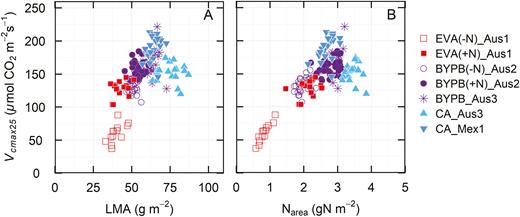
Vcmax25 as a function of (A) leaf mass area (LMA) and (B) nitrogen (Narea) for wheat genotypes grown in different environments and measured at different stages as described (see Fig. 1D, G, H). Symbols represent means of each genotype.
The derived trait, Vcmax25/Narea, was chosen to uncouple measurements of Vcmax25 from leaf N in order to reveal potential variation in photosynthetic N use efficiency. A large variation in Vcmax25/Narea was observed (Fig. 5), ranging from 26 to 107 μmol CO2 s−1 (g N)−1. The three most likely causes for this variation are: (i) different proportions of leaf N allocated to Rubisco; (ii) different kinetic properties of Rubisco; and (iii) different activation states of Rubisco. The analysis of genetic variation in this and other traits is dealt with below.
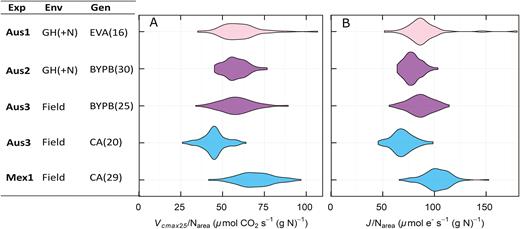
Violin plot representing the distribution of photosynthetic efficiency as (A) Vcmax25/Narea and (B) J/Narea of the genotypes by experiment, excluding low nitrogen treatments. Experiments were measured in Australia (Aus1, Aus2, and Aus3) and in Mexico (Mex1). Experiments were set up in different environments: glasshouse (GH) under normal nitrogen conditions (+N) or the field. Three different set of genotypes were assessed: Early Vigour set, EV; BUNYIP set, BYP; and CIMCOG set, C.
Photosynthetic diversity and heritability
The potential usefulness of all of the measured traits for breeding was explored by examining the genetic component of the variation observed in all experiments. Looking across experiments, Aus3_BYPB and Mex1_CA show the highest genetic variation (Fig. 6). Looking across traits, A showed the most consistent genetic differences of the single point traits, while Vcmax25/Narea showed the highest genetic differences amongst the modelled traits. Most of the leaf structure parameters had highly significant genetic variance in most experiments (Nmass, Narea, SPAD, and LMA; Fig. 6).
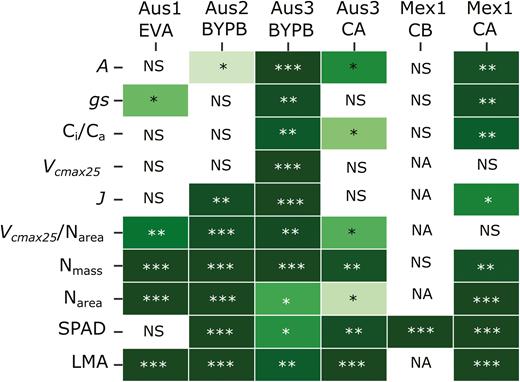
Significative genetic variance for traits measured in wheat for six different experiments. *P≤0.05; **P≤0.01; ***P≤0.001, NS, non-significant; NA, not available.
In Australia, heritability from Vcmax25, Vcmax25/Narea, and J was higher than for A, gs, and Ci/Ca (Fig. 7). In Mexico, this trend seems to be reversed and the single point traits had higher heritability than the modelled parameters (Mex1_CA; Fig. 7). The same set of genotypes measured in Australia at anthesis showed low heritability (Aus3_CA; Fig. 7). The trial Aus3_BYPB showed high genetic diversity (Fig. 6) and high heritability for A, Vcmax25, and J (~0.7; Fig. 7).
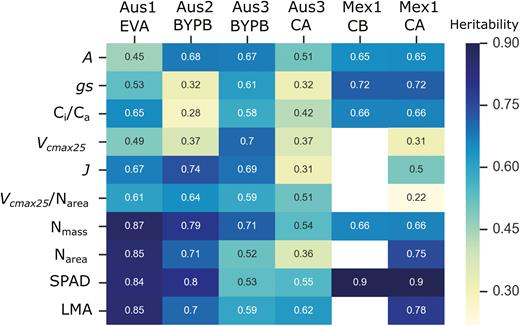
Broad-sense heritability for traits measured in wheat for six different experiments. Estimates not available in white space. See Fig. 1 for further description of experiments and traits.
The heritability of Vcmax and J/Vcmax, without standardizing Vcmax to 25 °C, was also analysed. The heritability of both traits in field experiments varied from 0.6 to 0.7. These values were not shown here because the confounding of variation in temperature (related to time of measurement) (Supplementary Fig. S1) could lead to an overestimation of genetic variance. In contrast, J seems to be less dependent on temperature (Supplementary Fig. S2). The heritability shown for J and Vcmax25 may better reflect genetic variation in Pc (Fig. 7).
The highest heritability was always observed with the leaf structural parameters in the glasshouse and in the field in Mexico (Nmass, Narea, SPAD, and LMA; Fig. 7).
A and Vcmax25 both showed high heritability in Australia (Aus2 and Aus3_BYPB). Interestingly, when measuring the same set of genotypes in the glasshouse and in the field at the same plant developmental stage (the BYP panel before anthesis), the genetic correlation for A, Vcmax25, and J was positive (Table 4). Additionally, Nmass, Narea, and SPAD also had high genetic correlations across the two environments (glasshouse versus field; Table 4). Since the BYP set is a collection of high yield genotypes from Australia, this observation holds promise that selection of high yielding genotypes with improved photosynthetic traits may be done in the glasshouse.
Genetic correlations between experiments for each trait
| Trait | GH versus field | Australia versus Mexico |
|---|---|---|
| A | 0.94 | –0.20 |
| gs | NA | –0.06 |
| Ci/Ca | NA | –0.06 |
| Vcmax | 0.13 | –0.07 |
| Vcmax25 | 0.67 | –0.05 |
| J | 0.63 | –0.40 |
| Vcmax25/Narea | –0.05 | 0.35 |
| J/Vcmax | 0.06 | –0.33 |
| Nmass | 0.83 | 0.52 |
| Narea | 0.70 | 0.99 |
| SPAD | 0.99 | 0.99 |
| LMA | 0.25 | 0.84 |
The first column of correlations is between experiment BYPB_Aus2(+N) grown in the glasshouse (GH) and BYPB_Aus3 grown in the field. The second column of correlations is between experiment CA_Aus3 grown in Australia and CA_Mex1 grown in Mexico.
NA, insufficient genetic variance for the calculation.
The C set, which is a collection of high yielding wheat genotypes selected in CIMMYT, was compared in two environments: in Mexico (Mex1) and in Australia (Aus3). The genetic correlations for gas exchange-derived photosynthetic traits differed between the two environments (Table 4). In contrast, there were strong and consistent genetic correlations for the leaf structural traits Narea, SPAD, and LMA (Table 4). Spatial and environmental variation therefore pose challenges for assessing physiological traits.
Discussion
Photosynthetic capacity and efficiency
Photosynthetic capacity and efficiency have been proposed as new traits essential to increase RUE and yield potential of cereal crops in breeding programmes (Parry et al., 2011; Furbank et al., 2019a). The major goal of this work was to identify useful, heritable component traits to provide germplasm screening strategies for photosynthetic capacity (Pc) and photosynthetic efficiency (Peff). The Farquhar et al. (1980) leaf-level photosynthetic model allows one to define the photosynthetic capacity of a leaf by its maximum Rubisco carboxylation activity, Vcmax, and rate of electron transport determined under high irradiance, J (von Caemmerer, 2000). These parameters have been incorporated into canopy models (e.g. GECROS, Yin and Struik, 2017; and APSIM, Wu et al., 2019) which allow an estimation of the impact on yield as a consequence of varying these two parameters under different agronomic scenarios. This canopy-level modelling has reinforced the importance of these two parameters in driving crop biomass and yield under field-relevant irradiance (Wu et al., 2019). Here we propose using the parameter Vcmax25 as a measure of Pc reflecting Rubisco carboxylation capacity. While electron transport capacity could also be used to characterize photosynthetic performance, correcting for temperature may be more problematic. There are two main rationales for proposing Vcmax25 as a metric for Pc. (i) Vcmax25 correlated well with Rubisco content determined with an in vitro assay (Fig. 2). This observation is in agreement with previous work with wheat (Evans, 1986) and in model plants where comparisons of Rubisco estimated in vivo with in vitro extracted activity in transgenic tobacco plants showed a coefficient of determination of 0.94 (von Caemmerer et al., 1994). (ii) While A is influenced by gs through Ci/Ca, Vcmax25 is independent of gs unless plants are severely droughted (von Caemmerer, 2000). When spot measurements of CO2 assimilation (A) are made, gs and A were highly correlated in this study (Table 2), consistent with many literature observations (Roche, 2015). This tight relationship between A and gs is not desirable for genotype screening of CO2 assimilation capacity, since gs in plants varies greatly with the environment and diurnally (Turner, 1991), leading to an underestimation of ‘potential’ photosynthetic performance (Condon et al., 2004). In this respect, Vcmax25 is theoretically more robust and less vulnerable to water availability of soil water, for example, and pre-conditioning due to the light environment.
The potosynthetic electron transport rate, J, modelled from gas exchange or chlorophyll fluorescence, is also promising as a metric for photosynthetic capacity. Significant genetic variation was detected in wheat (Fig. 6). Similar results were found in Brassica rapa, where J showed strong genotypic differentiation (Pleban et al., 2018).
While the photosynthetic rate could be increased by raising levels of photosynthetic proteins, it is often not agronomically, economically, or environmentally desirable to increase inputs of nitrogenous fertilizers to achieve this. Large increases in N application contributed to the ‘green revolution’ over the previous decades, but it would be more desirable if future yield improvement could be achieved from increasing the photosynthetic rate per unit of leaf N (Evans and Clarke, 2019). For this reason, we also evaluated Vcmax25/Narea, termed Peff, because it may separate Rubisco kinetic performance from N content in leaves and provide an indication of genetic variation in allocation of leaf N preferentially to photosynthetic proteins (Figs 3, 4). In previous studies, photosynthesis and carboxylation efficiency in wheat showed a positive relationship with N, but also a wide variation at high leaf N levels (Evans, 1983, 1989; Evans and Seemann, 1984). Better Rubisco carboxylation efficiency can be expressed as a higher CO2 assimilation rate for a given N investment in Rubisco (Carmo-Silva et al., 2015). This could arise from either a greater specific activity of the enzyme or the Rubisco having a greater activation state. The activation state of Rubisco has been found to decrease in leaves with greater Rubisco contents (Carmo-Silva et al., 2017) and this may be contributing to the decline in apparent specific activity with greater Rubisco contents observed here (Fig. 2). Photosynthetic efficiency, Vcmax25/Narea, for the CA set was higher in Mexico (Mex1) than in Australia (Aus3) (Fig. 5). While the allocation of N in Rubisco is not known in these two environments, it suggests that Vcmax25/Narea could potentially be improved in Australia. Further research is needed to improve our understanding of the mechanisms underpinning variation in photosynthetic efficiency in wheat.
Heritability of photosynthetic traits for breeding
A breeding strategy for photosynthetic performance requires highly heritable traits for both selection of superior germplasm and identification of genomic regions and new gene candidates or single nucleotide polymorphisms (SNPs) for genome selection models. We observed a relatively high heritability for A and gs in Australia and in Mexico after anthesis (from 0.32 to 0.72; Fig. 7). Similar broad-sense heritabilities (0.31–0.76) have been reported for A and gs in wheat grown in the UK (Carmo-Silva et al., 2017) where the challenges of field-based gas exchange were also noted. While the close relationship between A and gs can be viewed as an obstacle to photosynthetic screening, it also offers an opportunity to use genotypic differences in gs under well-watered conditions as a surrogate for A or indeed depression of canopy temperature as a surrogate for gs and A (Fischer et al., 1998; Pinto et al., 2010; Deery et al., 2016; Fischer and Rebetzke, 2018).
Unlike the published work on A and gs, there is very little information available on the utility of modelled biochemical parameters such as Vcmax and electron transport rate (J) for wheat breeding. This is undoubtedly due to the laborious nature of determining the response of assimilation to CO2 concentration in many leaves in the field. We recently reported a method based on machine learning and leaf hyperspectral reflectance which could predict photosynthesis-related parameters in wheat leaves (Silva-Perez et al., 2018). This approach has now been extended to develop predictive algorithms for wheat leaf respiration (Coast et al., 2019). In the current work, Vcmax25 is shown to be a heritable, robust measure of Pc and it was demonstrated that there is genetic diversity when normalized for leaf N (Narea); Vcmax25/Narea (Figs 5, 6). The maximum heritability for Vcmax25 or Vcmax25/Narea was 0.7 and 0.64, respectively, in different experiments (Fig. 7). In a UK study, heritability of Vcmax in wheat was ~0.51 (Carmo-Silva et al., 2017). The heritability of Vcmax25 differed markedly between trials (Fig. 7). Low heritability for plants grown in the glasshouse (Aus2_BYPB) could be due to having few replicates (Table 1). The number of repetitions was greater for the field trial (Aus3_BYPB). Interestingly, Vcmax25/Narea had a high and similar heritability in both environments (0.64 and 0.59). The current heritability values are encouraging, and it is promising that getting more measurements in the field during the wheat cycle using high-throughput techniques (Furbank et al., 2019b; Rebetzke et al., 2019) may improve heritability estimates for these traits.
The case for a positive impact of improved photosynthetic performance on wheat yields has been well developed (reviewed in Parry et al., 2011), and data on historical collections of germplasm suggest that this trait may have been under inadvertent selection (Reynolds et al., 2011). Positive relationships between Rubisco activity and grain yield have also been reported (Murthy and Singh, 1979). However, no significant correlation between Vcmax25 or Vcmax25/Narea and yield was found either in this work (Supplementary Table S6, although yield was only measured in one experiment of this study) or in Carmo-Silva et al. (2017). Positive relationships between A and yield have been reported (Reynolds et al., 1994, 2000; Fischer et al., 1998; Tang et al., 2017), but contrasting results have been obtained in high-yielding cultivars (Brinkman and Frey, 1978; Murthy and Singh, 1979; Gifford and Evans, 1981; Sadras et al., 2012).There are a number of reasons which may explain this lack of correlation. First, the major rationale of breeding for improved RUE in cereals is the apparent ‘exhaustion’ of potential gains in harvest index (see Parry et al., 2011). Because many of the gains in yield in the previous two decades have been from these ‘green revolution’ partitioning targets, the effect of improved photosynthetic performance and biomass could easily be masked by variation in phenology and harvest index when a diverse set of germplasm is examined. Such confounding effects may be removed if a larger germplasm set were to be examined and the confounding effects included in a linear model. While spatial statistical analysis was included here using linear models, phenology and harvest index were not recorded or included.
Secondly, the developmental stage at which photosynthetic traits were measured was constrained by being able to examine an easily identified leaf at a given developmental stage. Flag leaf at or around flowering is attractive for this reason but ignores the contribution of Pc and Peff by different leaf classes. It is unknown whether the ranking of genotypes for photosynthetic performance would be the same if other leaves had been analysed. Other ‘missing’ sources of photosynthetic products for yield production in this study include ear photosynthesis (Sanchez-Bragado et al., 2014) and stem carbohydrate remobilization of carbon fixed pre-anthesis (Asseng and van Herwaarden, 2003).
Chlorophyll content, SPAD, and leaf N
SPAD is a widely used optical tool for rapid non-destructive estimation of leaf chlorophyll and N content in the field as it is quick, light, and easy to use (Markwell et al., 1995; Lopez-Bellido et al., 2004). SPAD has also been proposed to identify lines with superior photosynthesis in wheat (Giunta et al., 2002). A disadvantage of this optical sensor is that SPAD values saturate at high chlorophyll (Debaeke et al., 2006). Despite this limitation and the potential for strong effects of growth environment and agronomy (primarily N supply), genetic correlation for SPAD was positive when measured in the glasshouse and field, and across the environments of Australia and Mexico (Table 4). Consistent SPAD readings have been observed before across genotypes and environments (Hamblin et al., 2014). Heritability values of SPAD from the current study were always positive, varying from 0.53 to 0.9 (Fig. 7). SPAD values have been shown to have a high correlation with yield in wheat (Tang et al., 2017) although it has been pointed out that this relationship varies between cultivars (Monostori et al., 2016). As stated above, yield was only measured in the Mex1 experiment here and there was no correlation between SPAD and yield. Interestingly, SPAD positively correlated with previously reported breeders’ yields in the UK (0.4) but not with grain yield from the experiment of Carmo-Silva et al. (2017). SPAD values have also shown correlations with biomass and vegetation indices in wheat (Babar et al., 2006), and have been used to predict N grain requirements although they need to be calibrated for different cultivars (Lopez-Bellido et al., 2004). Given the potential need for cultivar-specific calibration for N and chlorophyll, and the observations here that Rubisco levels and SPAD levels are not well correlated with leaf N at higher N levels (Supplementary Fig. S3), the use of SPAD to screen for Pc should be approached with caution.
The confounding effect of temperature on photosynthesis measurements
The most important challenge encountered measuring gas exchange and deriving modelled traits in the field in Mexico and Australia was dealing with temperature, which ranged from 23.5 °C to 32.6 °C (Supplementary Fig. S4). Vcmax showed a strong correlation with leaf temperature (Supplementary Fig. S1). To address this issue, Rubisco kinetic parameters were derived for wheat and the use of Vcmax25 was proposed as a way to deal with high temperatures in the field (Silva-Pérez et al., 2017). The use of Vcmax25 worked well for the genetic variation and heritability analysis done in this study. As Vcmax25 and J are calculated from the same A:Ci curve, one might argue that they are not independent and could show similar trends in genetic correlations (Supplementary Fig. S5). J was not normalized to 25 °C in these experiments because temperature response functions were not measured here in the different trials and one might expect temperature acclimation, as has been observed in other species (e.g. tobacco; Bernacchi et al., 2003; June et al., 2004; Silva-Pérez et al., 2017). J was less sensitive to temperature than Vcmax (Supplementary Fig. S2; June et al., 2004; Silva-Pérez et al., 2017) and there were no indications that J might be unreliable during the genetic variation and heritability analysis. Heritability of J was relatively high in Australia (Fig. 7) except in the C set of wheat genotypes, suggesting that high-throughput direct measurements of electron transport capacity in leaves may be worth pursuing using chlorophyll fluorescence sensors (Furbank et al., 2019a).
The ratio J/Vcmax represents the balance between electron transport and Rubisco capacity (von Caemmerer and Farquhar, 1981). In this project, J/Vcmax had a relatively high heritability, from 0.5 to 0.7. The high heritability may arise because the ratio was calculated without temperature correction, which overestimated the genetic variance. J/Vcmax was lower for measurements made in the field after anthesis when temperature increased (Fig. 1F). Higher values (~2) were observed for wheat cultivars in the UK (Driever et al., 2014; Carmo-Silva et al., 2017) where temperatures were cooler than growth conditions encountered in this project. In contrast, J/Vcmax decreased with decreasing growth temperature in cold-tolerant species (Yamori et al., 2010).
Improving photosynthesis has become a major breeding target to increase biomass and yield in wheat (Reynolds et al., 2012; Evans, 2013; Furbank et al., 2015, 2019a). Here we show the potential utility of a number of modelled photosynthesis-related traits as heritable breeding tools for two of the components of RUE in wheat which we term Pc and Peff. Combining these traits with high-throughput measurement techniques and sequenced/mapped germplasm collections should provide cereal breeders with tools to build their genome selection strategies or to screen directly to accelerate rates of genetic gain for radiation use efficiency.
Supplementary data
Supplementary data are available at JXB online.
Table S1. List of wheat genotypes used for the EV set.
Table S2. List of wheat genotypes used for the BYP set.
Table S3. List of wheat genotypes used for the C set.
Table S4. Model terms for each analysis.
Table S5. Genetic and phenotypic correlations of electron transport rate from gas exchange (J) with chlorophyll fluorescence measured in experiment CA_Mex1.
Table S6. Phenotypic correlation of yield with Vcmax25, Vcmax25/Narea, and J measured before anthesis (88–103 DAE) from the Mex1 experiment (CA_Mex1).
Fig. S1. Variation of Vcmax without temperature correction in relation to leaf temperature and time.
Fig. S2. Variation of J without temperature correction in relation to leaf temperature and time.
Fig. S3. SPAD as a function of Vcmax25 and J for wheat genotypes grown in different environments and measured at different stages.
Fig. S4. Leaf temperature extracted from LI-6400XT for wheat plants measured in the glasshouse (Aus1 and Aus2) and in the field (Aus3 and Mex1).
Fig. S5. Genetic correlations for all experiments for the assimilation rate, stomatal conductance, the ratio of internal to atmospheric CO2 concentration, velocity of carboxylation at 25 °C, electron transport rate, leaf mass dry per area, leaf nitrogen concentration, leaf nitrogen per area, and SPAD as a surrogate of chlorophyll content.
Acknowledgements
VS-P received a PhD scholarship from CONACYT, Mexico (207607), the Australian Government through the Australian Research Council Centre of Excellence for Translational Photosynthesis (CE140100015), and The Australian National University. The project was supported by the Sustainable Modernization of Traditional Agriculture (MasAgro) initiative from the Secretariat of Agriculture and Rural Development (SADER) and the International Maize and Wheat Improvement Center (CIMMYT). We acknowledge access to glasshouse and field experiments in Australia by the Commonwealth Scientific and Industrial Research Organisation (CSIRO) supported by Grains Research & Development Corporation (CSP00168). Thanks to Nur Abdul Bahar for her support during gas exchange measurements in Australia, to Ari Verbyla for his support in statistical analyses, and to Tony Fischer and Richard Richards for inspiring discussions.

Comments