


Abstract
Laboratory tests are an integral part of the diagnosis and management of patients; however, these tests are far from perfect. Their imperfections can be due to patient health condition, specimen collection, and/or technological difficulty with performing the assay and/or interpretation. To be useful clinically, testing requires calculation of positive predictive values (PPVs) and negative predictive values (NPVs). During the current global pandemic of COVID-19 (coronavirus disease 2019), multiple assays with unknown clinical sensitivity and specificity have been rapidly developed to aid in the diagnosis of the disease. Due to a lack of surveillance testing, the prevalence of COVID-19 remains unknown. Hence, using this situation as an clinical example, the goal of this article is to clarify the key factors that influence the PPV and NPV yielded by diagnostic testing, By doing so, we hope to offer health-care providers information that will help them better understand the potential implications of utilizing these test results in clinical patient management.
Laboratory tests are an integral part of diagnosis and patient management. Health-care providers have come to rely profoundly on the results of those tests.1,2 However, laboratory tests are far from perfect. Imperfections can be inherent to the assay, such as being technologically difficult to perform or interpret. Also, interferences can occur due to patient health condition (such as intravascular hemolysis, icterus, and/or lipemia) or from improper specimen collection and/or processing. Assays are often characterized with respect to their analytical sensitivity and specificity, or their performance in correctly identifying the presence or absence of disease in a set of known, or standardized, controls. However, clinical sensitivity is defined as the ability of the test to correctly identify the patients with disease (ie, Pr[Positive test | Disease]), and clinical specificity is the ability of the test to correctly identify the patients without disease (ie, Pr[Negative test | No Disease]).3 Many of these test are performed for diagnostic purposes; thus, the clinical team also seeks to answer the question, “What is the probability of the patient having this disease, given the positive test result (ie, Pr[Disease | Positive test]?” or conversely, “What is the probability the patient is free of disease, given a negative test result (ie, Pr[No Disease | Test negative]?” The answers to these more-relevant clinical questions requires the calculation of the positive predictive value (PPV) and negative predictive value (NPV), which rely not only on features related to the performance of the laboratory test but also on the prevalence of the disease in a given population (which is defined as the proportion of the population of interest who has the disease).3,4 Let us denote sensitivity as x, specificity as y, and prevalence as p; using the Bayes theorem, the PPV (as f) and NPV (as g) can be calculated as follows:
Recently, there has been a global pandemic of COVID-19 (coronavirus disease 2019), due to severe acute respiratory syndrome coronavirus 2 (SARS-CoV-2). Multiple assays (point of care [POC] devices and those requiring more-sophisticated laboratory instrumentation) have been rapidly developed to aid in the diagnosis of COVID-19. At this time, many of these laboratory developed tests have unreported clinical sensitivity and specificity.5 Further, the true prevalence of this disease is unknown, not only as a result of the different performance characteristics of the wide variety of tests being utilized but also due to physical limitations in the availability of testing.6 Therefore, using diagnostic tests for COVID-19 as an example, the goals of this study are to understand the key factors that influence the PPV and NPV of a diagnostic test; and to offer health-care providers a better understanding of the impact of prevalence, sensitivity, and specificity of the PPV and NPV; as well as the potential implications of utilizing these test results in the management of patients. These goals are particularly crucial during the current pandemic, in which testing is extremely important but yet difficult to interpret, given so many unknown factors.
Relationship between PPV or NPV and Sensitivity, Specificity, and Prevalence
➢ Property 1: Holding sensitivity and specificity constant, as more people are infected (ie, prevalence is increased), the effect of prevalence on the rate of increase of PPV diminishes, while its effect on the rate of decrease of NPV increases (assumed a positive Youden index for the diagnostic test)
To investigate this property mathematically, we examined the effect of prevalence on PPV and NPV while keeping sensitivity and specificity constant. Based on this assumption, we were able to show mathematically that if the Youden index (J, which is defined as ) is ≥0, as the prevalence increases, the PPV also increases at a slower rate (ie, the effect of diminishing of return; Supplemental information section 1). We did not consider tests for clinical use with a negative Youden index because such tests are misleading (and not clinically helpful).4 However, the NPV plummets at an increased rate when the prevalence increases (supplemental information section 4). Clinically, this finding suggests that if the prevalence is relatively low, a positive test result is more likely to be a false-positive result, and when the prevalence is high, a negative test result is more likely to be a false-negative result. Thus, it takes extraordinary effort to design an assay that has good PPV when the disease prevalence is low (or conversely, a good NPV when disease prevalence is high; Supplemental Figure S1). Further, this finding suggests that the prevalence drives significant improvement in PPV at lower values of prevalence and significant reduction in NPV at higher values of prevalence (Supplemental Figure S1).
➢ Property 2: Holding prevalence and specificity constant, as the sensitivity of the assay increases, its effect on the rate of increase of PPV diminishes while its effect on the rate of increase of NPV increases.
To investigate this property, we examined the effect of sensitivity on PPV and NPV while keeping other variables (namely, prevalence and specificity) constant. Mathematically, we demonstrated that as the sensitivity increases, the PPV increases but it increased at a decreasing rate (ie, the effect of diminishing returns, Supplemental information section 2). However, when the sensitivity increases, the NPV also increased at an increasing rate (Supplemental information section 5). Clinically, these observations suggest that improving on the sensitivity of an assay beyond a certain value may not yield the significant clinical benefits in PPV, as one might expect if the relationship is linear (Supplemental Figure S2). Further, given that NPV is a convex function regarding sensitivity, any small increase in sensitivity could yield a bigger corresponding increase in NPV (Supplemental Figure S2); this effect is more pronounced at higher prevalence values.
➢ Property 3: Holding prevalence and sensitivity as constant, as the specificity of the assay increases, its effect on rate of increase of PPV grows larger, while its effect on the rate of increase of NPV grows smaller
To investigate this property, we examined PPV and NPV as a function of specificity when the prevalence and sensitivity are kept constant. We were able to show mathematically that as the specificity increases, the PPV also increases, and it is increasing at an accelerating rate (Supplemental information section 3). However, we observed the effect of diminishing returns with the NPV—as the specificity increases, the rate of increase of the NPV is greatest at lower specificity values and, subsequently, the rate decreases (Supplemental information section 6). Clinically, these results suggest that with a given prevalence, especially when it is low, an increase in the specificity of the assay beyond a certain cutoff may not offer significant clinical benefit in terms of ruling out the disease (ie, the NPV; Supplemental Figure S3). However, given the convex function of PPV regarding specificity, any small increase in the specificity may yield a bigger increase in PPV (Supplemental Figure S3), especially at greater specificity values.
Discussion
As seen earlier herein, PPV and NPV are functions of prevalence, sensitivity, and specificity. Depending on the clinical scenario, an assay with good PPV or NPV may be preferred. For example, if a test is utilized to rule in a disease, as would be desirable in the setting of a known or ideal/effective treatment, or for a disease with significant morbidity/mortality, then a very high PPV may be preferable. Using a more relevant example in this pandemic, if a test is utilized to rule in an immunologic response or exposure, then a very high PPV may be preferable. However, if it is more desirable to design a test optimized to rule out a disease, as might be desired when isolation for the sake of public safety may be involved, then a test with a very high NPV may be preferred.
Currently, with the global pandemic of COVID-19, many of the diagnostic tests employed have variable clinical sensitivity and specificity, and even the availability of testing is limited and or being performed only in targeted populations; as such, the true prevalence of the disease is unknown. These unknowns can complicate the clinical interpretation of positive (or negative) test results. Specifically:
➢For a low disease prevalence, as in the example of 5% prevalence, the sensitivity does not play a significant role in the PPV or the NPV (Figure 1A and Figure 1B). Conversely, the specificity is of critical importance and it must be very high (almost close to 100%) to achieve a clinically meaningful PPV (Figure 1A). The PPV decreases dramatically with a small decrease in specificity. Thus, having a highly specific assay for serological testing for COVID-19 is extremely important when the disease prevalence is low. However, at low prevalence, neither the sensitivity nor the specificity (as long as the specificity is approximately >0.4 in this example) has a major effect on the NPV (Figure 1B). Thus, if the result is negative, it is more likely to be a true-negative result. Thus, improvements in sensitivity and specificity (if specificity is approximately >0.4) do not lead to significant benefit in NPV. In this scenario, the effort should be focused on developing a very high specificity assay to achieve good PPV.
➢For a relatively high disease prevalence, as in the example of 95% prevalence, neither the sensitivity (if sensitivity is approximately >0.4) nor the specificity plays a significant role in determining the PPV (Figure 2A). Good sensitivity (almost close to 100%) is necessary to obtain any meaningful NPV (Figure 2B). Thus, in this clinical scenario, the effort should be focused in developing a very highly sensitive assay.
➢For a disease that has prevalence that is neither high nor low, sensitivity tends to drive the PPV (Figure 3A) and specificity tends to drive the NPV (Figure 3B). Depending on the clinical intention of the assay, focus can be directed at improving the sensitivity or the specificity of the assay.
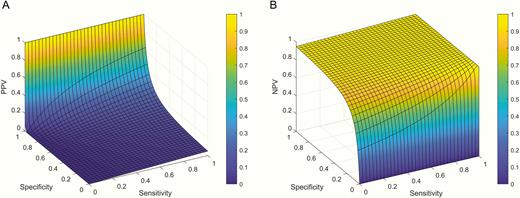
Positive predictive value (PPV) and negative predictive value (NPV) as a function of sensitivity and specificity when the prevalence of the disease is 5%. A, As seen in this graph, specificity is the most important factor in the PPV when the disease prevalence is low. The PPV almost does not change significantly across the range of sensitivities of the assay. Nevertheless, the specificity must be close to 100% to obtain good PPV, and its effect on PPV is exponential (ie, small decrease in specificity leads to very large decrease in PPV). B, When the disease prevalence is low (5% in this example), sensitivity and specificity (as long as specificity is approximately >0.4) do not have a major effect on NPV.
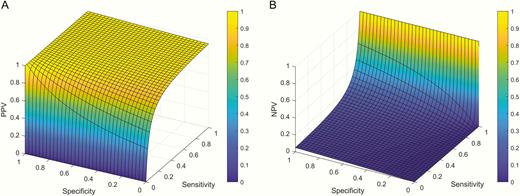
Positive predictive value (PPV) and negative predictive value (NPV) as a function of sensitivity and specificity when the prevalence of the disease is 95%. A, When the disease prevalence is high, sensitivity (as long sensitivity is approximately >0.4) and specificity do not have a major effect on PPV. B, As seen in this graph, sensitivity is the most important factor in the NPV when the disease prevalence is high (95% in this example). The NPV almost does not change significantly across the range of specificities of the assay. Nevertheless, the sensitivity must be close to 100% to obtain good NPV, and its effect on NPV is exponential (ie, small decrease in sensitivity leads to large decrease in NPV).
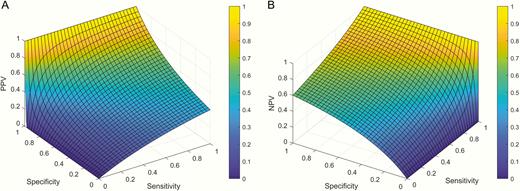
Positive predictive value (PPV; part A) and negative predictive value (NPV; part B) as a function of sensitivity and specificity when the prevalence of the disease is 40%.
Therefore, it is important to interpret the results of any assay in conjunction with the clinical information, especially when the factors are unknown, such as in the current COVID-19 pandemic. Future directions include the use of mathematics to find the range of sensitivity and specificity to achieve optimal PPV or NPV once a better prevalence of the disease is known, as well as performing simulations to study the impact of uncertainties in these variables on diagnostic measures and infection control during the COVID-19 pandemic.
Personal and Professional Conflicts of Interest
H.P.P. is a consultant for Sanofi Genzyme and a speaker for Alexion Pharmaceuticals, Inc. C.H.K. is a consultant at Stratevi. All other authors declare no conflict of interest.
Abbreviations
- PPV
positive predictive value
- NPV
negative predictive value
- COVID-19
coronavirus disease 2019
- SARS-CoV-2
severe acute respiratory syndrome coronavirus 2
- POC
point of care
