


Abstract
Point of care (POC) testing is rapidly evolving. POC testing is often managed by POC coordinators (POCC), but this role is relatively new and has not been characterized.
To characterize the background, responsibilities, and job satisfaction of POCCs.
Structured interviews were conducted with 15 POCCs. On the basis of these interviews, a 38-item questionnaire was developed and administered as a web-based survey.
The respondents (N = 98) were mostly female (87%) and had a bachelor’s degree (79%). About half the respondents were older than 55 years and were in supervisory positions. Overall, respondents indicated high job satisfaction, but women were significantly less satisfied than men. POCCs were infrequently involved in decisions regarding the implementation of new tests. The number of tests managed by each POCC varied widely (median, 6.0; range, 1–30).
The POCC role is in flux. There is consensus regarding some aspects of the job, but there are significant differences in the way that hospitals organize the POCC function.
Point of care testing (POCT) refers to testing performed at the time of clinical encounters. This may occur in the office of a physician or other settings, such as the emergency department, intensive care unit, or a remote location. POCT enables physicians to make decisions at the time of a visit. Faster decisions can improve patient care and provide convenience for patients and physicians. Because of these benefits, the demand for new and improved point of care (POC) tests is high.1–3 POC testing is rapidly evolving and is a source of constant innovation. Only a few decades ago, POC testing was limited to a few tests. Now, dozens of tests are available, and the number of tests is rapidly growing.
Management of POC testing is challenging. First, there are more tests to manage than previously. Second, POC testing is highly regulated. As with laboratory testing, POC testing is regulated by the Clinical Laboratory Improvement Amendments of 1988 (CLIA), and these regulations are enforced by the Centers for Medicare & Medicaid Services (CMS). The regulatory requirements are complex; also, because of innovation in the field, requirements are constantly in flux.
When POC testing was first introduced, tests were managed by the clinical departments that performed the tests. As testing evolved and became more complex (more tests and regulatory requirements), it became apparent that POC testing should be managed by specialists with a knowledge of laboratory testing (validation, quality control) and an understanding of regulatory requirements. This realization led to the creation of point-of-care coordinator (POCC).4,5
Little is known about POCCs. Because of rapid growth and innovation in POC testing, management practices associated with POC testing have not been standardized. Thus, there is wide variation in the role of POCCs. Variation in management practice could have a significant effect on the effectiveness of POCCs and their satisfaction with their roles. Given the shortage of qualified laboratory personnel in the United States, it is important to understand the factors that affect POCC job satisfaction. Such knowledge could improve job design and lead to improved recruitment and retention of POCCs.
The objective of this study was to characterize the role of POCCs. What kind of training do they have? How are they managed? What are their responsibilities? What factors influence their job satisfaction? To that end, we conducted a national survey of POCCs to improve our understanding of this relatively new and important role.
Methods
We developed a survey using a 2-stage process. Our goal was to create a survey that would provide a broad overview of the experience of POCCs. To begin, we conducted structured interviews with 15 POC specialists. The POC specialists were drawn from 15 different organizations located around the United States; these individuals represented academic, government, and private organizations. Interviewees were not selected on the basis of specific tests or test volumes. The only requirement was that the interviewee had to be employed as a POCC or manager. The structured interviews covered a range of topics, such as the challenges that POCCs commonly experience, sources of job satisfaction or dissatisfaction, job roles, organization of the POCT function, job descriptions, and the topics they would like to see covered in a national survey. The average interview lasted 1 hour.
The interviews enabled us to develop themes that were important to POCCs. Based on these interview responses, we developed a 38-item questionnaire (Appendix 1). The survey contained questions related to demographic and organizational characteristics, technological and supervisory support, and job satisfaction. We used a Likert type scale (scale of 1 to 5, with 1 considered “strongly disagree” and 5 being “strongly agree”) to assess job satisfaction. These job-satisfaction questions covered attitudes regarding day-to-day tasks and aspects of the POCC role, such as autonomy, internal support, external support, and expectations.
A web-based survey was implemented using Qualtrics survey software (Qualtrics), and a link to the survey was emailed to members of the American Association of Clinical Chemistry (AACC) who had registered with the POC-testing interest group. In addition, we posted a public announcement and link to the survey on a POC-group site server (http://poct.groupsite.com/main/summary). These lists contained contact information for 600 active POC specialists. The survey was open to participants for 4 weeks, with reminders posted midway through the open period and during the final week.
We calculated an overall job satisfaction score by averaging the mean scores for of 8 of the Likert-scale questions. Differences between groups were assessed using χ2 testing for categorical variables and the Kruskal-Wallis rank sum test for continuous variables that were not normally distributed. P values less than .05 were considered statistically significant. All data analyses were completed using Microsoft Excel, version Microsoft Excel 2016 (Microsoft Corporation), and R statistical software. Approval and permission for the study was granted by the University of Utah Institutional Review Board (IRB 00103600).
Results
Structured Interviews
We interviewed 15 POC specialists throughout the country; 11 of the interviews took place over the phone, and 4 were completed via email. Many of the interviewees questioned the accuracy of POC tests. All of the interviewees expressed doubts about a test that they had personally managed. All interviewees mentioned problems with clinical-staff compliance, and many respondents mentioned that they had difficulties working with clinical staff.
Characteristics of participants
A total of 111 from the 600 invited individuals accessed the survey during the 4-week period. Of these, 6 participants were excluded from the survey because they did not work in the health-care or laboratory field. An additional participant was removed because that person did not manage POC tests. Of the 103 remaining participants, 98 completed the survey. Thus, the overall response rate was approximately 16% (98/600). Most of the participants were female (87%), had a bachelor’s degree (79%), and had more than 4 years of work experience (78%) (Table 1). About half of all participants were aged 55 years or older and were in supervisory positions. Most participants had a Medical Technologist (MT) certification. Almost half (46%) of the participants had more than 10 years of experience and earned between $60,000 and $80,000 per year (41%). Supervisors had 1.3 certifications on average, 51% had more than 10 years of experience, and 36% reported salaries higher than $80,000 per year.
Characteristics of Study Populationa
| Characteristic | Overalla | Supervisory Position | ||
|---|---|---|---|---|
| Yes | No | P Value | ||
| No. (%) (n = 98) | No. (%) (n = 55) | No. (%) (n = 43) | ||
| Age, y | .30 | |||
| 25–34 y | 7 (7) | 2 (4) | 5 (12) | |
| 35–44 y | 18 (18) | 13 (24) | 5 (12) | |
| 45–54 y | 24 (24) | 12 (22) | 12 (28) | |
| 55–64 y | 41 (42) | 25 (45) | 16 (37) | |
| 65 years and older | 5 (5) | 2 (4.0) | 3 (7) | |
| Not available | 3 (3) | 1 (2.0) | 2 (5.0) | |
| Sex | .30 | |||
| Female | 85 (87) | 46 (4) | 39 (91) | |
| Education | .40 | |||
| Associate’s degree or some college | 7 (7) | 5 (9) | 2 (5.0) | |
| Bachelor’s degree | 77 (79) | 41 (74) | 36 (84) | |
| Postgraduate degree | 14 (14) | 9 (16) | 5 (12) | |
| Certificationb | .86 | |||
| Medical Laboratory Technician | 15 (15) | 10 (18) | 5 (12) | |
| Medical Technologist | 78 (80) | 47 (85) | 31 (72) | |
| Medical Laboratory Scientist | 21 (21) | 14 (25) | 7 (16) | |
| Other | 13 (13) | 7 (13) | 6 (14) | |
| Annual salary | .06 | |||
| Less than $60,000 | 22 (22) | 9 (16) | 13 (30) | |
| $60,000–80,000 | 40 (41) | 23 (42) | 17 (40) | |
| More than $80,000 | 27 (28) | 20 (36) | 7 (16) | |
| Not available | 9 (9) | 3 (5) | 6 (14.0) | |
| Years of experience (mean [SD])c | .08 | |||
| < 4 y | 22 (22) | 9 (16) | 13 (30) | |
| 4–10 y | 31 (32) | 18 (33) | 13 (30) | |
| >10 y | 45 (46) | 28 (51) | 17 (40) |
aPercentages may not total 100 because of rounding.
bP <.05 between groups.
cP <.10 between groups.
Organizational characteristics
Almost all of the health care organizations provided inpatient and outpatient care (96.1%), and most organizations managed POCT at several different locations (82.2%) (Table 2). Approximately two-thirds (62%) of the organizations were accredited by more than 1 agency. Most organizations were accredited by the College of American Pathologists (CAP) or The Joint Commission (TJC). Most of the participants were from private hospitals (54%) with between 101 and 500 beds (55%). Most hospitals supported several levels of POC-test complexity; however, moderate-level complexity was the most common (85%).
Characteristics of Organization
| Characteristic | Respondents, No. (%)a |
|---|---|
| Organization typeb | |
| Academic | 16 (15.8) |
| Government | 6 (5.9) |
| Private | 54 (53.5) |
| Other | 25 (24.7) |
| Type of carec | |
| Inpatient | 1 (1.0) |
| Outpatient | 3 (2.9) |
| Both | 98 (96.1) |
| Multiple locationsb | |
| Yes | 83 (82.2) |
| Capacityc | |
| 0–100 beds | 7 (6.9) |
| 101–500 beds | 56 (54.9) |
| More than 500 beds | 38 (37.2) |
| Don’t know | 1 (1.0) |
| Accrediting agencyd | |
| CAP | 78 (78.0) |
| COLA | 7 (7.0) |
| TJC | 69 (69.0) |
| Other | 8 (8.0) |
| Highest complexity leveld | |
| Waived | 4 (4.0) |
| PPM | 3 (3.0) |
| Moderate | 85 (85.0) |
| High | 8 (8.0) |
CAP, College of American Pathologists; COLA, Commission on Office Laboratory Accreditation; TJC, The Joint Commission; PPM, provider-performed microscopy.
aPercentages may not total 100 because of rounding.
bn = 101.
cn = 102.
dn = 100.
Job responsibilities
POCCs showed wide variation in the number of tests managed. The median ratio of POC tests to coordinators was 6:1 (range, 1–30). Almost all POC coordinators reported that they were responsible for training of new staff and for competency assessment (Table 3). Very few respondents reported that they had a significant role in decisions to implement new tests. Approximately half (52%) of the respondents believed that the budget and support for POC testing was adequate.
Characteristics of POCT in the Organizationa
| Characteristic | Responseb |
|---|---|
| Training of new users | |
| Demonstration/observation by self | 82 (84%) |
| Demonstration/observation by others | 64 (65%) |
| Online training | 46 (47%) |
| Vendor training | 31 (32%) |
| Other | 3 (3%) |
| Assessment of competency | |
| Demonstration/observation by self | 84 (86%) |
| Demonstration/observation by others | 83 (85%) |
| Online assessment | 67 (68%) |
| Other | 14 (14%) |
| POCT competency success | |
| Extremely successful | 43 (44%) |
| Somewhat successful | 48 (49%) |
| Neither successful nor unsuccessful | 3 (3%) |
| Somewhat unsuccessful | 4 (4%) |
| Extremely unsuccessful | 0 |
| Key decision maker(s) for new POC test | |
| POC coordinator or representative | 13 (13%) |
| POC director | 12 (12%) |
| POC committee | 24 (24%) |
| Laboratory department or director | 37 (38%) |
| Hospital or clinic administrator | 4 (4%) |
| Other | 6 (6%) |
| Don’t know | 2 (2%) |
| Adequate budget for POC | 51 (52%) |
| Yes | 27 (27%) |
| No | 20 (20%) |
| Don’t know | 0 |
| Adequate staff for POC | |
| Yes | 42 (43%) |
| No | 52 (53%) |
| Don’t know | 4 (4%) |
POCT, point of care testing; POC, point of care.
aMedian ratio of POC tests to POC coordinators (range), 6.0 (1.0–30.0).
bn = 98.
Technology support
Overall, respondents were satisfied with the middleware used in their organization. A total of 88% of respondents reported that they were extremely or somewhat satisfied with their middleware (Table 4). Most respondents reported that the training they received for their middleware was only “average” (33%) or “good” (39%). Only 7% reported their training as being excellent, and 13% reported it as being poor or very poor. In all surveyed organizations, software was managed by the POC coordinator or the information technology (IT) department.
IT Support and Satisfactiona
| Characteristic | Respondents, No. (%) |
|---|---|
| Level of satisfaction with middlewarea | |
| Extremely satisfied | 41 (44) |
| Somewhat satisfied | 41 (44) |
| Neither satisfied nor unsatisfied | 5 (5) |
| Somewhat unsatisfied | 6 (6) |
| Very unsatisfied | 0 |
| Satisfaction with IT trainingb | |
| Excellent | 7 (7) |
| Good | 38 (39) |
| Average | 32 (33) |
| Poor | 10 (10) |
| Very poor | 3 (3) |
| Did not receive training | 8 (8) |
| Management of middlewarec | |
| POC Coordinator | 54 (59) |
| IT Department | 37 (40) |
| Other | 1 (1) |
IT, information technology; POC, Point of Care.
aPercentages may not total 100 because of rounding.
bn = 93.
cn = 98.
dn = 92.
Job satisfaction
On average, respondents reported that they were satisfied with their jobs (mean score, 4.0/5.0; range, 2.8–5.0). The job satisfaction reported by female respondents was significantly lower than that reported by male respondents (4.0 vs 4.4, respectively; P <.01; Figure 1). The availability of adequate staffing and budget were positively associated with job satisfaction (Kruskal-Wallis test, P <.05). A total of 45% of respondents worked full time as a POCC. Most respondents worked in multiple roles. Working in a nonsupervisory role and working in multiple roles (eg, POCC coordinator and laboratory technician) were associated with lower job satisfaction but were not statistically significant.
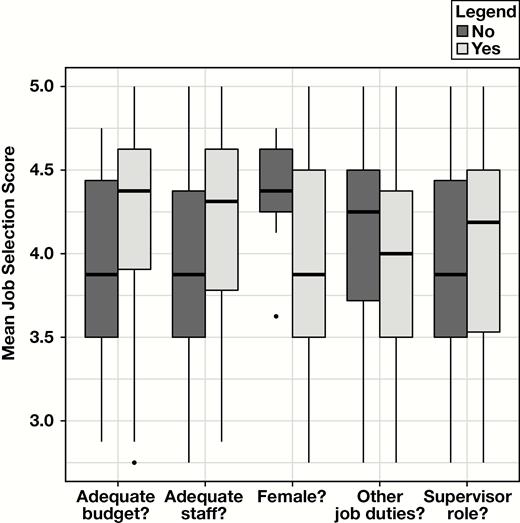
Results of survey of job satisfaction among point of care coordinators (POCCs).
Discussion
We conducted a national survey of POCCs to characterize their backgrounds, to learn about their job roles, and to obtain information about their job satisfaction. We discovered that most POCCs had a background in laboratory medicine (eg, a degree in medical laboratory science). This finding surprised us because having credentials as a medical laboratory technologist is not a requirement for the role of POCC and there is a national shortage of medical laboratory technologists. Given this shortage, it may be useful to consider whether assigning medical laboratory technologists to POCC roles is a good use of resources.
Part of the rationale for creation of the POCC role was to have a person doing this job who was familiar with testing practices and regulatory requirements. Moving these responsibilities from clinical personnel to designated specialists (POCCs) enabled organizations to develop expertise in managing POC testing. Centralizing POC management creates expertise because a POCC will manage many more tests than clinical personnel will. Also, POC testing is the main responsibility of POCCs but is a secondary responsibility for clinical staff.
Although the role of POCC makes intuitive sense, it is not clear that POCCs need to have the background of a medical laboratory technologist. It would be useful to compare the knowledge and skills required for a medical laboratory technologist and a POCC in future research and to think about the most efficient way to develop POCCs.
Is there a path to becoming a POCC without being a medical laboratory technologist? Our institution (University of Utah) has a pathway for individuals to become POCCs without a background as a medical technologist, medical laboratory technologist, or medical laboratory scientist. There are no educational requirements for management of waived tests. Individuals with a science or biology degree can perform moderately complex tests if those tests meet certain CLIA requirements.
We discovered that POCCs generally were satisfied with their work. We were somewhat surprised to learn this because the POCC role can be demanding due to high rates of innovation and changes in regulations. Among our survey participants, women were generally less satisfied than men. We speculated that dissatisfaction among women may be due to an imbalance in supervisory positions or other work factors, such as serving in multiple roles (ie, men hold more supervisory positions despite the fact that men are in the minority among POCCs, more men hold positions that do not require multiple roles). However, because the small sample of men, we were not able to demonstrate a statistically significant association.
We tested several potential determinants of job satisfaction (Figure 1). Although we found no statistically significant associations, the relationships were consistent with expectations. For example, it is not surprising that working in multiple roles adds to stress and leads to job dissatisfaction. Similarly, we expected inadequate budget and staffing levels to increase POCC dissatisfaction.
Many POCCs mentioned that they faced challenges working with clinical staff members. This finding may point to a need for professional development to improve communications, interpersonal skills, and system-based practice. Improvement in this area could increase job satisfaction among POCCs.
We were surprised to learn that POCCs were rarely involved in decisions regarding the implementation of new tests. In our experience, POCCs have a wealth of practical knowledge regarding workflows, interfaces, test environments, and other factors that are important for successful implementation.
Although the role of POCC is relatively new, we discovered that some aspects of the role were consistent for most respondents. For example, almost all POCCs were involved in training and competency assessment. This finding suggests that some consensus has developed regarding these roles. However, there were significant differences in the number of tests assigned to each POCC, whether middleware management was managed by POCCs (vs the IT department) and whether POCCs were fully devoted to POC or worked in multiple roles. The role of POCCs will continue to evolve, and it will be interesting to see what changes take place during the next decade. Although the role of POCC is evolving, it is clear that the underlying principle of creating specialists to manage POC operations has been beneficial.
Our study is limited because it was based on a convenience sample. The sample may not be representative because those who chose to respond may differ in some ways from the overall population of POCCs. We have no reason to suspect systematic bias, but this is always a risk with convenience samples. Although we had a fairly good response rate (16%) for an internet survey, a larger sample would have been helpful.
In conclusion, our study provides a description of the current role of POCCs. Although this role is relatively new, it appears to have become well-established.
Abbreviations
- POCT
point of care testing
- POC
point of care
- CLIA
Clinical Laboratory Improvement Amendments of 1988
- CMS
Centers for Medicare & Medicaid Services
- POCC
point of care coordinator
- AACC
American Association of Clinical Chemistry
- MT
Medical Technologist
- CAP
College of American Pathologists
- TJC
The Joint Commission
- IT
information technology
Acknowledgments
We thank David S. McClintock, MD (University of Michigan, Ann Arbor), for his contributions to the survey design and Daniel James (ARUP Laboratories) for internet implementation of the survey.
