


Abstract
Large genomes with elevated mutation rates are prone to accumulating deleterious mutations more rapidly than natural selection can purge (Muller’s ratchet). As a consequence, it may lead to the extinction of small populations. Relative to most unicellular organisms, cancer cells, with large and nonrecombining genome and high mutation rate, could be particularly susceptible to such “mutational meltdown.” However, the most common type of mutation in organismal evolution, namely, deleterious mutation, has received relatively little attention in the cancer biology literature. Here, by monitoring single-cell clones from HeLa cell lines, we characterize deleterious mutations that retard the rate of cell proliferation. The main mutation events are copy number variations (CNVs), which, estimated from fitness data, happen at a rate of 0.29 event per cell division on average. The mean fitness reduction, estimated reaching 18% per mutation, is very high. HeLa cell populations therefore have very substantial genetic load and, at this level, natural population would likely face mutational meltdown. We suspect that HeLa cell populations may avoid extinction only after the population size becomes large enough. Because CNVs are common in most cell lines and tumor tissues, the observations hint at cancer cells’ vulnerability, which could be exploited by therapeutic strategies.
Introduction
It is now generally accepted that somatic mutations promoting cell proliferation is the ultimate driving force of tumor evolution. In addition to the driver mutations, which provide cells a fitness advantage, mutations of no fitness consequences (or neutral “passenger” mutations) are believed to be common as well (Ling et al. 2015; Tao et al. 2015; Li et al. 2017). Intriguingly, the most common type of mutations in organismal evolution, namely, deleterious mutations (Li 1997), receives little attention in the cancer biology literatures despite the strong signal in cancer genome sequences (Wu et al. 2016). As aforementioned, the driver/passenger nomenclature excludes this class of mutations, which may be referred to as negative drivers (Wu et al. 2016). Although negative driver mutations may be several times more common than positive drivers among single nucleotide variants (SNVs; Wu et al. 2016), SNVs in coding regions occur rather infrequently, at no >0.01 per genome per cell division. In this study, we aim to detect deleterious copy number variation (CNV) mutations, which occur at a much higher rate than SNVs.
Under most circumstances, deleterious mutations are eliminated by natural selection shortly after their emergence and have little evolutionary consequences. However, there are cases that natural selection cannot purge the cells carrying deleterious mutations fast enough as they accumulate. The best-known circumstances are large genomes with high mutation rates, small population sizes, and in the absence of recombination (Muller 1964; Charlesworth 1978; Haigh 1978; Lynch and Gabriel 1990; Bachtrog and Gordo 2004). Human tumor cells meet all these conditions. First, the human cancer genomes, larger than those of most unicellular organisms, have correspondingly higher mutation rates per cell. Second, during the tumorigenesis the cell population size is usually very small (Wu et al. 2016; Chen et al. 2018). Lastly, recombination allows natural selection to operate efficiently in removing individual deleterious mutations. Somatic cells do not recombine and selection has to operate at the level of whole genome, thus, canceling out selection on deleterious and advantageous mutations of the same cell. This phenomenon is often referred to as the Hill–Robertson effect (Hill and Robertson 1966; Felsenstein 1974; Hartl and Clark 2007).
In populations of nonrecombining genomes, deleterious mutations will accumulate as no genome can reduce the mutation number via recombination. A population’s fitness peak is thus determined by its least loaded class; that is, the individuals (or cells) with the smallest number of deleterious mutations. Evolution does not reverse the accumulation of mutations and is compared with a ratchet mechanism (Muller 1964; Felsenstein 1974; Haigh 1978). When the least loaded class has one more deleterious mutation than in previous generations, it is said that Muller’s ratchet has advanced one notch (Gordo and Charlesworth 2000a; Charlesworth 2012). If the ratchet continues to advance, outpacing the ability of natural selection to reign in the mutation accumulation (MA), a possible consequence is the so-called mutational meltdown (Lynch and Gabriel 1990; Gabriel et al. 1993; Lynch et al. 1993) whereby the population would evolve to extinction.
Direct measurements of the effects of individual mutations in vivo are challenging. Nevertheless, an assessment of their collective action is possible, given a system that generates such variants at an appreciable rate. HeLa cells present such a system because it has been extensively cultured and exhibits a short doubling time and aggressive growth. In this study, HeLa cells are not used to reveal the process of tumorigenesis but mainly a model for addressing the underlying evolutionary forces, which needs to be powerful enough to be measured in laboratory settings.
We examined variation in growth rates among individual HeLa cells by monitoring clones from a common ancestral population. To interpret the variation, we performed whole genome sequencing of the clones. The genomic variation reveals that the growth rate is associated with the total length and number of CNVs. We perform computer simulations of cell growth to estimate deleterious mutation rate and the average fitness decrease per mutation. Our results suggest that human cells that have been cultured for a sufficiently long period of time still generate deleterious mutations in the form of CNVs at a high rate and a high-intensity level. For such systems, the operation of Muller’s ratchet leading to mutational meltdown might be plausible.
Results
Genetic Variation in Growth Rate in a HeLa Cell Population
To ensure genomic homogeneity of the initial population, we first established a HeLa cell line (E6) derived from an ancestral cell line (JF; supplementary fig. S1, Supplementary Material online). When E6 population size reached ∼5 × 10⁴ cells (after 15–16 divisions), five single-cell clones were generated from E6 and established in culture. When the clone cultures reached 106–107 cells, we measured cell proliferation rate of these clones using the MTT assay. The B8 and G3 clones proliferated faster than E3, E7, and G2, suggesting that cells within E6 were heterogeneous (fig. 1A). Because these clones were all descendants of E6, which originated from a single cell and experienced only 15–16 divisions, our results indicate that heterogeneity in cell growth can be generated in a very short period of time in cancer cells.
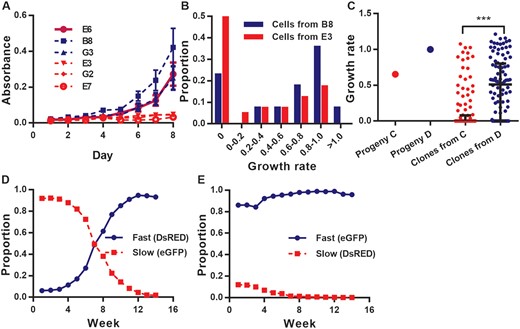
Growth rate, survival rate and fitness of fast- and slow-growing cells. (A) Growth graphs of five descendant clones (B8, G3, E3, E7, G2) and the ancestral clone (E6). The mean MTT assay read-out (the values of absorbance, y-axis) taken from day 1 to day 8 were plotted for each clone (8–12 replicates). Blue, red, and magenta lines represent growth graphs of fast, slow, and ancestral clones, respectively. Error bars represent 95% confidence interval. (B) Proportion of progeny with different growth rates. The growth rates of 39 B8 (red) and 40 E3 (blue) single cell progeny were monitored and calculated for seven days. The growth rates were represented by the slope value that calculated based on cell number counting from 7 days’ cell culture (see Materials and Methods). (C) Growth rate of one slow- (C; red) and one fast- (D; blue) growing descendant of B8 and its single-cell clones. Average growth rate of the cell clones from D (blue dots) is significantly higher than that of the clones from C (red dots) (P-value = , KS test). (D and E) Competition assay between slow- and fast-growing cells. The proportion (y-axis) of fast- (blue) and slow-growing (red) cells in a mixed population was measured from week 1 to week 8 (x-axis) by flow cytometry.
To test whether variation in growth rates among clones is heritable, we isolated 39 cells from B8 (fast-growing clone) and 40 cells from E3 (slow-growing clone), and monitored their growth from a single cell for seven days. Approximately 23% of B8 and 50% of E3 cells died out within seven days (supplementary fig. S2, Supplementary Material online), due to either damage caused during cell isolation or genetic defects. Furthermore, most cell lines with growth rates < 0.6 died within 2 months. Thus, only 60% of B8 and 27% of E3 cells survived for more than two months.
Whereas the growth rates of cells from a single origin varied greatly, the progeny of the fast-growing clone (B8) grew faster on average than those of the slow-growing clone (E3; fig. 1B;P-value = 0.004, KS test). Mean cell number among the B8 progeny was 62.0 at day 7, whereas it was 17.3 among E3-derived cell lines at the same time. The estimated heritability was 0.24 (P-value = 0.003), implying a significant genetic contribution to the growth rate phenotype. We further drew ∼100 cells from one fast- (progeny D) and one slow- (progeny C; supplementary fig. S2, Supplementary Material online) growing derivative of B8 and monitored growth of each cell clone for seven days. As expected, cells from the fast-growing progeny had a higher mean growth rate than that from the slow-growing descendants (P-value = ; fig. 1C) and the heritability was 0.32 (P-value).
If mutations that slow cell proliferation frequently arises in cancer cell populations, we would expect a decrease in proliferation rates as the population is maintained. To test this, we monitored growth of single cells that were randomly drawn from cell populations at different time points. We first set up six single-cell clones from B8 (supplementary table S1, Supplementary Material online). After cell numbers reached 100–500 (8–10 cell divisions), 20–30% of the cells from each population were randomly drawn and isolated into single cells. The growth of these isolates was monitored for eight days. This step was repeated when the size of the six populations exceeded 5,000 cells. In all six cases, the growth rates of cells drawn at the first time point were higher than those from the second time point (P-value = , ANOVA). In addition, in four out of six cases, growth rate was higher at the first than at the second time point (supplementary fig. S3, Supplementary Material online; t-test).
To test whether the slow-growing cells would be outcompeted by their fast-growing counterparts, we performed a competition assay. The fast- and slow-growing cells with the stable expression of different fluorescent proteins, Discosoma sp. red fluorescence protein (DsRed) or enhanced green fluorescence protein (eGFP), were constructed, and cocultured in different ratios. The expression of eGFP and DsRed was used to distinguish the two types of cells in the competition assay. Their proportions in populations were monitored weekly over time using flow cytometry. We ran the experiment for eight weeks. Regardless of the initial proportions, the fast-growing cells always outgrew the slow-growing cells in our coculture assays over time (fig. 1D and E), suggesting that fast cells indeed possessed higher fitness than the slow ones.
Figure 1 demonstrates that a cancer cell population can generate heterogeneity in growth rate within several cell replications, even starting from a single cell. Moreover, the majority of these changes is heritable and reduce the fitness of cancer cells (defined as proliferation rate), suggesting that the fitness reduction we observed is largely genetically determined.
Cell Growth Rate Is Correlated with the Total Length and Number of CNVs
To study the genetic basis of growth rate heterogeneity among our cancer cell lines, we assessed genomic variation in E6 and five of its descendant clones by constructing a digital copy-number profile based on next generation sequencing reads. We focused on CNVs because single-nucleotide mutation rates are too slow to produce significant sequence variation during our short-duration culturing experiments.
Because the sequence depth of these clones was only 10X, CNVs found in each clone were presumably originated from ancestral clone (see Materials and Methods). The number of CNVs ranged from 2 (B8 and G3) to 9 with the average of 5.2 (supplementary table S2, Supplementary Material online). The three slow-growing clones showed a clear increase in the number and the total length of CNVs compared with the E6 parental line (fig. 2, supplementary table S2, Supplementary Material online), whereas the two fast-growing clones were more similar to E6, suggesting that that most CNVs are deleterious. As E6 experienced only 15–16 divisions before its five descendant clones were generated, above results also indicate that CNVs can be generated in a very short period of time. To test this hypothesis, 11 clones derived from B8 with different growth rates between day 1 and 8 were picked for further analyses (fig. 3A). The growth rate of each clone was measured again by RTCA iCELLigence when the population reached ∼106 cells (after 20–30 cell divisions). The results were highly correlated (R2 = 0.713, P-value < 0.01; fig. 3B) with the previous eight-day measurements, demonstrating that variation in growth rates among clones was consistent and not due to stochastic fluctuation at different stages. We picked ∼20 cells from each of the 11 clones and counted their chromosome numbers. The karyotypes ranged from 38 to 113 chromosomes, with most (72%) cells harboring between 55 and 70 chromosomes (fig. 3C), indicating that they are triploid as shown in a previous study (Adey et al. 2013). Therefore, despite single-cell origin, the progeny quickly generated aneuploidy within only 20–30 cell divisions, again illustrating frequent cytogenetic change in cancer cells.
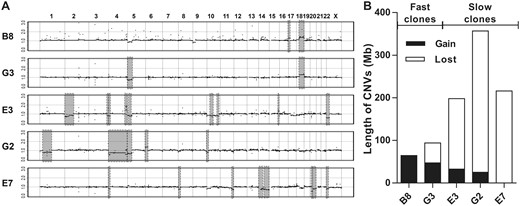
Copy number variation (CNVs) in five clones derived from E6. (A) The CNV regions in fast- (B8 and G3) and slow-growing (E3, E7, and G2) clones are highlighted with grey rectangles. The y-axis is the ratio of copy number in a descendant clone divided by copy number in the ancestor, E6. (B) Summary of CNV gain and loss among five descendant clones (see also supplementary table S2, Supplementary Material online).
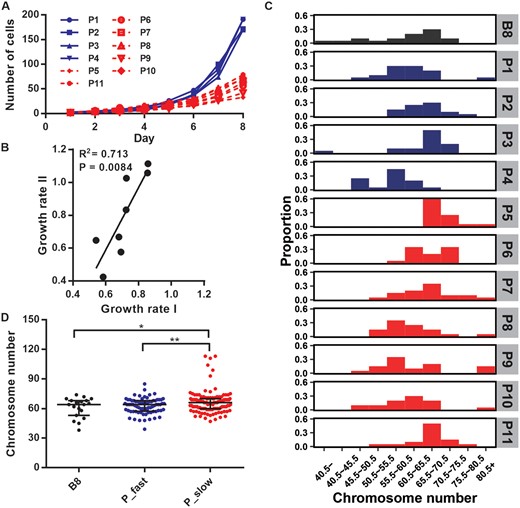
Growth rate and chromosome number variation among single-cell clones generated from B8. (A) Cell numbers of single-cell clones from day 1 to day 8. The clones labeled in blue grow faster than the clones in red. (B) Correlation between growth rate I and II of single-cell clones. The growth rate I (x-axis) was measured in the first eight days and the growth rate II (y-axis) measured by RTCA iCELLigence method when the cell populations reached ∼106 cells. Each dot represents a single cell clone; only eight out of 11 clones were measured at the second time point. (C) Distributions of chromosome numbers in cells from ancestral and descendant clones. Chromosome numbers (x-axis) of 20–30 cells randomly drawn from each clone were counted. The black, blue, and red histograms each represent cells from the ancestral, fast, and slow progeny clones. (D) Chromosome number in cells from the ancestral (B8) and the progeny clones. The black, blue, and red dots represent cells from the ancestral, fast (P_fast), and slow (P_slow) progeny clones, respectively. *P < 0.05, **P < 0.01.
Although chromosome numbers varied among clones, their distribution by combing all clones reconstituted the chromosome distribution of their ancestor B8. The average number of chromosomes in the fast-growing group (62.5) was similar (P-value = 0.56, t-test) to the B8 clone (61.1), whereas the slow-growing group (66.5) showed significantly greater chromosome numbers than the fast-growing (P-value < 0.01) and the ancestral (P-value = 0.04) clones (fig. 3D). Consequently, although the number of observations is still small, figures 2 and 3 suggest that cancer cells exhibit a very high rate of CNV generation and most of these CNVs are deleterious, reducing the cells’ proliferative ability.
Modeling Population Growth Attenuation
To estimate parameters of this model (, μ, and s) we randomly drew 18 single cells from B8 and monitored their growth for 7–8 days (supplementary table S3, Supplementary Material online). We divided these newly derived cell lines into fast- (cell number > 100) and slow-growing (cell number < 100) groups. We then conducted computer simulations to evaluate the parameters that best fit the observed data (see Materials and Methods).
Using fast-growing cell data, we estimate posterior mean of , , and (supplementary table S3, Supplementary Material online). Estimates from slow-growing cells , , and are similar, except that the initial growth rate is slower, as expected. The deleterious mutation rate (μ) of 0.29 (0.25, 0.33) suggests that there is approximately one deleterious mutation for every 3–4 cell divisions. Since μ is scaled per cell division, the product of μ and s reflects fitness change per generation. Our estimates indicate that the HeLa cells experience a 5% (4%, 6%) reduction in fitness for every generation (Crow 1958). Using point estimates of μ (0.29) and s (0.18), we fitted our model to the growth rates observed in a range of experimental data (supplementary fig. S2, Supplementary Material online) and estimated initial growth rates (). Only cell lines that showed monotonic increase in cell numbers were considered. The estimation of , ranging from 1.64 to 2.54 in 43 sets of experimental data (supplementary table S4, Supplementary Material online), suggested that the ancestral cell of slowest growing lineage had accumulated ∼2.2 [log (1.64/2.54)/log (1–0.18)] more deleterious mutations than the ancestor of fastest growing lineage.
To further empirically test the estimates of μ, we picked 12 cells from B8, allowed them to divide once, and isolated each daughter cell in a well of a 96-well plate. We then monitored the growth of each of the 12 pairs of cells for four days (supplementary fig. S4, Supplementary Material online). Four cell pairs lost at least one of the daughters in the first four days, probably due to injury during preparation. Of the remaining eight pairs, two (h and i, supplementary fig. S4, Supplementary Material online) exhibited different proliferation rates between the daughter cell lineages. The result suggests that there is approximately one deleterious mutation in every four cell divisions in this cancer cell line, which is very close to parametric estimates. Such a high deleterious mutation rate implies that many cells at day four would carry deleterious mutations that reduce cell proliferation. To test this, each descendant of clone f was harvested and resuspended into a 96-well plate. We monitored growth of these progeny for another four days. As expected, the majority of the surviving clones exhibited slower growth than their ancestor f (supplementary fig. S5, Supplementary Material online).
Rapid Accumulation of Deleterious Mutations in Different Types of Cancer Cell Lines
Interestingly, while R0 shows substantial variation among Hela cell clones, estimates of μ and d are similar, possibly indicative of an intrinsic property of rapid cancer cell division. To further test whether the property in the accumulation of deleterious mutations is consistent in cancer cells, we estimated the R0, μ, and d in tumor cell lines from different cancer types by the same method (table 1). Although the R0 are considerably variable, μ and d are generally consistent among cell lines, implying that a fitness reduction (μ × d) in a variety of cancer cells is close to our initial estimate of 5% per generation.
Fitness Reduction Per Cell Division in Different Cancer Cell Lines.
| Cell Line | Cancer Type | Number of Clonesa | b | c | d | |
|---|---|---|---|---|---|---|
| Hela | Cervical cancer | 18 | 1.66–2.48 | 0.25–0.33 | 0.17–0.20 | 0.04–0.06 |
| PC3 | Prostate cancer | 10 | 1.68–2.11 | 0.26–0.31 | 0.16–0.20 | 0.04–0.06 |
| A204 | Rhabdomyosarcoma | 7 | 1.81–2.07 | 0.28–0.33 | 0.17–0.22 | 0.05–0.07 |
| A375 | Melanoma | 17 | 2.14–2.64 | 0.26–0.34 | 0.16–0.23 | 0.05–0.08 |
Note.—To estimate parameters in equation (1), single cells were randomly chosen from different cancer cell lines (supplementary table S5, Supplementary Material online) and their growth from day 0 to day 7 was monitored. Fitness reduction was evaluated based on the parameters estimated by applying computer simulations, which are described in Results and Materials and Methods.
The number of single cell clones generated from different cancer cell lines.
Growth rate of cell population at day 0.
Deleterious mutation rate.
Average deleterious effect of a mutation.
Modeling Genetic Load in Long-term Cancer Growth
High deleterious mutation rate would raise an impression that the HeLa cell lines may have gone extinct long ago. To address this issue, we modeled the dynamic of “long-term” cell growth starting from a single cell and monitored MA within populations. The aim is to evaluate the level of genetic load that affects cancer growth accompanied by continuous accumulation of deleterious mutations. In a total of 200 simulations, each population was originated from one single cell and the mutation status of all cells within population was recorded until the population size of the clone reached 5,000 (survived) or 0 (defected; fig. 4A, see Materials and Methods).
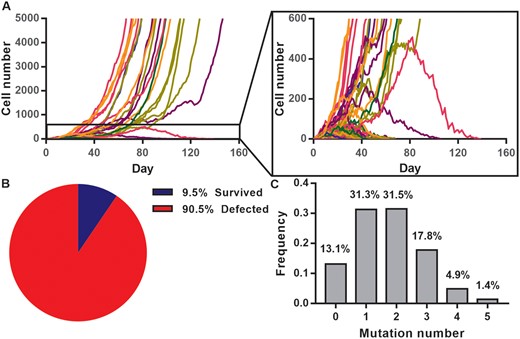
Dynamics of cancer cell growth and their mutation distribution. (A) The growing trajectory of 200 tumor clones in silico. Each curve represents the dynamic of one single cell clone from day 0. (B) Among 200 replicates, only 19 clones survived successfully whereas most of the clones were defected (clone extinction). (C) The distribution of deleterious mutation number per cell from 1,000 selected cells. The demographic parameters are R0 = 2.0, μ = 0.3, and s = 0.18.
Nineteen clones (9.5%; fig. 4B) were still survived after 180 generations (days). We then randomly chose one clone and let it grew to the population size of 106 and the mutation spectrum of this clone was obtained by randomly sampling of 1,000 cells (fig. 4C). As expected, the majority of cells (86.9%) had accumulated at least one deleterious mutation compared with their ancestral cell. The results also show that the slowest growing cells have accumulated five more deleterious mutations than the fastest growing cells, indicating a large diversity within the clone, a result similar to our observations in figures 1 and 3. Although most of the cells accumulated deleterious mutations and were worse than the ancestral cells, there were still 13.1% of cells that were mutation-free. According to the least-loaded theory (Gordo and Charlesworth 2000a), these growing number of mutation-free cells can prevent the population from extinction.
Discussion
The increase in mutation rate and genome instability is one of the hallmarks during tumorigenesis, which not only generates advantageous mutations (drivers), but also accumulates large number of passengers that are neutral or deleterious. However, it remains unknown, first, how many deleterious mutations may accumulate in cancer cell populations. As the fixed and high frequency mutations that calculated in cancer genomic studies are usually advantageous or neutral for the cell fitness, deleterious mutations are hardly detected in empirical studies. The detection of a moderate proportion of negative selective mutations in TCGA pan-cancer data indicates the ignorance of deleterious mutations (Wu et al. 2016). Second, deleterious mutations may arise at a high rate and cannot be efficiently purged by natural selection in populations with no recombination, such as cancer cells (Haigh 1978; Maynard Smith 1978; Kondrashov 1982; Charlesworth 1990; Lynch and Gabriel 1990; Lynch et al. 1993; Wu et al. 2016). We, herein, evaluate whether high mutation rate and the irreversible accumulation of deleterious mutations might lead to mutational decay of cancer cell populations. Performing multiple single-cell progeny assays and extensively genotyping in the clonal populations of HeLa cell lines, we estimate the rate and effect of deleterious CNV mutations in cancer cell populations. The results show that deleterious CNV mutations appear at the rate that falls in the range of 0.26–0.33 per genome per generation with the mean deleterious effect of 0.18 ([0.175, 0.187], 95% confidence interval), indicating the high level of fitness reduction in cancer cell populations (Fischer et al. 2011; McFarland et al. 2013; Lynch 2016).
While our observation that majority of mutations was deleterious in cancer cell lines is similar to previous results derived mainly from MA experiments in multi-cellular organisms (Willi 2013; Katju et al. 2015; Lovell et al. 2017), these two types of studies differ in two major aspects. First, genomes of multi-cellular organisms evolve to ensure the survival and reproduction of the whole organisms. Cancer cells evolve from multi-cellular state toward a single-cell state that is distinct from their longstanding role. In that sense, similarities between our results and those in microbes (Kibota and Lynch 1996) may be unsurprising. In addition, Cancer cells usually exhibit a higher mutation rate than normal cells (Wu et al. 2016). While increased mutation rate likely imposes a cost, it also permits cancer cells to evolve new properties, such as poly- and aneuploidy and other CNVs than normal cells can (Molaro and Malik 2017; Xu et al. 2017). A second major difference is that most MA experiments have been conducted under constant small population size (Ne = 1 or 10), including a strong bottleneck effect under which mutations with small effect, either deleterious or beneficial, can be stochastically fixed within populations. This stochasticity may explain mixed results that have been observed in a few MA studies (Shaw et al. 2000; Dickinson 2008; Woodruff 2013).
The mechanism of Muller’s ratchet is determined by the population size (N), the mutation rate (μ), and the selection coefficient (s) (Haigh 1978; Gordo and Charlesworth 2000a). Although we observed the high level of genetic load and the population decay in cancer cell lines, further sophisticated analysis, taken considering the key parameters, must be performed to reveal the process and the consequences in the tumors in patients. It may help reveal the process and the consequences in the tumors in patients and develop a new therapeutic regime for cancer.
The increase of N and s will let up the ratchet. Accordingly, as the tumors grow, the operation of Muller’s ratchet may slow down, leading to the absent of mutational meltdown. Thus, tumor size would be positively correlated with the malignancy which has been shown in many cancer types, including breast, kidney, pancreatic and lung cancers (Agarwal et al. 2008; Thompson et al. 2009; Narod 2012; Zhang et al. 2015). On the contrary, the s could be small in a large tumor. In solid tumors, the local cell populations do not migrate and are highly structured. Selection can be more inefficient in solid tumors than in nonsolid tumors such as leukemia, because the cell populations are so spatially constrained that a selection sweep may not occur in solid tumors (Ling et al. 2015). Other factors may interfere the process of Muller’s ratchet and warrant further attention. For example, the occurrence of advantageous mutations can effectively compensate the fitness decay from Muller’s ratchet (Bachtrog and Gordo 2004).
Practically, mutation rate can be increased by targeting the DNA repair system (Yaglom et al. 2014) or by regulating DNA replication stress (Burrell et al. 2013). The increase of mutation rate will accelerate the ratchet (Gordo and Charlesworth 2000a, 2000b; Lynch et al. 2016) which would in turn reduce tumor fitness and make tumors more sensitive to anticancer drugs (Pavel and Korolev 2017). For example, it has been suggested that high mutation rate may associate with a higher occurrence of neo-epitope formation and tumor immunogenicity. Thus, increase sensitivity to immune checkpoint inhibitors (McGranahan et al. 2016; Palmieri et al. 2017), such as anticytotoxic T-lymphocyte antigen-4 (Van Allen et al. 2015) and programmed cell death-1 (PD-1; Le et al. 2015) antibodies.
However, for these strategies to be effective, an additional layer of cancer biology needs to be considered. Muller’s ratchet also explains the paradoxical relationship between chromosomal instability and prognosis in ovarian, gastric, and nonsmall cell lung cancer, with poorest outcome in tumors with intermediate, rather than extreme chromosomal instability (Birkbak et al. 2011). Cancer cells may benefit from generating genetic variation paving the way for tumor progression. The tumor populations, thus, must strike a delicate balance to maintain heterogeneity and at the same time curb relentlessly increasing mutations which may be used to develop a new therapeutic regime for cancer. Therapies that directly target cell proliferation should be considered. In order to maintain high proliferation rates, rapidly proliferating cells need to increase their translational capacity and are dependent on high rates of ribosome biogenesis (Ruggero and Pandolfi 2003; Gentilella et al. 2015). Thus, inhibition of ribosome biogenesis could be a selective approach to cancer therapy (Bywater et al. 2012; Cortes et al. 2016). More importantly, this effect is enhanced in cells with higher proliferation rates, but less so in cells with lower proliferation rates.
Materials and Methods
Cell Culture and Single-cell Isolation
Cancer Cell lines, including HeLa cell lines, Human prostate cancer cell line PC3, Human Rhabdomyosarcoma cell line A204, and Human malignant melanoma cell line A375, were obtained from the Culture Collection of the Chinese Academy of Sciences, Shanghai, China. Cells were cultured in DMEM Medium for HeLa cell, PC3 and A375, in medium of McCoy’s 5A for A204 (Life Technologies) and supplemented with 10% fetal bovine serum (FBS; Gibco, Life Technologies), 100 U/mL of penicillin, and 100 μg/mL of streptomycin at 37 °C with 5% CO2. Cells were trypsinized using 0.05% trypsin at room temperature for 3 min. Cell counting was performed with a hemocytometer. The cell suspensions were diluted with medium to the final concentration of 1 cell per 100 µL. Single cells were seeded into each well of a 96-well cell culture plate and maintained at 37 °C with 5% CO2. After incubating for 12 h, during which the cells attached to the wells, the single-cell isolation was visually confirmed by microscopy. The number of cells in each well was counted every day. When the cell colony became sufficiently large, cells were transferred to 24-well plates, and subsequently transferred to 6-well plates and 10-cm culture dishes.
Karyotype Analysis
The cultured cells in a stage of active division were treated with colchicine (200 ng/mL for 1 h at 37 °C, then harvested and resuspended in 0.07 M KC1 for 30 min, and slowly added 10 drops of Carnoy's fixative (3:1, methanol:acetic acid). The suspended cell was dropped onto a slide, dried the slide rapidly, and stained with 4% DAPI for 5 min. At least twenty cells were spread out in metaphase for karyotyping. Evaluation of interphase nuclei was performed by OLYMPUS BX51 fluorescence microscope. Photographs were taken by CCD camera with 40 or 100 times objective. Image-Pro Plus software was used for digital image acquisition in the TIFF format, pseudocoloring and merging.
MTT Assay
Cells were suspended and seeded at the concentration of ∼700 cells/100 μl/well in 96 well plate. A volume of 20 μl-dissolved MTT was pipetted into each well. After being incubated for 4 h at 37 °C in a humidified CO2 incubator, the media was removed and 200 μl sterile DMSO was added to each well. The absorbance values were then read at 570 nm with a microplate spectrophotometer. The proliferation of living cells was monitored based on absorbance values.
Real-time Cell Analysis Assay (RTCA)
Cells in 10% FBS media were seeded at a density of 5,000 per well into a 16-well E-plate (ACEA) and incubated for 72 h at 37 °C in a humidified CO2 incubator. The impedance for each well was monitored by the RTCA iCELLgence system (ACEA Biosciences Inc.) for every 70 min. Relative impedance signal level (represented as “cell index” in manufacturer’s software) that indicated the number of cells was analyzed using the RTCA Software 1.2 program (Roche Diagnostics). The cell growth curves were automatically recorded on the iCELLigence system in real time. The cell index was followed for 3 days.
Measurement of Growth Rate
Whole Genome Sequencing and Analysis of CNV
Genomic DNA was extracted from 106 HeLa cells in E6 and each of the E6 descendant clones (including G3, G2, B8, E7, and E3) using QiagenAllpre DNA/RNA Mini Kit (Qiagen). The genomic DNA (3 μg) was fragmented by Adaptive Focused Acoustics on a Covaris E120 (Covaris Inc.). The range of product size was from 250 bp to 350 bp. The fragmented DNA was purified by Qiaquick PCR purification column and quantified on 2100 Bioanalyzer by using the Agilent DNA 1000 kit (Agilent Technologies, Palo Alto, CA, USA). The whole genome libraries were constructed by IlluminaTruseq DNA sample preparation kit according to the manufacturer’s instructions. Whole genome sequencing was performed using the Illumina Hiseq 2000 in the Beijing Institute of Genomics (BIG, Beijing, China). After quality control, the average read depth was 10×. Reads were mapped to the human reference genome (hg18) using BWA software (Version 0.4.9) with default parameters (Li and Durbin 2009).
The aligned reads were used as input of the Control-FREEC software (Control-FREEC v10.3; http://bioinfo-out.curie.fr/projects/freec/) for characterizing the large-scale chromosomal and segmental duplication and deletion events (>10 MB) in five descendant clones against E6. Control-FREEC was run with the following parameters: window size, 100 kb; step size, 50 kb; contaminationAdjustment = TRUE; noisyData = TRUE; BAF calculation inactivated. To determine significant CNA calls, Wilcoxon test and Kolmogorov–Smirnov test (P-value < 0.01) were performed using the script assess significance. Since HeLa is triploid and some regions may contain 4–5 DNA copies (Adey et al. 2013), the ratio for changes from three to two copies is 0.67 and from three to four copies is 1.33. Similarly, the ratio for changes from four to three copies is 0.75 and from four to five copies is 1.25. Consequently, we set the relative ratios of >1.2 for copy number gain and <0.8 for copy number lose in the “MedianRatio” (fig. 2A, and supplementary table S2, Supplementary Material online).
eGFP and DsRed Transfection
Cells with the stable expression of eGFP and DsRed were constructed by transfecting with lentivirus vectors, plenti6.3-MCS-IRES-eGFP and plenti6.3-MCS-IRES-DsRed (Life Technologies), which contained a blasticidin resistance gene and an eGFP or a Discosoma sp. red fluorescent protein (DsRed) sequence. The expression of eGFP and DsRed were used for labeling and distinguishing the two cells in the competition assay. The vectors were packaged into the lentivirus particles with infectious activity (Invitrogen). Before transfection, cells per well were incubated with DMEM in a 6-well plate. After incubating for 24 h, the medium was replaced by the transfection medium that contained the lentivirus particles and polybrene with the concentration of 8 µg/mL. The multiplicity of infection (MOI) value was 3. After transfecting for 24 h, the cells were washed three times with PBS, and cultured in the DMEM medium with blasticidin of 10 µg/mL for at least 4 weeks in order to select cells that stably express eGFP and DsRed.
Isolation of Fast-growing and Slow-growing Cells
The CellTrace Violet Cell Proliferation Kit, for flow cytometry (Thermo Fisher, C34557) was used for isolating the fast-growing and slow-growing cells. Cells were labeled by the cell-dye following the CellTrace Violet Cell Proliferation Kit workflow after cell cycle synchronization arrested at G1/S phase (double thymidine block). The labeled cells were continuously cultured for 7 days. At the 7th day after labeling, the cells were detached by trypsin–EDTA solution and suspended on culture medium. The BD Influx flow cytometer (BD) was used to isolate the fast-growing and slow-growing cells. The top 10% cells with strong fluorescence signals and bottom 10% cells with weak fluorescence signal were sorted as the slow growing and fast-growing cells respectively. Analysis was completed using the BD Influx flow cytometer with 405 nm excitation and a 450/40 nm bandpass emission filter.
Competition Assay for Slow-growing Cell and Fast-growing Cells
Fast-growing cells with stable eGFP expression (or DsRed expression) and the slow-growing cells with DsRed expression (or eGFP expression) were mixed and cocultured at different initiation ratios (1:1, 2:8, and 8:2). The proportions of the two cell populations in the mixture were monitored by fluorescent intensity of DsRed and eGFP every 3 days by using flow cytometry.
Modeling Population Dynamic of Cell Expansion
Estimate and Fitness Reduction
Cell Growth Simulation
We extended the previously described genetic load to simulate the cell growth with accumulation of deleterious mutations. The simulation begins with a single cell. Each day, cells attempt to divide and produce additional cells. The initial growth rate, (), follows a Poisson distribution. For each cell replication at day t, the number of growth rate () which is randomly generated followed by mean growth rate . represents cell proliferation, whereas denotes cell death. During replication, a proportion of cells (μ) generates deleterious mutations. The mutations accumulated in the cells decreases the growth rate. The average deleterious effect of a mutation is s. Therefore, the growth rate of a cell population is reducing as a function of time. The computational model is qualitatively similar to our mathematical model, but considers much more complicated conditions, that is, the fluctuations of the parameters (, μ, and s) caused by their distributions.
When is fixed and μ and s are given, we can monitor the cell number every day using the simulation model. In summary, we cultured 106 cell lines in the simulation with different combinations of , , and s. Comparing the 106 results with observed data with HeLa cell lines, we used the Approximate Bayesian Computation (ABC) method to select optimal groups. The mean number of the selected groups represent the estimated , , and s.
Inference of R0, , and by ABC Method
Because of the complexity of the parameter space, we used ABC method by comparing the simulated 106 cell lines with observed data with HeLa to estimate , , and s. ABC algorithms are a group of methods for performing Bayesian inference without the need for explicit evaluation of the model likelihood function. The algorithms can be used with implicit computer models that generate sample data sets rather than likelihoods (Beaumont et al. 2002; Wilkinson 2013). By using ABC we can compute the posterior probability distribution of a multivariate parameter (). A parameter value is sampled from its prior distribution to simulate a data set , for i = 1, …, 106. A set of summary statistics, the value that calculated from the data to represent the maximum amount of information in the simplest possible form, is computed from the simulation. By using a distance function , we calculated the distance between and observed data . If the distance between and is less than a given threshold, the parameter value is accepted. In order to set the threshold that which simulations are accepted, we provide the tolerance rate , which is defined as the percentage of accepted simulation (Csillery et al. 2010; Csilléry et al. 2015).
The ABC inference scheme is:
Sample a candidate parameter from the prior distribution;
Simulate the growth process of the cell line and calculate the summary statistics ;
Compare the simulated data set , with the observed data , using a distance function and tolerance rate , if , accept;
Go to 1.
Here are summary statistics . The observed summary statistics . The prior distribution in our model was , and. The distance function we set was the Euclidean distance and the tolerance rate we set was 0.1%. As a whole 1,000 groups of were accepted.
By using different clones’ data from B8 as , we finally calculated the parametric ranges of rapid proliferated cells were , , and . Meanwhile, the parametric ranges of defected cells were , , and .
Modeling Genetic Load in Long-term Cancer Growth
To assess how this high genetic load will affect the growth of HeLa cell lines in a long run, we modeled the dynamic of long-term cell growth in silicon. The simulation started from a single cell. The growth rate (), mutation rate ( per genome per cell division) and mutational effect () are from our estimation above. As the clone grew, we recorded the mutation number of each cell every day. Because, in our previous simulation, clone seldom went extinction when its size reached 5,000, the simulation was stopped when the clone reached 5,000 (survived) or went extinction (defected). The simulation was repeated 200 times. Next, we randomly chose one survived clone and let grow to 106 cells. A total of 1,000 cells were randomly picked from this clone and their mutation profiles were recorded.
Data Availability
The raw sequence data reported in this paper have been deposited in the Genome Sequence Archive (Wang et al. 2017) in BIG Data Center (Members 2017), Beijing Institute of Genomics (BIG), Chinese Academy of Sciences, under accession numbers PRJCA000406 that are publicly accessible at http://bigd.big.ac.cn/gsa.
Supplementary Material
Supplementary data are available at Molecular Biology and Evolution online.
Acknowledgments
We thank Shun-Chern Tsaur for critical reading of the manuscript. We thank Zhenzhen Liu for the comments and suggestions during the preparation of the manuscript. We thank Xin Wu and Zhipeng Wu for their help in the artwork of figures. We thank Fang Yang, Chungyan Li, Caihong Zheng, and Encheng Dong for their help in experiments. This study was supported by grants from the Strategic Priority Research Program of the Chinese Academy of Sciences (XDB13000000to X.L.), the Natural Science Foundation of China (31771416, 91531305 to X.L.), Ministry of Science and Technology, Taiwan (105-2918-I-002-014- and 105-2628-B-002-015-MY3 to H.Y.W.), Natural Science Foundation grant (31771416, 31671370, 31301093, 11201224, and 11301294 to T.Z.), the Youth Innovation Promotion Association of Chinese Academy of Sciences (2015080 to T.Z.), the Key Research Program of the Chinese Academy of Sciences (KFZD-SW-220 to X.L.).
References
Author notes
These authors contributed equally to this work.
