


Abstract
Numerous studies covering some aspects of SARS-CoV-2 data analyses are being published on a daily basis, including a regularly updated phylogeny on nextstrain.org. Here, we review the difficulties of inferring reliable phylogenies by example of a data snapshot comprising a quality-filtered subset of 8,736 out of all 16,453 virus sequences available on May 5, 2020 from gisaid.org. We find that it is difficult to infer a reliable phylogeny on these data due to the large number of sequences in conjunction with the low number of mutations. We further find that rooting the inferred phylogeny with some degree of confidence either via the bat and pangolin outgroups or by applying novel computational methods on the ingroup phylogeny does not appear to be credible. Finally, an automatic classification of the current sequences into subclasses using the mPTP tool for molecular species delimitation is also, as might be expected, not possible, as the sequences are too closely related. We conclude that, although the application of phylogenetic methods to disentangle the evolution and spread of COVID-19 provides some insight, results of phylogenetic analyses, in particular those conducted under the default settings of current phylogenetic inference tools, as well as downstream analyses on the inferred phylogenies, should be considered and interpreted with extreme caution.
Introduction
The Coronavirus disease 2019 (COVID-2019) caused by a novel coronavirus (severe acute respiratory syndrome coronavirus-2 [SARS-CoV-2]) emerged in Wuhan, China in December 2019 (WHO situation report May 30, 2020) and spread worldwide in 212 countries and territories causing more than 17.6 million cases and 680,000 deaths within a period of 7 months (WHO situation report August 2, 2020).
A full genome sequence analysis revealed that 2019-nCoV-2 belongs to the betacoronaviruses, but that it is divergent from the SARS-CoV and MERS-CoV that caused past epidemics. The 2019-nCoV-2 and the bat-SARS-like coronavirus form a distinct lineage within the subgenus of the Sarbecovirus. The whole-genome sequence of SARS-CoV-2 shows 96.2% similarity to that of a bat SARS-related coronavirus (RaTG13) collected in the Yunnan province of China. The SARS-CoV-2 also exhibits similarity to the coronavirus from Malayan pangolin in a particular genomic region coding for the spike protein, including the receptor-binding domain. Note that the aforementioned bat and pangolin sequences merely constitute the most similar sequences known, yet not necessarily the most closely related sequences.
Since the early characterization of SARS-CoV-2 in Hubei, China, an enormous number of sequences have been characterized. On July 31, 2020, approximately 75,000 full genome sequences have become available. Molecular epidemiology has attempted to provide a detailed picture about the distinct lineages and substrains circulating in different geographic areas as well as about the dispersal pattern and cross-border transmissions at different time periods during the pandemic (https://nextstrain.org/ncov/global; Hadfield et al. 2018). Moreover, whole-genome sequence analysis has been used for within-country studies as well as for the detailed investigation of viral dispersal within specific communities.
To date, the globally circulating viruses have been classified into six major clades denoted as S, L, V, G, GH, and GR (https://www.gisaid.org/;Shu and McCauley 2017). Analyses of the viral sequences can unravel the number of mutations separating the lineages from the founding Wuhan haplotype. These analyses provide a more detailed classification of variants into haplotypes that can be used to trace the geographical distribution and patterns of dispersal of distinct lineages (Brufsky 2020; Rambaut et al. 2020). Molecular epidemiology studies attempt to quantify the number of introductions of SARS-CoV-2 to different countries and their putative geographic origin (Rambaut et al. 2020; van Dorp et al. 2020). Haplotype analyses based on SARS-CoV-2 can also provide information about within-country infection clusters.
A study from Iceland applied molecular analyses and verified their results via a comparison with contact tracing networks (Gudbjartsson et al. 2020). It concludes that, when contact tracing networks are unavailable, phylogenetic analyses can be deployed to disentangle infection clusters within countries. Full-genome analyses of SARS-CoV-2 can potentially identify emerging novel variants that may alter the spike interaction with the ACE2 receptor, TMPRSS2 protease, and epitope mapping.
SARS-CoV-2 evolves at an estimated nucleotide substitution rate ranging between and substitutions per site and per year (see Table 1 in van Dorp et al. (2020). Molecular clock analyses have been used to estimate the time of the most recent common ancestor of the global pandemic as well as the most recent common ancestor of local epidemics in different geographical regions (see again Table 1 in van Dorp et al. [2020]).
Metrics for Assessing the Quality of the Tree Inference Conducted on the Four Distinct MSA Versions (FMSA, FMSAO, SMSA, SMSAO).
| Metric | FMSA | FMSAO | SMSA | SMSAO |
|---|---|---|---|---|
| Taxa | 4,869 | 4,871 | 2,888 | 2,904 |
| ML trees RF | 0.783 | 0.783 | 0.775 | 0.783 |
| Search RF | 0.112 | 0.112 | 0.128 | 0.119 |
| Plausible trees | 76 | 75 | 74 | 76 |
| MR res. r(T) | 0.129 | 0.131 | 0.155 | 0.147 |
| MRE res. r(T) | 0.706 | 0.701 | 0.699 | 0.680 |
Note.—ML trees RF is the average relative RF distance between all 100 inferred ML trees. Search RF is the average relative RF distance between the parsimony starting trees and the final ML trees of the respective tree searches on these starting trees. Plausible trees represents the number of trees (out of 100) in the plausible trees set. MR and MRE resolutions are the resolution ratios (see definition in the text) of the MR and MRE trees computed on the plausible tree sets.
The inference of a phylogenetic tree on the full genomes is pivotal to numerous molecular epidemiology tools and studies (e.g., Deng et al. 2020; Duchene et al. 2020; Guohu et al. 2020; Lemey et al. 2020; Rambaut et al. 2020). A plethora of studies (e.g., Filipe et al. 2020; Gonzalez-Reiche et al. 2020; Jaimes et al. 2020; Lednicky et al. 2020; Li et al. 2020; Liu et al. 2020; Lu et al. 2020; Pipes et al. 2020; Zhou et al. 2020) to disentangle the evolution of the SARS-CoV-2 pandemic is currently being published at a high pace and under considerable time pressure, both with respect to the tree inference time, paper writing time as well as the review time for these papers. In almost all cases, including the daily updated virus phylogenies on the exceptional nextstrain platform, phylogenetic inference on the currently available virus genomes is conducted predominantly via standard maximum likelihood (ML)-based tools using default program parameters. In addition, several publications also deploy some of the fast, yet less accurate bootstrapping and tree search options implemented in tools such as standard RAxML (Stamatakis et al. 2008) and IQ-TREE (Hoang et al. 2018). In general, some of these analyses might have been (too?) rushed, not only at the phylogenetic inference level (see analogous cautionary notes in Villabona-Arenas et al. (2020) but also potentially at previous stages of SARS-CoV-2-related data generation and data analysis steps (e.g., see http://virological.org/t/issues-with-sars-cov-2-sequencing-data/473).
In our study, we do not follow this trend, but take a detailed look at the general difficulties of inferring and postanalyzing phylogenies on the highly challenging SARS-CoV-2 data set, as it contains thousands of taxa with few mutations, and hence comparatively weak signal. Together, these aforementioned difficulties render phylogenetic analysis and postanalysis highly challenging, both with respect to the signal that we can extract, but also regarding the numerical stability of current tools.
The remainder of this paper is structured as follows. We first provide an overview of our data preparation and analysis pipeline. Subsequently, we discuss some noteworthy difficulties that arose when processing the data. Then, we present the results of our inference, rooting, and classification attempts. We conclude the paper with a critical discussion of the results.
Data Preparation and Analysis Pipeline
Our data analysis pipeline is available at https://github.com/BenoitMorel/covid19_cme_analysis under GNU GPL.
Raw Data Preprocessing
We downloaded the raw data from gisaid.org on May 5, 2020. It contained 16,453 full-genome ( bp) raw sequences with high coverage. High-coverage sequences are defined by GISAID as sequences containing less than 1% Ns (undetermined characters), less than 0.05% unique amino acid mutations, and no insertions/deletions unless these have been verified by the submitter.
Filtering
We applied additional filters to identify sequences of high quality. We initially removed approximately 7,717 sequences using the following two-step strategy. First, we trimmed external undetermined characters at the beginning and at the end of the genomes (Step 1). After this trimming, we only kept sequences with less than ten internal undetermined characters (Step 2). We trimmed external undetermined characters (Step 1) prior to filtering (Step 2) because our goal was to only use sequences with a low number of internal undetermined characters. External undetermined characters do not affect the alignment quality since not all sequences start at exactly the same nucleotide. The final filtered raw sequence data set comprised 8,736 SARS-CoV-2 genomes and two outgroup sequences: the bat CoV (hCoV-19/bat/Yunnan/RaTG13/2013; Accession ID EPI_ISL_402131) and pangolin CoV (hCoV-19/pangolin/Guangdong/1/2019; Accession ID: EPI_ISL_410721) genomes.
Multiple Sequence Alignment
We aligned the 8,736 and 8,738 (including outgroups) trimmed sequences using the parallel version of MAFFT (v.7.205; Katoh and Standley 2013) with 40 threads.
Trimming after Alignment
After the MSA process, we further trimmed the first and the last 1,000 alignment sites. We applied this additional trimming as the sequencing did not start/finish at the same position for all sequences. Thus, the initial untrimmed MSA was characterized by a large amount of missing data at the beginning and the end of the MSA (see supplementary fig. 8, Supplementary Material online).
Overall, we generated four distinct versions of the alignment:
A comprehensive (comprising all 8,738 sequences) Full MSA with bat and pangolin Outgroups (FMSAO)
A comprehensive Full MSA of 8,736 sequences without outgroups (FMSA)
A noncomprehensive (not comprising all sites, and, as a consequence of additional removed sequence duplicates, not containing all 8,736 virus sequences; see below) singletons-removed MSA with bat and pangolin outgroups (SMSAO)
A noncomprehensive singletons-removed MSA without outgroups (SMSA)
We generated the noncomprehensive SMSAs by removing so-called singleton sites from the corresponding full MSAs (FMSA, FMSAO). For biallelic sites, that is, sites with only two states, a singleton site is a column of the MSA where the allele with the lowest frequency is only present in but a single sequence (e.g., AAAAAAAAT). Such sites only have a negligible contribution to the tree inference process due to weak phylogenetic signal. Furthermore, singleton sites can represent sequencing errors, as it is expected that most sequencing errors will appear as singleton sites.
The FMSA consists of 3,752 polymorphic sites, out of which 2,503 are either biallelic singletons (e.g., AAAAAAACAAA) or “multiallelic singletons” (e.g., AAAAAAACAAG), that is, sites where more than one allele only occurs once, whereas the site itself is not biallelic. Further, we also removed 97 “pseudosingleton” sites (e.g., AAAAACCCAAG), that is, sites that are neither biallelic nor multiallelic singletons, but do contain a nucleotide with only a single occurrence. In our example, G appears only once. The numbers of polymorphic sites, biallelic, and multiallelic singletons are exactly identical for the FMSAO data set (we double checked). Even though multiallelic singletons as well as pseudosingletons do contain some phylogenetic signal, we decided to remove them as they may also represent sequencing errors. Further, the pseudosingleton sites only account for a small proportion (∼2.5%) of the overall polymorphic sites.
Our singleton removal strategy is further justified by a recent study that has shown that lab-specific sequencing practices yield mutations that have been observed predominantly or exclusively by single labs. These can in turn affect the phylogeny reconstruction process (Turakhia et al. 2020). The authors provide regularly updated masking recommendations at https://github.com/W-L/ProblematicSites_SARS-CoV2/blob/master/problematic_sites_sarsCov2.vcf.
Finally, we removed all duplicate sequences from all of the above input MSAs, that is, all sequences that are exactly identical. We did this because identical sequences do not yield any additional signal for a phylogenetic analysis. Furthermore, duplicate sequences confound the calculation of support values, branch lengths, and needlessly increase the computational cost of the analyses.
After removal of duplicate sequences, the MSAs contained the following number of taxa: FMSAO (4,871), FMSA (4,869), SMSAO (2,904), SMSA (2,888). Note that, the difference in the number of taxa between SMSAO and SMSA is not simply two (i.e., the two outgroups) as conducting the alignment step with and without outgroups yields distinct MSAs that in turn induce a distinct number of identical sequences after trimming and singleton removal.
Also note that, when only considering the ingroup alignments, the data sets comprise a low proportion of unique alignment site patterns relative to the genome length: FMSAO/FMSA 4,997, SMSAO 1,781, SMSA 1,679. The number of unique patterns in FMSAO/FMSA is higher than the number of polymorphic sites that we reported previously, as the tool we used to analyze polymorphic sites ignores sites containing gaps. These low overall numbers in conjunction with the high number of taxa already indicate that the phylogenetic analysis is challenging.
For some exploratory experiments on topological and numerical stability, we used earlier data snapshots from April 2 and April 8 for which we assembled FMSAO data sets. The April 2nd FMSAO snapshot comprises 1,897 sequences and the April 8th snapshot comprises 2,754 sequences.
Our strict filtering strategy might not be applicable for analyses targeting specific geographic regions and might induce a shift in the geographical distribution of the data. Therefore, we assessed the potential shift in geographical distribution of samples for all four MSA versions. We find that our filtering approach induces predominantly stable per-country sequence number reduction factors that range between a factor of 2 and 4 (data not shown) for the FMSA and FMSAO data sets. The more strictly filtered SMSA and SMSAO data sets exhibit higher peak reduction factors, especially for sequences from Senegal (19), the Dem. Rep. of Congo (13), and Wales (13). However, our focus here is mainly on computational issues arising with the analysis of these data and we hence opted for assembling as “clean” as possible data sets (i.e., best case data quality). Nonetheless, in particular, the singletons-removed data sets induce a higher shift in the geographical distribution of the sequences and might therefore not be apt for specific epidemiological studies.
Phylogenetic Inference
We initially determined the best fit model on the SMSA data set using ModelTest-NG (Darriba et al. 2020). ModelTest-NG selected GTR+R4 (GTR model with four discrete free rate categories, also frequently referred to as “free rates model”) as best fit model. The free rates model (R4) exhibits some substantial intrinsic numerical difficulties (see Difficulties section for a more thorough discussion). To this end, we decided to use the numerically more stable GTR + Γ model with four discrete rates for all subsequent inferences.
With respect to the tree search strategy per se, we first executed 100 RAxML-NG (Kozlov et al. 2019) tree searches on the April 2 snapshot of the full MSA including outgroups using 50 randomized stepwise addition order parsimony starting trees and 50 random starting trees. We did this to explore the behavior of tree searches on these data. We observed that tree searches initiated on parsimony starting trees yielded phylogenies with better log-likelihood scores (consistently >400 log-likelihood units). Thus, we executed all subsequent phylogenetic tree searches on the data snapshot of May 5 using parsimony starting trees only.
Moreover, initial analyses of the April 2nd snapshot of the full MSA unsurprisingly showed low bootstrap support values, low transfer bootstrap support values (Lutteropp et al. 2020), and a phenomenon that we have termed “rugged likelihood surface” (Stamatakis 2011).
We had already observed such a rugged likelihood surfaces for difficult-to-analyze data sets with few sites and many taxa that do typically not contain strong phylogenetic signal on bacterial 16S data sets before (Stamatakis 2011). Characteristic of such data sets is that, for instance, 100 independent tree searches for the best-scoring ML tree on the original alignment will yield 100 distinct tree topologies with similar likelihood scores. Moreover, as we will show here, most of these ML tree topologies also exhibit a large pairwise topological distance. However, at the same time, we cannot deploy standard statistical significance tests to distinguish and select among those topologically diverse trees. This is because most of the resulting trees will not be statistically significantly different from each other with respect to their likelihood scores. Hence, given these substantial uncertainties in the search for the best-scoring ML tree in conjunction with the low number of variable sites, we apply the following procedure in an attempt to infer a representative phylogeny:
Conduct 100 ML tree searches using ParGenes (Morel et al. 2019) that seamlessly orchestrates such searches using RAxML-NG from randomized stepwise addition order parsimony trees.
Apply all statistical significance tests implemented in IQ-TREE to this set of 100 ML trees.
Assign ML trees to a “plausible” ML tree set that are not significantly worse than the best-scoring ML tree under any statistical significance test implemented in IQ-TREE. This assignment is conservative, as it will yield the smallest plausible tree set and circumvents the long-lasting debate about which phylogenetic significance test is most appropriate (e.g., see Goldman et al. [2000]).
Build a majority rule (MR) and an extended majority rule (MRE) consensus tree from the plausible ML tree set. Note that, neither the MR, nor the MRE consensus trees will necessarily be strictly bifurcating.
We conducted tree inferences exclusively on the ingroup MSAs (FMSA/SMSA and FMSAO/SMSAO with outgroups removed after the alignment process) as the usage of outgroups, in particular, if they are distant from the ingroup as is the case here, can perturb a phylogenetic analysis (Steiper and Young 2006; Gatesy et al. 2007). We describe later on how we place the outgroups onto the ingroup phylogenies after the inference, that is, independently of the ingroup tree inference.
Although we believe that building a consensus tree from the plausible ML tree set constitutes a reasonable approach, the fact of having a (in most cases) multifurcating (e.g., MR- or MRE-based) reference tree topology complicates matters for some of the downstream phylogenetic postanalysis methods, which often expect a strictly bifurcating phylogeny as input. The general strategy we adopt for addressing this issue is that, whenever possible, we attempt to compute summary statistics of postanalyses over the individual bifurcating trees in the plausible tree set. This approach is, in a sense, analogous to summarizing a posterior tree set as obtained from Bayesian analyses.
For improved clarity and readability, we introduce the following notation for the inferred trees:
FMSA-C: MR consensus of plausible ML ingroup tree set on FMSA
FMSA-CE: MRE consensus of plausible ML ingroup tree set on FMSA
FMSA-P: Plausible ML tree set for FMSA
FMSA-B: Best-scoring ML ingroup tree inferred on FMSA
SMSA-C: MR consensus of plausible ML ingroup tree set on SMSA
SMSA-CE: MRE consensus of plausible ML ingroup tree set on SMSA
SMSA-P: Plausible ML tree set for SMSA
SMSA-B: Best-scoring ML ingroup tree inferred on SMSA
The notation for inferred trees is analogous for the FMSAO and SMSAO data sets that do also not include the outgroups in the tree search step. We will use the MSA versions of FMSAO and SMSAO that do include the outgroup sequences in a separate step for assessing outgroup rooting.
Tree Thinning
At the time of writing, more SARS-CoV-2 sequences become available on a daily basis, whereas the available phylogenetic signal is already comparatively weak. To this end, it can be desirable to reduce the number of sequences we use for phylogenetic analysis in a reasonable way. We call this reduction “thinning” of a phylogenetic tree. The problem of thinning or clustering sequences on taxon-rich trees is not new in virus phylogenetics (e.g., see, Prosperi et al. 2011; Ragonnet-Cronin et al. 2013).
To thin a given tree or input MSA prior to phylogenetic analysis one has two options. First, one can use biologically reasonable ad hoc criteria as we already apply them here by removing singleton and duplicate sequences, or as deployed by nextstrain that removes sequences that are below a certain length threshold. In addition, nextstrain randomly subsamples sequences within predefined geospatial groups, to yield the inference process more computationally tractable. Second, one can deploy an inferred comprehensive phylogeny to guide the thinning process. We present and make available one MSA-based and one phylogeny-based thinning method in the following.
As with the criteria we applied for quality filtering the sequences, our thinning criteria solely focus on computationally improving the data quality and the signal in the data. They disregard biological thinning criteria such as maintaining the sampling time and geographical distributions and thus represent a possible best-case thinning scenario. More specifically, both thinning algorithms we describe below induce substantial shifts in the geographical distribution of the sequences. The inclusion of additional biological/geographical thinning criteria such as focusing on a specific country, region, and time period might therefore induce a reduction of data quality as the choices for selecting “good” representative sequences become more limited. As a consequence, phylogenetic inference will become more challenging. Nonetheless, the algorithms we present here can serve as a starting point for developing thinning methods that take into account both, computational as well as epidemiological criteria.
The first method which we term “maximum entropy” selects a given number of representative sequences from the alignment that maximize sequence diversity (as measured by their entropy). The second method which we term “support selection” relies on bipartition support values to identify a subset of sequences with more stable phylogenetic signal.
The “maximum entropy” method aims to represent the original MSA in n sequences that capture as much of its diversity as possible. The method, implemented in our GENESIS tool (Czech et al. 2020), takes as input an MSA and a target number n of sequences to select from that MSA. First, we select a “seed” sequence by finding the sequence in the MSA that is most different from a consensus sequence computed for the entire MSA; here, we measure the sequence difference as the number of nonidentical sites (i.e., the Hamming distance). We use this seed to initiate the algorithm with a sequence that is as different as possible from all others. Then, the remaining n − 1 sequences are iteratively added to the result sequence set. In each step, we select one sequence from the yet unselected sequences of the MSA and include it in the result sequence set. We select the new sequence such that it maximizes the average per-site entropy of the current result sequence set. Hence, in each step, we greedily maximize the diversity of the current result set, as measured by its entropy; see Czech et al. (2018) for details on the computation. The algorithm terminates once the result set contains n sequences (the initial seed, and n − 1 sequences chosen via entropy maximization), and then outputs the result set.
The “support selection” method takes as input an unrooted multifurcating consensus tree T (here either the SMSA-C/SMSA-CE or FMSA-C/FMSA-CE trees) with a support value associated to each internal branch/bipartition of the tree. We define the accumulated support value (ASV) of a tree as the sum of the support values over its internal branches. Our support selection method constructs a bifurcating tree by pruning subtrees from T such that the ASV of is maximized. If, for the sake of simplicity, we initially assume that T is rooted, we can traverse T in postorder: at each inner node, our algorithm selects the two children (subtrees) with the highest ASV, and calculates the ASV of the current node as the sum of the two selected children ASVs and the support value of the current bipartition. If the current node has more than two children (i.e., it is multifurcating), we prune the children that we did not select. If T is unrooted, we iterate over all possible inner nodes r of T, and consider each r as possible root of T. Note that each inner node r only constitutes a “virtual” root that is required to initiate the recursion, but that the bifurcating tree remains unrooted. In particular, all internal nodes of have three outgoing branches. This includes the specific virtual root r used for the recursion. Thus, when computing the ASV at the current virtual root r, we select three children subtrees instead of two. We then return the bifurcating tree for with the highest ASV.
A disadvantage of the “support selection” method is that we cannot control the number of taxa that we will prune. Consider, for instance, the scenario of a multifurcation with ten children subtrees of equal size (where the size of a subtree is the number of terminal nodes in the subtree). In this case, the “support selection” method will prune 8 of these subtrees.
A key question that arises is how we assess the quality of a tree thinning method and how we compare these methods against each other. In our study, we consider topological stability as quality criterion. More specifically, we assess if the reduced taxon set yields a higher topological stability in terms of pairwise relative Robinson–Foulds (RF) distances (Robinson and Foulds 1981) among the trees in the plausible tree set and a lower number of trees in the plausible tree set than a random thinning/subsampling of the taxa to the same number. The RF distance quantifies the difference between two tree topologies in terms of the number of induced splits (also called bipartitions) of the taxon set by inner branches that are not common to both trees. Thus, a distance of 100% means that they do not share any common split whereas a distance of 0% means that they share all splits and are hence identical. One main pitfall of the RF distance is that it treats all splits as having equal weight. Depending on the context of a study, the weight of splits located close to the tips or in the inner regions of the tree should be adjusted. We also assess if the thinned trees exhibit higher topological stability than the full trees on the comprehensive alignments that include all taxa.
Outgroup Rooting with EPA-NG
To place the pangolin and bat outgroups onto our inferred ingroup phylogenies (more specifically, the respective plausible tree sets: FMSA-P, SMSA-P), we use our evolutionary placement algorithm EPA-NG (Barbera et al. 2019) as it allows to place an arbitrary number of candidate outgroup sequences onto a given phylogeny after the ingroup inference. For each branch of the ingroup EPA-NG computes an outgroup placement probability via a likelihood weight ratio (LWR). The LWR indicates how probable it is that the outgroup is located somewhere along a specific branch. In other words, the methods implemented in EPA-NG allow to assess outgroup placement uncertainty and can help to answer the question if the pangolin and/or bat sequences constitute appropriate outgroups for the SARS-CoV-2 phylogeny.
As input, EPA-NG requires the ingroup tree, an MSA comprising the ingroup sequences (in this context called reference tree and reference MSA, respectively), and the outgroup sequences aligned against this reference MSA. For the alignments that included the outgroups (FMSAO, SMSAO) this is straightforward, as the outgroups are already aligned to the reference. To also assess the impact the specific MSA method has on the outgroup placements, we additionally deployed HMMER (Eddy 2011) to align the outgroups to the corresponding ingroup alignments (FMSA, SMSA) yielding two additional reference MSAs which we denote by FMSAO-HMMER and SMSAO-HMMER.
Furthermore, EPA-NG requires a strictly bifurcating input tree. This poses a challenge for trees containing multifurcations (FMSA-C, SMSA-C), as there exist alternative approaches to making such trees strictly bifurcating. To obtain a better understanding of the behavior of outgroup placements with EPA-NG in such cases, we performed placements on all trees in the respective plausible tree sets (FMSA-P, SMSA-P) that form the basis for the respective consensus trees. We evaluate the appropriateness of the bat and pangolin outgroups for each tree in the respective plausible tree sets individually by identifying the LWR of the best placement, as well as the entropy of the LWR distribution for a given outgroup.
We then summarize these values for the entire plausible tree set using the mean and SD.
We present these statistics separately for each of the four reference MSA versions (FMSAO, SMSAO, FMSAO-HMMER, SMSAO-HMMER) in the respective results section on rooting the virus phylogeny.
Rooting with RootDigger
To further assess the uncertainty of the root location via a mathematically distinct approach, we also performed analyses with our RootDigger tool (Bettisworth and Stamatakis 2020). RootDigger computes the likelihood of placing a root on every branch of an existing, strictly bifurcating tree topology using a nonreversible model of nucleotide substitution. This also allows to quantify root placement uncertainty, again, by calculating LWRs for each possible root placement in terms of root placement probabilities. As RootDigger represents an alternative to outgroup rooting (albeit outgroup rooting and RootDigger rootings agree on 50% of empirical data sets tested; Bettisworth and Stamatakis 2020), we only executed RootDigger on the FMSA-P and SMSA-P tree sets. As the input trees are large in terms of number of taxa, we also parallelized RootDigger using MPI (Message Passing Interface) to maximize throughput.
We applied RootDigger to evaluate the root placement uncertainty for 5% of the trees with the highest likelihood scores in the respective FMSA-P and SMSA-P tree sets. We only execute RootDigger on 5% of the best trees in the plausible tree sets due to excessive runtime requirements. As for EPA-NG, we subsequently calculate analogous summary statistics for the root placement probability distributions over the respective selected plausible trees.
Species Delimitation with mPTP
The mPTP (Kapli et al. 2017) tool implements a method for molecular species delimitation on given, rooted and strictly bifurcating phylogenies of barcoding or other marker genes via so-called multirate Poisson Tree Processes.
As such, it exclusively relies on the tree topology and the associated branch lengths to infer an ML-based delimitation. It can also sample candidate delimitations via an MCMC procedure. In a recent study, we have shown that mPTP can be successfully deployed to hepatitis type B and type C virus phylogenies for classifying subtypes (Serdari et al. 2019). To this end, we applied mPTP to all trees in FMSA-P and SMSA-P.
In general, mPTP requires a rooted strictly bifurcating input tree. If the tree is not rooted, mPTP will by default place a root in the middle of the longest branch of the tree. If one does not trust this rooting approach, one can also execute mPTP on all distinct possible rootings of a given unrooted tree. This is not an option provided by mPTP but needs to be explicitly scripted. To assess the impact of root selection on the species delimitation, we executed mPTP ML delimitations with all possible roots on all trees in the respective plausible tree sets (i.e., thousands of mPTP runs per plausible tree topology) via an appropriate script. We also executed delimitation runs with mPTP by rooting on the longest branch (i.e., one mPTP run per plausible tree) using the ML and MCMC procedures. Finally, note that mPTP is a purely computational and parameter-free tool for classifying sequences into subclasses that does not rely on the underlying sequence data. It does therefore differ from the standard virus classification and naming schemes that use the sequence data and either involve direct human intervention or require a plethora of ad hoc as well as subjective threshold parameters such as used for instance in the Pangolin tool (Rambaut et al. 2020) or for the nextstrain and GISAD naming schemes. Nonetheless, these more subjective naming schemes tend to yield reasonable classifications. As we show here, they currently appear to represent the only viable solution for devising such naming schemes.
Difficulties
Based on our experience with the development of likelihood-based phylogenetic inference tools, we expected the phylogenetic analyses to be numerically challenging because of the large number of highly similar sequences. In fact, the data set has a structure that is more similar to a typical population genetics data set than a phylogenetic data set because it exhibits, for instance, a high proportion of invariable sites. To this end, the key difficulty we expected were numerical instabilities associated with the short branch lengths.
Impact of the Minimum Branch Length Parameter Setting
We initially tested the impact of the minimum allowed branch length parameter setting on RAxML-NG and IQ-TREE log-likelihood scores on the April 8th snapshot of the full MSA. For this, we used the best-known ML tree, the Γ model of rate heterogeneity, and set blmax (i.e., the maximum branch length) as well as (i.e., the likelihood difference between successive numerical optimization steps used for stopping the optimization) to their default values (see fig. 1).
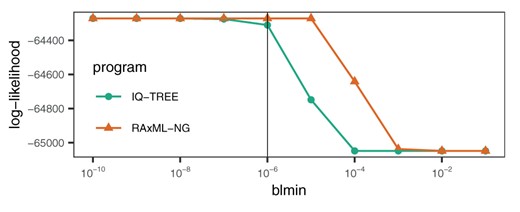
Log-likelihood scores of the best-scoring ML tree topology after model parameter (GTR, ML base frequencies, and Γ rate heterogeneity) and branch length optimization with the following (default) settings: blmax: 100, fast branch length optimization, : 0.1, and varying the indicated blmin (vertical line: default value of ).
With all these parameters fixed, we then maximized the ML score (by optimizing branch lengths and the remaining model parameters) of the fixed tree under different minimum branch length settings. We show the results of this experiment in figure 1. We observe that the minimum allowed branch length setting has a substantial impact on the resulting log-likelihood score. For instance, the default setting for IQ-TREE () yields a log-likelihood score that is 35 log-likelihood units worse than for . These small differences in log-likelihood scores can have detrimental impact, for instance, when assessing the significance of obtained topologies via the Shimodaira–Hasegawa (Shimodaira and Hasegawa 1999) likelihood ratio test. Initial experiments under GTR+FO+R4 yielded an analogous, yet even more distorted ordering of log-likelihood scores (data not shown).
Based on the results presented in figure 1, we therefore conducted all log-likelihood score calculations with IQ-TREE for determining the plausible tree set via the statistical significance tests as well as all tree searches with RAxML-NG using a minimum branch length setting of .
Unreliable Scores under the Free Rates Model
Runs of ModelTest-NG (Darriba et al. 2020) that we conducted on the SMSA and FMSA data sets for the final May 5th snapshot suggested that the best fit model for both data sets is GTR with an ML estimate of the base frequencies and a free rates model of rate heterogeneity.
It is common knowledge among developers of ML inference programs that the numerical optimization of the free rates model is difficult and that the optimization can become stuck in local optima.
To this end, we performed model parameter and branch length reoptimization on the 100 fixed ML trees inferred with RAxML-NG on the SMSA and FMSA data sets using the RAxML-NG tree evaluation function. In other words, we compare the final log-likelihood scores as obtained in the very end of 100 RAxML-NG tree searches with the log-likelihood scores as recalculated/optimized with RAxML-NG on the very same final, fixed ML trees. We conducted ML tree searches and reoptimization under the GTR model with an ML estimate of the base frequencies and the four free rates that accommodate rate heterogeneity (GTR+FO+R4).
To assess log-likelihood score discrepancies, we calculated the Spearman rank correlation on the resulting log-likelihood scores obtained from RAxML-NG tree searches and RAxML-NG tree evaluations for the same set of 100 ML trees. We show the log-likelihood score correlation in figure 2.
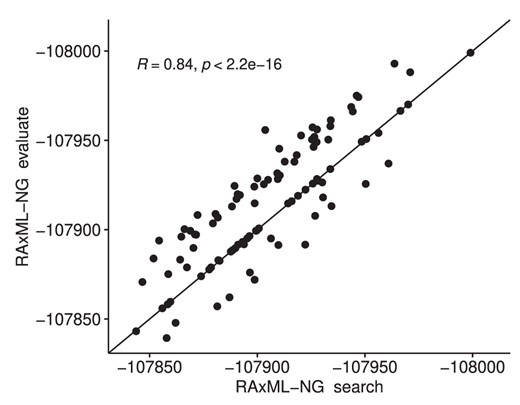
Spearman rank correlation of RAxML-NG tree search and RAxML-NG evaluation mode log-likelihood scores under the free rates model on a set of 100 ML tree topologies on the FMSA data set.
The obtained correlation of merely 0.84 between the RAxML-NG tree search and RAxML-NG evaluation mode log-likelihood scores on the FMSA data set for exactly identical tree topologies under exactly the same model of evolution indicates that the free rates model should not be used for the full SARS-CoV-2 data set. An analogous experiment with IQ-TREE (fig. 3) yielded a rank correlation of 0.72 for the free rates model on the FMSA data set. However, on the SMSA data set, the respective rank correlations under the free rates model improved to 1.0 (RAxML-NG) and 0.95 (IQ-TREE). This indicates that our singleton-removal strategy helps to improve the numerical stability of inferences under the free rates model on the SMSA data set. In addition, this observation will allow for a more targeted analysis of the underlying causes for the observed behavior. In general, we assume that this behavior is due to the fact that the free rates optimization is invoked several times during the IQ-TREE and RAxML-NG tree searches on intermediate and hence distinct tree topologies. Thus, the optimization of the free rates on the final tree of the tree search is initiated with distinct (often better) starting values than in the stand-alone from scratch tree evaluation. Because of local optima in the free rates optimization, the resulting log-likelihood score is therefore sometimes worse, yet often better for the scores obtained by the tree searches. This holds for RAxML-NG and IQ-TREE. In addition, the presence of singletons appears to increase the number of local optima in the free rates optimization landscape. Finally, the numerical stability of the model should be reviewed in general on a broader benchmark of empirical data sets.
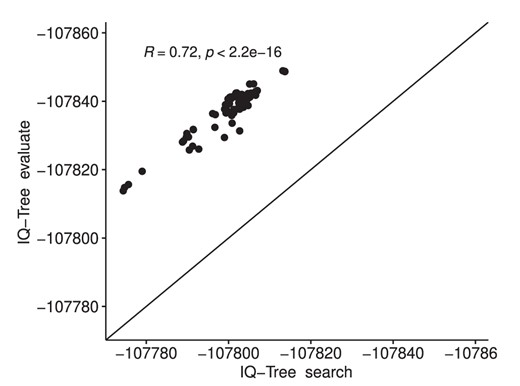
Spearman rank correlation of IQ-TREE tree search and IQ-TREE evaluation mode log-likelihood scores under the free rates model on a set of 100 ML tree topologies on the FMSA data set.
To ensure that this behavior is model-specific and not data set-specific, we also conducted an analogous test under the Γ model of rate heterogeneity with four discrete rates (GTR+FO+G). The corresponding Spearman rank correlations for RAxML-NG and IQ-TREE are both 1.0 on the FMSA data set, and 1.0 and 0.98 on the SMSA data set, respectively. We therefore conclude that the Γ model of rate heterogeneity should be used for analyzing the SARS-CoV-2 data set with RAxML-NG or IQ-TREE.
Results
Tree Inference
This ratio measures to which degree a tree is resolved. For instance, r(T) is equal to 0.0 for a star topology and equal to 1.0 for a fully bifurcating (fully resolved) tree.
Overall, we computed six metrics on the distinct trees and tree sets inferred on the four different MSA versions. We summarize these metrics in table 1. For each metric, we obtained approximately identical values for all four MSA versions. Thus, removing singletons does not appear to improve the stability of the inferred trees, albeit the reduced taxon set can facilitate visualization and interpretation.
Moreover, for all MSA versions, we inferred 100 distinct topologies from the 100 ML searches (i.e., the signal was so weak that we did not recover a single tree topology twice). Furthermore, the ML tree topologies per MSA are highly different among each other with an average pairwise relative RF distance of approximately 78%. Despite these large RF distances and due to the aforementioned pitfalls of the RF distance metric, we do observe some signal near the tips of the plausible tree set in the respective consensus tree.
In contrast, the relative RF distance between the respective parsimony starting trees and the corresponding final ML trees of individual searches is comparatively low (ranging between 0.11 to 0.13). This indicates that every ML tree search quickly reaches a local maximum and that all MSA versions induce a high number of local maxima. In general, approximately 75 out of 100 inferred ML trees per MSA end up in the respective plausible tree sets. This shows that it is difficult, if not impossible, to distinguish among the topologically highly diverse ML trees from 100 searches via statistical significance tests. Hence, it does not appear reasonable to represent the results in the form of a single ML tree, as 75% of the inferred trees are statistically indistinguishable.
We further found that the MR consensus trees (FMSA-C and SMSA-C) we computed from the plausible tree sets are poorly resolved and only contain but a few bifurcating internal nodes. The MRE trees (FMSA-CE and SMSA-CE), which attempt to construct bifurcating tree topologies via a greedy heuristic strategy (note that constructing the optimal MRE consensus with maximum support is NP-hard) still contain a high number of multifurcating nodes. Nonetheless, they do show an improved degree of resolution (r(T)) by a factor of 4–5 compared with the MR trees which simplifies their visual interpretation.
Overall, we find that the ML tree topologies in the plausible tree sets are topologically divergent which substantiates our claims that the data set is hard to analyze, as it exhibits a weak phylogenetic signal and a rugged likelihood surface. Our experiments also show that results of phylogenetic analyses of these data can and should not be represented via a single ML tree. Our findings contradict a recent study (Mavian et al. 2020) that finds that there is sufficient phylogenetic signal in the data. This study relies on the so-called likelihood mapping technique that only evaluates quartets (subsets of four sequences) to quantify the signal. Therefore, the aforementioned numerical issues associated with a full tree search on a comprehensive MSA did not become apparent in that study. Finally, we observe that the specific MSA version used does not have any notable effect on the resulting tree set.
In the following, we briefly discuss the virological conclusions that we can draw by example of the FMSAO-CE tree.
The FMSAO-CE consensus tree (see fig. 4) suggests that the clades that occur frequently in the respective plausible tree set () consist predominantly of SARS-CoV-2 sequences sampled from the same geographic area or neighboring countries. Specifically, we find large monophyletic clusters from a single country or geographic area such as the United States, India, Hong Kong, Shanghai, Korea, Iceland, Wales, Scotland, England, Australia, Belgium, Luxembourg, the Netherlands, and France. We detected the largest clusters for the United States and England. Moreover, we observe clusters including sequences from neighboring geographic areas, for example, Wales–England–Scotland, Luxembourg–Belgium, Belgium–the Netherlands, Scotland–Iceland. We observe two additional characteristic patterns: (i) clusters where the majority of sequences are from a single country and (ii) clades including viral sequences sampled from diverse locations. The type (i) clusters include Sweden–Wales–England, Australia–the United States, England–Australia, England–Russia–Australia–Hungary–the Netherlands–the United States. The more diverse type (ii) clusters are smaller in size and comprise viral sequences sampled at diverse locations.
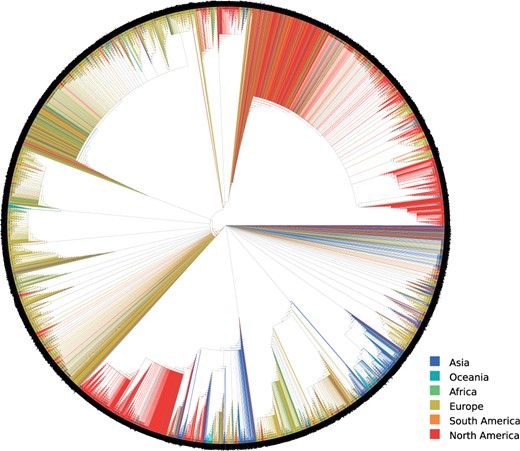
Extended majority rule consensus tree (FMSAO-CE) of the plausible tree set of the FMSAO alignment. We colored the tree by the region of origin of each sequence.
The observed patterns suggest that clustering and thus spread occurred mainly according to geographic location at the time our data snapshot was taken (human mobility was severely limited due to lock-downs in numerous countries). This finding is compatible with the diseases spread through respiratory particles, but also across different countries and remote locations following the patterns of human mobility. The results of nextstrain analyses, where major clades were detected for the United States and other regions, but also a considerable number of cross border transmissions was reported, support our findings. Notably, our and other analyses are limited by the available data sampling. The lack of large monophyletic clusters for several geographic areas is probably due to the limited availability of data from the respective countries.
We used the Pangolin tool (Rambaut et al. 2020) for superimposing a naming scheme onto the MRE consensus tree (FMSAO-CE) of the plausible tree set for the FMSAO data set in figure 5. We chose the pangolin tool, as it is easy to use and the three alternative naming schemes implemented in GISAID, nextstrain, and the Pangolin tool do not appear to exhibit major differences (Alm et al. 2020). Moreover, the Pangolin tool provides the most fine-grained classification scheme.
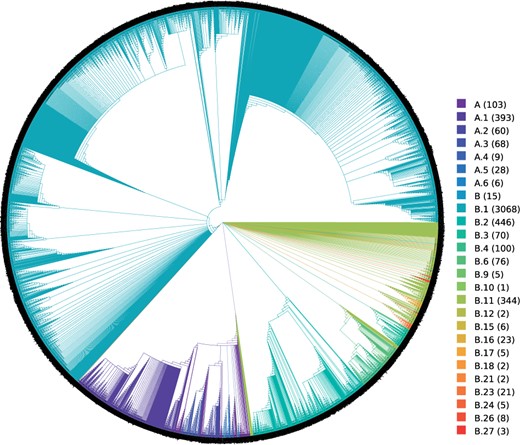
Pangolin tool lineages displayed on the extended majority rule consensus tree (FMSAO-CE) of the plausible tree set for the FMSAO data set. We color the tree by Pangolin tool lineages. The numbers in parentheses next to the pangolin tool lineage labels indicate the number of taxa in the tree per lineage.
Most of the sequences were classified within lineage B (N = 4,202, 86.3%), with the remaining falling within lineage A (N = 667, 13.7%) The phylogenetic clustering is mostly congruent with the distinct haplotypes, that is, major branches are differently colored. More specifically, the B1 lineage, that is the most frequent with 3,068 sequences (63.0% of the sample), forms a distinct group. The sequences of the A lineage (A, through ), that includes sequences from the early stages of the pandemic in China, also cluster according to their sublineage classification. We observe a similar clustering for the sequences of lineage B. To investigate if the sequences within the highly supported clades belong to the same lineage, we inspected 17 highly supported clusters and found that almost all sequences within each such cluster from part of the same lineage. Thus, our findings indicate that the outbreak lineages as identified by the Pangolin tool are, to a large extent, congruent with the structure and highly supported clusters of the MRE consensus tree computed on the plausible tree set of the FMSAO data set.
Tree Thinning
For the sake of simplicity, we executed both thinning methods only on FMSA and SMSA. We executed the support selection thinning method on the respective MRE consensus trees (FMSA-CE, SMSA-CE) instead of the MR consensus tree, as it yielded a thinned tree comprising an order of magnitude fewer taxa. As the MR consensus comprised too many multifurcations, it yielded too small thinned alignments (comprising fewer than 50 taxa) that were not apt for biological interpretation. As maximum entropy thinning does not require a tree as an input (see description of the method above), we executed it directly on the FMSA and SMSA alignments.
Finally, we also executed a naïve thinning by randomly removing a given number of sequences from the initial SMSA and FMSA alignments, to assess if our two thinning approaches perform better than random thinning.
For improved clarity, we introduced the following notations for the different thinned alignments we computed:
F-SST: alignment obtained from the FMSA alignment using support selection thinning.
F-MET: alignment obtained from the FMSA alignment using maximum entropy thinning.
F-RAND: alignment obtained from the FMSA alignment using random thinning.
FMSA-SS-P: plausible tree set of F-SST.
S-SST: alignment obtained from the SMSA alignment using support selection thinning.
S-MET: alignment obtained from the SMSA alignment using maximum entropy thinning.
S-RAND: alignment obtained from the SMSA alignment using random thinning.
SMSA-SS-P: plausible tree set of S-SST.
We calculated the same quality metrics as used for the tree inferences on the comprehensive nonthinned MSAs for the thinned MSAs in table 2. We find that the stability of tree inferences is slightly improved by support selection thinning and maximum entropy thinning. The average relative RF distance between all 100 inferred ML trees decreases on all four alignment versions from approximately 0.78 down to 0.67 using support selection thinning and down to 0.63 via maximum entropy thinning. The resolution (r(T)) of the consensi improves for support selection thinning as well as maximum entropy thinning. The better MRE resolution of support selection thinning versus maximum entropy thinning is due to the design of the support selection algorithm that uses the MRE on the comprehensive tree as an input. In other words, the method works as intended. Further, we can reduce the size of the plausible tree set by approximately 40–50% with both approaches. Nonetheless, the substantial reduction in the number of taxa by these thinning approaches does not alleviate the problem of weak signal and multiple ML optima.
Metrics for the Thinned Alignment Versions.
| Metric | F-SST | F-MET | F-RAND | S-SST | S-MET | S-RAND |
|---|---|---|---|---|---|---|
| Taxa | 912 | 912 | 912 | 434 | 434 | 434 |
| ML trees RF | 0.67 | 0.66 | 0.77 | 0.68 | 0.63 | 0.79 |
| Search RF | 0.19 | 0.20 | 0.15 | 0.21 | 0.21 | 0.18 |
| Plausible trees | 39 | 45 | 73 | 31 | 47 | 59 |
| MR resolution | 0.166 | 0.218 | 0.144 | 0.164 | 0.245 | 0.141 |
| MRE resolution | 0.918 | 0.842 | 0.72 | 0.912 | 0.85 | 0.72 |
Note.—Taxa is the number of taxa in the alignment. ML trees RF is the average relative RF distance between all 100 inferred ML trees. Search RF is the average relative RF distance between the parsimony starting trees and the final ML trees of the respective tree searches on these starting trees. Plausible trees represents the number of trees (out of 100) in the plausible tree sets. MR and MRE resolutions are the resolution ratios (see definition in the text) of the MR and MRE trees computed on the plausible tree sets.
Finally, we find that support selection thinning and maximum entropy thinning perform consistently better than random thinning.
Rooting
In tables 3 and 4, we present the results for the outgroup rooting analyses using EPA-NG for the pangolin and bat outgroup sequences, respectively.
EPA-NG Root Placement Probability and Entropy Statistics for the Pangolin Outgroup Sequence over All Trees in the Respective Plausible Tree Sets for Distinct MSA Versions.
| Alignment | Max LWR | LWR Entropy | ||
|---|---|---|---|---|
| Mean | SD | Mean | SD | |
| FMSAO | 0.033 | 0.001 | 5.332 | 0.010 |
| FMSAO-HMMER | 0.034 | 0.000 | 5.325 | 0.010 |
| SMSAO | 0.647 | 0.010 | 2.074 | 0.046 |
| SMSAO-HMMER | 0.001 | 0.000 | 5.634 | 0.000 |
| Alignment | Max LWR | LWR Entropy | ||
|---|---|---|---|---|
| Mean | SD | Mean | SD | |
| FMSAO | 0.033 | 0.001 | 5.332 | 0.010 |
| FMSAO-HMMER | 0.034 | 0.000 | 5.325 | 0.010 |
| SMSAO | 0.647 | 0.010 | 2.074 | 0.046 |
| SMSAO-HMMER | 0.001 | 0.000 | 5.634 | 0.000 |
Note.—Highlighted in italics is the highest confidence signal, which is the only among all tested data sets to reach >0.04 mean LWR.
EPA-NG Root Placement Probability and Entropy Statistics for the Bat Outgroup Sequence over All Trees in the Respective Plausible Tree Sets for Distinct MSA Versions.
| Alignment | Max LWR | LWR Entropy | ||
|---|---|---|---|---|
| Mean | SD | Mean | SD | |
| FMSAO | 0.037 | 0.001 | 5.437 | 0.009 |
| FMSAO-HMMER | 0.037 | 0.001 | 5.438 | 0.008 |
| SMSAO | 0.025 | 0.001 | 5.378 | 0.006 |
| SMSAO-HMMER | 0.004 | 0.000 | 5.546 | 0.013 |
| Alignment | Max LWR | LWR Entropy | ||
|---|---|---|---|---|
| Mean | SD | Mean | SD | |
| FMSAO | 0.037 | 0.001 | 5.437 | 0.009 |
| FMSAO-HMMER | 0.037 | 0.001 | 5.438 | 0.008 |
| SMSAO | 0.025 | 0.001 | 5.378 | 0.006 |
| SMSAO-HMMER | 0.004 | 0.000 | 5.546 | 0.013 |
We present the mean placement probability (likelihood weight) and its SD for the most likely placements of all trees contained in the respective plausible tree sets obtained for the comprehensive MSAs. Remember that FMSAO and SMSAO stand for alignments conducted with MAFFT including the outgroups, whereas FMSAO-HMMER and SMSAO-HMMER represent the ingroup MSAs (excluding the outgroups) to which we subsequently aligned the outgroup sequences via hmmalign in a separate step. We did this to assess the potential impact of the alignment procedure onto the placement result. Note that, a mean placement probability value of 0.033 represents a placement probability of the outgroup onto the most likely branch of the reference phylogeny amounting to 3.3%. To further characterize the LWR distribution over the branches of the tree, we computed the mean and SD of the entropy, calculated across each LWR distribution of the outgroup on a given tree (see subsection Outgroup Rooting with EPA-NG).
As tables 3 and 4 show, support for an outgroup rooting using either the bat or the pangolin sequence was generally low (<0.04). The only exception is a possible well-supported pangolin-based rooting of the plausible trees in the SMSAO data set. This is surprising, as, with the exception of a small fragment in the spike protein, the pangolin is more divergent from the ingroup than the bat. For this specific alignment, EPA-NG yielded a well-supported placement of the pangolin outgroup for all plausible trees, yet always residing on the terminal branch leading to sequence EPI_ISL_411956 (GISAID accession). Although this sequence is among the early sequences of the pandemic, a placement of the root on the branch leading to it, does not appear to be epidemiologically plausible.
This is because, this strain has been collected in the United States on February 11, 2020 and is not among the viral strains isolated at the early stage of the pandemic in Asia that are included in our analysis. More specifically, although the sequence EPI_ISL_411956 has been assigned to lineage A (see https://cov-lineages.org/ and Rambaut et al. 2020; corresponding to lineage 19B and S according to the nextstrain and GISAID classifications, respectively) which is considered as the root lineage of the pandemic, it is not among the earliest sampled sequences from China and other Asian regions in our analyses. As suggested before (Gómez-Carballa et al. 2020), the sequences sampled during the early stage of the pandemic in Asia are considered as being the most plausible ones for rooting the tree.
Further, this specific root placement also appears to also be computationally implausible, as the placement signal was only present in one out of the four MSA versions. After pruning EPI_ISL_411956 from SMSAO-B and SMSAO and subsequently recalculating the pangolin placement, the placement confidence was lower (0.176). In addition, the new placement location with 0.176 support is located at a large distance to the initial highly supported location of EPI_ISL_411956. The path length, in terms of inner nodes along the tree, between the initial and the new placement location amounts to 105 inner nodes.
As we suspected that the confident placement of the pangolin constitutes an artifact of the alignment process, we repeated the MSA procedure under distinct settings. Initially, we removed the bat outgroup from the initial set of unaligned sequences. This yielded an increased LWR (Mean 0.87, SD 0.002) for placing pangolin on the branch leading to EPI_ISL_411956. Second, we added two additional bat outgroup sequences (MG772933 and MG772934) to the unaligned sequence set. Although this lowered the LWR of the pangolin placement (Mean 0.206, SD 0.01, again located on the branch leading to EPI_ISL_411956), the signal was still considerably stronger than for all other outgroups and MSA versions. A visual inspection of the SMSAO alignment to identify the reasons for the strong pangolin placement signal was inconclusive. The same holds true for an inspection of the per-site log-likelihood values for pangolin placements into distinct branches (including the highly supported one) of the corresponding best ML tree (SMSAO-B).
Overall, despite our efforts, we were not able to disentangle the reasons behind this strong, yet epidemiologically implausible placement of the pangolin. The additional experiments we conducted using alternative outgroups indicate that this is potentially due to an alignment artifact in just one out of the four alignment versions we scrutinized. Hence, not only the tree inference itself but also the alignment strategy used can impact the results of phylogenetic postanalyses of SARS-CoV-2.
In an additional experiment, we assessed if one of the early sequences from Wuhan (EPI_ISL_406801 Wuhan/WH04/2020) can be used for rooting. As it was initially filtered out in the MSA assembly step, we first aligned it to all four ingroup MSA versions via hmmalign and subsequently computed placement weights for inserting it into all branches of all ingroup phylogenies in the respective plausible tree sets using EPA-NG. We found that there is no strong signal in terms of placement weight (maximum mean LWR among all four MSA versions of 0.02) for confidently placing this early Wuhan sequence onto the tree.
We present our results for the root placement certainty as calculated with the RootDigger tool on the ingroup phylogeny in table 5. We executed RootDigger searches on the four plausible tree sets inferred on the FMSA, SMSA, FMSA-SS, SMSA-SS (thinned FMSA, and SMSA alignments with support selection thinning, see previous section). As mentioned above, we performed RootDigger analyses only on the top 5% of the trees in the respective plausible tree sets due to excessive runtimes. This resulted in performing rooting analysis on eight trees from FMSA-P, four trees from FMSAN-SS-P, eight trees from SMSA-P, and four trees for SMSA-SS-P. We used the same method to calculate the LWR entropy of RootDigger root placements as for the EPA-NG results above.
Results of RootDigger Analysis for Different MSA Versions.
| Alignment | Max LWR | LWR Entropy | ||
|---|---|---|---|---|
| Mean | SD | Mean | SD | |
| FMSA | 0.240 | 0.006 | 8.053 | 0.059 |
| FMSA-SS | 0.041 | 0.001 | 7.872 | 0.036 |
| SMSA | 0.613 | 0.038 | 4.279 | 0.474 |
| SMSA-SS | 0.101 | 0.002 | 7.327 | 0.023 |
| Alignment | Max LWR | LWR Entropy | ||
|---|---|---|---|---|
| Mean | SD | Mean | SD | |
| FMSA | 0.240 | 0.006 | 8.053 | 0.059 |
| FMSA-SS | 0.041 | 0.001 | 7.872 | 0.036 |
| SMSA | 0.613 | 0.038 | 4.279 | 0.474 |
| SMSA-SS | 0.101 | 0.002 | 7.327 | 0.023 |
Note.—Because of excessive runtimes, for every data set, we only analyzed the 5% of trees with the highest likelihood with RootDigger in exhaustive mode. To further summarize the results, we also compute the entropy of the LWR distributions for each resulting tree and report the average for each data set. The results are averages over the included plausible trees. Highlighted in italics is the highest confidence signal.
Although the root inferences on the thinned MSAs do not yield strong signal for any particular root placement, this is not the case for the original alignments. In particular, we obtain a strong average (over the eight trees with the highest likelihood score) root placement signal for a specific root on the SMSA alignment which we discuss in further detail below.
To this end, we visually inspected the eight rooted trees for SMSA as inferred with RootDigger. For two out of eight trees (trees 1 and 2, trees are labeled ), we observed an epidemiologically plausible root placement, since among the sequences which cluster close to the inferred root, there are several from Wuhan and other Asian areas sampled during the early phase of the pandemic. We show the respective rooted ML tree number 2 colored by geographic regions in figure 6. Nonetheless, we obtained such a virologically plausible root placement with RootDigger only for 25% of the rooted trees and only for one out of four alignment versions. Hence, the plausibility of the root placement heavily depends on the selected MSA version as well as selected tree from the plausible tree set and the results cannot be generalized.
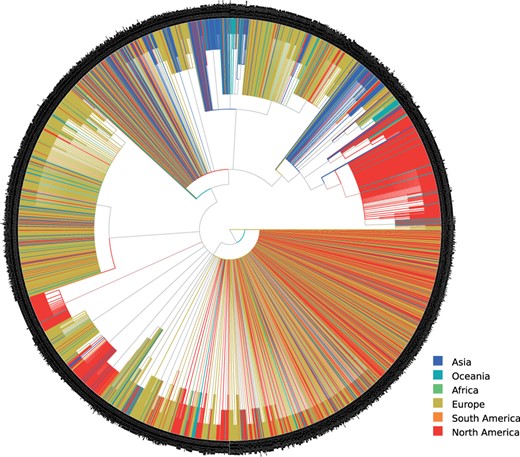
Rooted SMSA Maximum Likelihood tree number 2. We color the tree by geographic regions and root it via RootDigger using a nonreversible model of nucleotide substitution. The tree inference randomly resolved multifurcations by introducing branches of length zero. For visualization purposes, we collapsed these branches, hence yielding a multifurcating tree again.
The same holds for the outgroup placements with EPA-NG. Here, although we do again observe a relatively strong signal only on one out of four alignment versions, the outgroup placement location does not appear to be virologically plausible. Thus, we conclude that the root of the SARS-CoV-2 phylogeny cannot be reliably determined via the methods we have applied here. An independent study on root placement using distinct computational methods comes to analogous conclusions (Pipes et al. 2020). A further study (Gómez-Carballa et al. 2020) concludes that it is difficult yet not impossible, whereas Andersen et al. (2020) propose two main hypotheses for the origin of the pandemic.
mPTP
The mPTP runs on all plausible tree sets using the longest branch rooting option and either the ML delimitation or the MCMC delimitation procedures yielded a species count of 1. This means that mPTP in default mode cannot distinguish if there is one species or if there are n species, where n is the number of taxa in the given phylogeny.
The mPTP runs that explored all possible rootings on all plausible tree sets under the ML delimitation option exhibit a large variance in results.
We show a representative histogram for the SMSA-P set of plausible trees in figure 7 for the median number of delimited species over all possible rootings per plausible tree. The results on the remaining data sets were analogous (data not shown). The maximum number of delimited species for all rootings per tree in SMSA-P ranged between 198 and 781 with a flat distribution (i.e., two identical maximum species counts appeared 9 times, and three identical ones only once). The minimum number of delimited species was 1 for all trees in SMSA-P.
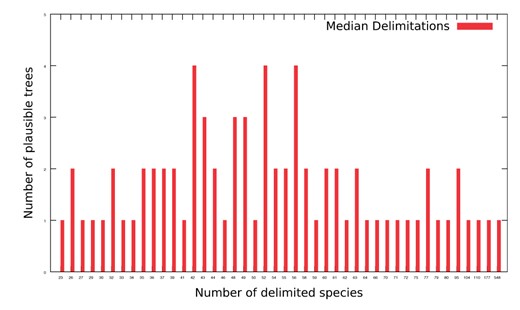
Median number of delimited species over all possible rootings per plausible tree in SMSA-P.
We hence conclude that mPTP cannot be used to delimit distinct subclasses of the virus as the default mode (rooting at the longest branch) consistently yielded inconclusive delimitations. Further, as shown by our experiments that evaluate all possible rootings, the number of delimited species exhibits a large variance as a function of the root position and is hence also inconclusive. Given that, the trees can, in general, not be reliably rooted, we conclude that we cannot delimit/classify the viral sequences using mPTP. Other authors have also put into question our ability to identify distinct virus types using alternative computational methods (MacLean et al. 2020).
Discussion
We studied the intrinsic difficulties of inferring and postprocessing phylogenetic trees on the May 5 snapshot of the available whole-genome data for SARS-CoV-2. To quantify the impact of distinct filtering and alignment strategies, we use four different alignment versions throughout our analyses.
We find that the tree search task per se is difficult due to the rugged likelihood surface that exhibits a multitude of local optima. We cannot distinguish among the majority of these local optima via standard statistical significance tests and observe large pairwise topological differences that exceed 70%. We therefore suggest that instead of using and displaying a single tree one should compute summary statistics on a “plausible tree set” that comprises the indistinguishable local maxima of the tree search space that were found by the respective search algorithm.
Although the clustering in the consensus tree in figure 4 appears to segregate well by region, several nodes receive low support. Therefore, our confidence regarding the observed clusters is not high, despite the fact that they appear to be epidemiologically plausible and do contain sequences sampled from the same geographic region. As we generally advocate for being cautious when interpreting results, we solely assess if the highly supported clades comprising sequences from a single geographic area match epidemiological expectations. We find that there do exist some plausible clusters that are well supported and appear to be insulated from the substantial data analysis challenges we describe. In addition, the phylogenetic tree structure is mostly concordant with the lineage scheme inferred via the Pangolin tool (see fig. 5).
Beyond these computational challenges, biological phenomena such as homoplasies, convergent evolution, and potential recombination events may constitute another key contributing factor for observing numerous indistinguishable local ML optima. Yet, the phenomenon of rugged likelihood surfaces has also been observed for empirical data sets that are less prone to the aforementioned phenomena.
Another challenge is that, since downloading our data snapshot in May, tens of thousands of additional genomes have been sequenced and uploaded surpassing 167,000 at present (https://www.gisaid.org/, accessed October 30, 2020). Therefore, likelihood-based analyses of these data currently also face substantial computational challenges, yet tools such as FastTree (Price et al. 2010) might still be able to handle them. Given the increased number of sequences in conjunction with the already weak signal in our data snapshot, we expect the issues described here to become even more prevalent for the currently available data. Furthermore, more advanced tree thinning strategies than presented here need to be developed. In addition, a plausibility assessment via visual inspection of respective consensus trees and identifying clustering patterns for geographic regions as conducted here might not be feasible any more. This is because mobility increased substantially with the end of lock-downs in numerous countries around May and June 2020.
Although using an ML approach to infer trees, our postanalysis strategy rather follows a Bayesian paradigm. Thus, the question arises if one could use Bayesian inference via MCMC methods directly. Because of the size of the data sets, their lack of signal, and the large number of taxa we expect MCMC analyses to require excessive runtimes to reach and explore some of the peaks we identified with the more targeted ML searches. In addition, our experience, based on user interactions, is that MCMC analyses are more difficult to properly set up and interpret than ML analyses, especially on such a challenging data set that requires a profound understanding of the underlying methods.
To this end, the current common practice of inferring SARS-CoV-2 phylogenies under the default search parameters of standard ML inference tools corresponds to randomly picking (without potentially being aware of it) a tree from the plausible tree set. Due to the large topological variations, the respective conclusions that we draw can constitute a product of pure chance.
Beyond this, we also identified substantial numerical issues pertaining to the optimization of branch lengths and the rates in the free rates model of rate heterogeneity. Branch length optimization is problematic because the sequences are highly similar and, as a consequence, the branch lengths are short. Thus, assessing the effect of the minimum branch length setting in ML inference tools on the results constitutes a necessary prerequisite for conducting thorough phylogenetic analyses of these data. The issues associated with the parameter optimization in the free rates model are likely to not only occur on difficult data sets but we believe that they become more prevalent on such.
We also address the problem of reducing the size of the plausible tree sets in the hope that a reduction in size will induce a decrease of average pairwise RF distances and an increase of consensus tree resolution, thereby simplifying the interpretation and postanalyses. In addition, we can also interpret a reduction of the plausible tree set size as an indicator of stronger signal. To this end, we introduce and test two novel tree thinning algorithms that strive to maximize the entropy and support of the thinned alignments and respective trees. Although these algorithms do reduce the size of the plausible tree sets and perform better than random thinning, the plausible tree sets still remain comparatively large (comprising approximately 40 out of 100 ML trees) and diverse (average pairwise topological RF distance among the plausible trees slightly <70%).
Overall, we believe that using an MRE consensus tree inferred on the plausible tree sets represents a reasonable approach to carefully interpreting the results by taking into account the ruggedness of the tree search space. For certain epidemiological assessments, it will suffice if the branching order near the tips of the phylogeny is well resolved.
With respect to postanalyses, we find that rooting the trees either via outgroup placement or by using nonreversible models of evolution does not yield a clear root position. Obtaining an epidemiologically reasonable root with some statistical support appears to be a matter of chance: it depends on the specific tree topology used for conducting the rooting analysis, which we selected from the plausible tree set inferred from one specific alignment. With respect to outgroup placement, the single strong, yet epidemiologically implausible signal was also observed on one specific alignment version only. We cannot draw general, nor confident conclusions about the position of the root using the two mathematically highly distinct approaches that we have deployed here. This confirms analogous independent findings (Pipes et al. 2020).
Finally, we find that distinct viral subclasses cannot be identified by executing our mPTP tool for molecular species delimitation on all trees in the respective plausible tree sets of all four alignment versions.
Conclusions
Phylogenetic analysis of SARS-CoV-2 data is challenging due to numerical difficulties and the rugged likelihood surface. Therefore, we strongly advocate against naïvely using the default parameters of common ML programs to just infer “a tree” and using this single tree for epidemiological interpretation or any type of postanalysis.
We are also skeptical about the utility of computing bootstrap support values, as the data sets as such only contain a low number of distinct site patterns while containing thousands of taxa. One should preferably invest computational effort to more exhaustively sample the rugged likelihood surface which already constitutes a source of large topological variability.
As the phylogenetic signal is weak, we suggest using a plausible tree set comprising all ML trees from independent tree searches that we cannot distinguish from each other via the standard phylogenetic significance tests, but that does adequately represent the rugged tree search space.
In analogy to summarizing results from Bayesian tree inferences, we suggest to use this plausible tree set for computing summary statistics on the trees such as the MR or MRE consensi. Also, we should conduct and summarize all potential postanalyses on such plausible tree sets to better capture topological uncertainty and circumvent potential misinterpretations that can be caused by randomly picking a tree from the plausible tree set.
To this end, we believe that we need to develop novel methods that can automatically summarize such plausible tree sets. In addition, there is a need for theoretical work on criteria to identify data sets that exhibit rugged likelihood surfaces, as the term is admittedly colloquial and vague at present. Ideally, phylogenetic inference programs should be able to identify such difficult data sets and either warn the users about it or by default conduct multiple ML searches and automatically return a plausible tree set.
Supplementary Material
Supplementary data are available at Molecular Biology and Evolution online.
Acknowledgments
Part of this work was funded by the Klaus Tschira Foundation and through the EU IGNITE ITN project. We wish to sincerely thank all scientists and submitting laboratories (supplementary acknowledgment table, Supplementary Material online) involved in collecting, processing, and depositing SARS-CoV-2 sequence data as well as meta-data on GISAID.
References
Author notes
Benoit Morel and Pierre Barbera authors contributed equally to this work.
