


Abstract
Simple satellites are tandemly repeating short DNA motifs that can span megabases in eukaryotic genomes. Because they can cause genomic instability through nonallelic homologous exchange, they are primarily found in the repressive heterochromatin near centromeres and telomeres where recombination is minimal, and on the Y chromosome, where they accumulate as the chromosome degenerates. Interestingly, the types and abundances of simple satellites often vary dramatically between closely related species, suggesting that they turn over rapidly. However, limited sampling has prevented detailed understanding of their evolutionary dynamics. Here, we characterize simple satellites from whole-genome sequences generated from males and females of nine Drosophila species, spanning 40 Ma of evolution. We show that PCR-free library preparation and postsequencing GC-correction better capture satellite quantities than conventional methods. We find that over half of the 207 simple satellites identified are species-specific, consistent with previous descriptions of their rapid evolution. Based on a maximum parsimony framework, we determined that most interspecific differences are due to lineage-specific gains. Simple satellites gained within a species are typically a single mutation away from abundant existing satellites, suggesting that they likely emerge from existing satellites, especially in the genomes of satellite-rich species. Interestingly, unlike most of the other lineages which experience various degrees of gains, the lineage leading up to the satellite-poor D. pseudoobscura and D. persimilis appears to be recalcitrant to gains, providing a counterpoint to the notion that simple satellites are universally rapidly evolving.
Introduction
Most eukaryotic genomes harbor vast quantities of two types of repetitive DNA: transposable elements and satellite DNA. Transposable elements can both move around the genome and increase their copy number, because they typically encode the proteins required for self-propagation through excision/insertion or copy/insertion mechanisms. Satellite DNA, on the other hand, is composed of noncoding sequences that are tandemly repeating thousands to millions of times. The repeating motif can range from <10 bp, creating simple satellites, to hundreds of base pairs, creating complex satellites. Copy number increases are thought to primarily involve homology-directed unequal crossing-over between alleles on either the sister chromatids or the homologous chromosomes, producing both truncated and extended copies (Smith 1976; Stephan 1986). Satellite DNA can additionally undergo intrastrand exchange creating loop deletions due to its tandem repetitive nature (Walsh 1985; Charlesworth et al. 1986), but this process may also result in rolling circle amplification and subsequent reinsertion of the looped DNA (Rossi et al. 1990).
Along with TEs, the ability of satellites to expand and persist in genomes has garnered them the names “selfish” elements and genomic “parasites” (Doolittle and Sapienza 1980; Orgel and Crick 1980). The high copy number, however, is not without consequences, as satellite DNA creates many opportunities for misdirected crossing-overs. These events can cause genome instability and devastating genomic rearrangements when homologous satellite blocks are scattered across multiple loci (Sasaki et al. 2010). Although satellites can propagate rapidly in populations, even when they reduce host fitness (Hickey 1982), much of their deleterious potential is mitigated by restricting them to heterochromatic regions of the genome that are repressive and lack recombination, predominantly around centromeres and telomeres. When heterochromatin formation or maintenance is disrupted due to the loss of the requisite proteins, the number of double strand breaks and amount of extrachromosomal circular DNA increase, along with disorganized nucleoli and dispersed chromatin (Peng and Karpen 2007, 2009).
Given the strong repressive effects of heterochromatin, one might expect satellites to be relatively inert to change. Contrary to this expectation, in many taxa including flies, primates, plants, and worms, closely related species often have dramatically different amounts and types of satellite DNA, which has led to the general notion that satellite DNA turns over rapidly (Lohe and Brutlag 1987a; Fowler et al. 1989; Sharma and Raina 2005; Subirana et al. 2015). One possible explanation is that satellite DNA, when under proper silencing in the heterochromatin, is neutral or weakly deleterious; the speed of turnover is then determined by genetic drift. Indeed, simulations of unequal crossing-over demonstrated that satellites readily form and expand from complex sequences in the absence of selection (Smith 1976). Supporting this idea is the prevalence of satellite DNA on degenerated heterogametic sex chromosomes, especially the nonrecombining Y chromosome (Bonaccorsi and Lohe 1991; Losada et al. 1997; Guenatri et al. 2004; Miga et al. 2014; Hall et al. 2016), which has severely limited gene content, repressive chromatin state, and reduced efficacy of natural selection (Charlesworth and Charlesworth 2000; Laporte and Charlesworth 2002).
It is unclear whether the same evolutionary processes govern rapid turnover of satellite DNA at and around the centromeres (Henikoff et al. 2001; Melters et al. 2013; Talbert et al. 2018). Arguing against neutrality, satellites in these regions can have functional roles. This includes formation of centromeres, where satellite DNA recruits centromeric histones and is required for faithful chromosome segregation (Murphy and Karpen 1995; Sun et al. 1997). Heterochromatin also facilitates meiotic pairing of homologous chromosomes during prophase I, particularly for achiasmatic chromosomes (Dernburg et al. 1996). Such roles not only strongly implicate both positive and negative selection but have also prompted speculation of mechanisms of selfish transmission such as meiotic drive (Malik 2009). For instance, a centromeric satellite that acquires the ability to distort Mendelian transmission in its favor will quickly fix in the population resulting in accelerated evolution and its expansion (Malik and Henikoff 2009).
One model that accounts for the rapid changes in satellites posits that related species share a common set, or “library,” of satellites that were present in the common ancestor; differential amplification of specific satellites from this library in different lineages then results in drastic interspecific differences (Fry and Salser 1977; Plohl et al. 2008). The library hypothesis, however, does not address the emergence of novel satellites nor how the library forms. In fact, little is known about the birth of satellite DNA. Since unequal crossing-over cannot produce copy number changes between single copy sequences, births likely begin with the formation of tandem duplicates, after which unequal exchange may be sufficient to generate copy number increase (Charlesworth et al. 1986; Tautz and Schlötterer 1994). Importantly, given the size of the monomer, the mechanisms of tandem formation likely differ between simple and complex satellites. One common mutational mechanism of tandem duplication is polymerase slippage during DNA replication, which creates deletions or duplications in the nascent strand (Tautz and Renz 1984; Lovett et al. 1993). Because polymerase slippages are typically short, this mechanism is likely only capable of initiating simple satellite formation, whereas complex satellites require other means of inception. Notably, simple satellites may have a similar mechanism of birth as microsatellites which have short motifs that tandemly repeat for tens of base pairs (Harr et al. 2000; Klintschar et al. 2004). However, microsatellites do not have the same deleterious impact as they are found throughout euchromatin and individual blocks do not exceed 100 bp in length in Drosophila (Schug et al. 1998; Harr et al. 2000; Fondon et al. 2012).
Interestingly, in Drosophila melanogaster and related species that have been examined, simple satellites are found in extremely high abundance that also vary widely among species (Lohe and Brutlag 1986). For example, the 5mer satellite AAGAG in D. melanogaster is estimated to be as much as 5% of the ∼175-Mb genome (Lohe and Brutlag 1986). In the closely related species, D. simulans, AAGAG abundance is much lower, whereas the most abundant satellite is a 15mer that is completely absent in D. melanogaster (Lohe and Roberts 1988). In the distant D. virilis, as much as half of its large ∼350-Mb genome is estimated to be composed of several 7mers (Gall and Atherton 1974). However, most observations are based on a few satellites in a small number of closely related species within the Drosophila genus. In the era of genomics, the low sequence complexity and repetitiveness of simple satellites continue to confound alignments and assemblies, resulting in severely deficient heterochromatic assemblies, unless specifically targeted (Hoskins et al. 2007; Smith et al. 2007). Various approaches have been adopted to characterize repeats from genome assemblies, but they are unfortunately restricted to predominantly euchromatic sequences (Stenberg et al. 2005; Gallach et al. 2007). On top of computational challenges, simple satellites can be underrepresented for biochemical reasons. For example, in the 12 Drosophila species genomes (Drosophila 12 Genomes Consortium 2007) simple satellites are highly underrepresented because they are poorly maintained in plasmid clones used for genome sequencing (Brutlag et al. 1977; Lohe and Brutlag 1986; Hoskins et al. 2002). With the now popular short-read sequencing approaches, simple satellites that are AT-rich are also prone to underrepresentation, due to biased amplification of sequences with intermediate GC-content (Aird et al. 2011). These limitations have prevented us from answering even basic questions about the evolution of satellite DNAs: is rapid turnover a general phenomenon in Drosophila and, if so, how frequently are satellites gained and lost?
Given recent advances in whole-genome sequencing and our development of the k-Seek pipeline to characterize and quantify simple satellites (Wei, Grenier, et al. 2014), we are poised to reevaluate the landscape of these highly repetitive sequences in Drosophila. To this end, we examined patterns of simple satellite divergence across nine Drosophila species spanning over 40 Ma of evolution. Using PCR-free libraries, which we show better recover satellite DNA than traditional library preparations, followed by GC-correction, we comprehensively profiled the simple satellite landscape of each species using k-Seek. Males and females were sequenced separately, allowing us to identify Y-linked satellites. Although we observed large interspecific differences and many species-specific satellites as expected, we were surprised to find that high satellite content is not universal, but is rather specific to only some lineages, including the melanogaster complex species, and low in others, such as the obscura group. We also unexpectedly found that interspecific differences appear to be driven predominantly by gains of simple satellites at terminal branches, and we find that these new satellites likely emerged from existing ones. Overall, this study illustrates that the rate of simple satellite evolution is highly heterogeneous.
Results
Simple-Satellite Quantification from WGS of PCR-Free Libraries with k-Seek Followed by GC-Correction
Previously, we published the computational pipeline k-Seek designed to quantify and identify simple satellites de novo from short read sequences (Wei, Grenier, et al. 2014). It is a heuristic approach that identifies tandemly repeating motifs of up to 10 bp by breaking down reads into smaller fragments which are then grouped by identity. When there are repeating motifs within a read, they are grouped together, thus allowing for identification of simple satellites. For this study, we expanded the motif search length to up to 20 bp to capture satellites that may have formed from fusions of short motifs (for documentation, see Materials and Methods).
Our previous application of this method yielded an unexpected deficit of AT-rich satellites which can be attributed, in part, to the library preparation. The standard protocol for preparing Illumina libraries requires PCR-amplification of adaptor-linked genomic fragments. This step not only exponentially increases the concentration of fragments for sequencing but it also increases the proportion of fragments with adapters on both sides, swamping out unsequenceable fragments that failed to ligate to adapters. However, this step poses two problems for identification and quantification of satellite DNA: Taq polymerase underamplifies sequences with extremely low or high GC composition (Aird et al. 2011) and often slips at highly repetitive regions, producing errors (Shinde et al. 2003). These issues result in reduced representation of satellite DNA in the final sequences, particularly in Drosophila as its satellite monomers tend to be short and AT-rich. To better understand the biases introduced by PCR and its effects on representation of satellites, we generated triplicates of libraries from whole females from a single D. melanogaster line under three different conditions: without PCR (PCR-free), with the minimum recommended number of PCR cycles (8-cycle), and with a more typical number of cycles (12-cycle). After sequencing, we used k-Seek to identify and quantify simple satellites.
Here, we focus on simple satellites with average abundances >100 bp across the replicates, as less abundant ones may not only come from microsatellites but can also be flanked by unique sequences that reduce the GC-bias effects; this equates to, for example, an aggregated minimum of 20 copies of 5-bp satellites or 10 copies 10-bp satellites. Applying principal component analysis to the kmer abundances of each sample, we observed a clear separation of the three different PCR conditions along the first principal component (PC1), where the 8-cycle PCR samples are intermediate to the other two (fig. 1A). PC1 also accounts for 91% of the variance, indicating that the differences among the samples are predominantly due to the PCR treatments.
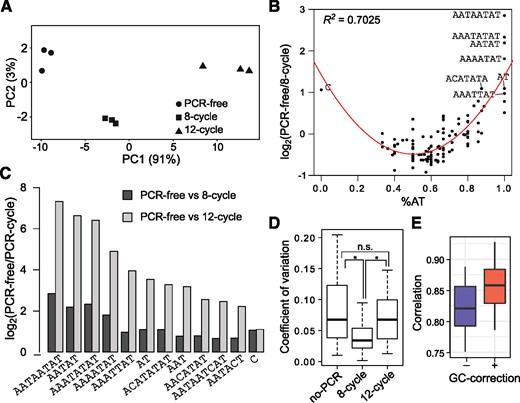
Satellite DNA characterization from standard and PCR-free WGS libraries. (A) Principal component analysis of libraries generated from PCR-free, 8-cycle PCR, and 12-cycle PCR libraries. PC1 accounts for over 90% of the variance between samples. (B) The %AT composition of each kmer is plotted against the log2 fold-difference between PCR-free and 8-cycle PCR libraries. The points are fitted with a quadratic function; the R2 is labeled on the top left. (C) For kmers that are >1.5-fold lower in 8-cycle PCR libraries, the log2 fold-differences between PCR-free and 8-cycle PCR libraries (dark gray) and between PCR-free and 12-cycle PCR libraries (light gray) are plotted. (D) The coefficient of variation across triplicates of each condition. * indicates significance at P < 0.0001. (E) The distribution of pairwise correlations of satellite quantities between PCR conditions and replicates are plotted before and after GC-correction.
When compared with the 8-cycle libraries, the PCR-free libraries show substantially greater abundance of AT-rich satellites (fig. 1B). Although there are very few AT-poor satellites found in flies, the fold-differences of the kmers fit a parabolic function with respect to their AT composition, indicating that sequences at both extremes of the %AT spectrum are underrepresented after PCR. Notably, AATAT, one of the most abundant satellites (Lohe and Brutlag 1986), is nearly 4.5-fold more abundant in the PCR-free libraries. The difference is further exaggerated in the 12-cycle samples, where AT-only satellites are up to 135-fold lower (fig. 1C). The increase from 8 to 12 cycles also produced more technical variation among the replicate quantifications, with a coefficient of variation averaged across the kmers increasing from 0.061 to 0.151 (fig. 1D, paired Wilcoxon signed rank test, P = 1.89×10⁻⁵). Surprisingly, the coefficient of variation in the PCR-free libraries is similar to that of the 12-cycle libraries and significantly greater than that of the eight cycle libraries. However, we judged this increased variance to be a less important factor than the substantially increased representation of AT-rich satellites, and therefore elected to use PCR-free library preparations for the purpose of satellite characterization in Drosophila.
To further account for bias resulting from differential PCR amplification, kmer abundance was corrected for GC bias. This was accomplished by estimating the average enrichment/depletion of sequences with different GC contents at uniquely mapping regions for each sample, with which the simple satellite counts are adjusted (see Materials and Methods). Normalizing by GC content significantly improved correlations among different library preparations (Cohen’s d = 0.87, Wilcoxon signed-rank P < 10−6), reducing PCR bias (fig. 1E and supplementary fig. 1A, Supplementary Material online). As expected, the change was greatest for the 12-cycle libraries (supplementary fig. 1B, Supplementary Material online).
Characterization of Simple Satellites across Drosophila Species
We sequenced whole adult males and females separately from nine species: D. melanogaster, D. simulans, D. sechellia, D. erecta, D. ananassae, D. pseudoobscura, D. persimilis, D mojavensis, and D. virilis (supplementary table 1, Supplementary Material online). On average, each sample was sequenced with 20.5 million 100-bp reads (both paired-end and single end) and aligned to their respective reference genomes, resulting in a mean read depth of 13.9× over the autosomes. For each sample, the kmer abundance was normalized by the average autosomal read depth, after GC correction (supplementary fig. 2, Supplementary Material online). We noticed that the D. sechellia male sample is contaminated with D. mojavensis, as 7.8% of the reads mapped to the D. mojavensis reference at higher mapping quality than to the D. sechellia reference; in contrast, only 0.6% of the D. simulans male reads mapped better to D. mojavensis. We removed these reads prior to analysis of the D. sechellia male sample (see Materials and Methods for details).
The catalog of kmers was trimmed to include only those that are over 1 kb in abundance in at least one sample, leaving a list of 207 across species (fig. 2A, for full list see supplementary fig. 2, Supplementary Material online). We deemed satellites absent in a sample if they are <200 bp in abundance or have <20 copies. We chose these cutoffs to balance two competing issues: we wanted to avoid potentially including microsatellites while also capturing low-abundance satellites that are either recently evolved or on the way to extinction. For independent validation, we selected the 10mer AATAGAATTG that we discovered here in D. simulans but not D. melanogaster as the target of fluorescence in situ hybridization (FISH). Consistent with the k-Seek quantifications, we observed clear localization of the probe to the fourth chromosome of D. simulans, whereas no signal was detected on D. melanogaster chromosomes (fig. 2B). Furthermore, our quantification of known satellites in the three species of the melanogaster species complex and in D. virilis is consistent with past studies (Gall and Atherton 1974; Lohe and Brutlag 1987a; Lohe and Roberts 1988) and a recent report that systematically characterized the location and presence/absence of satellites across the species of this group using FISH (Jagannathan et al. 2017).
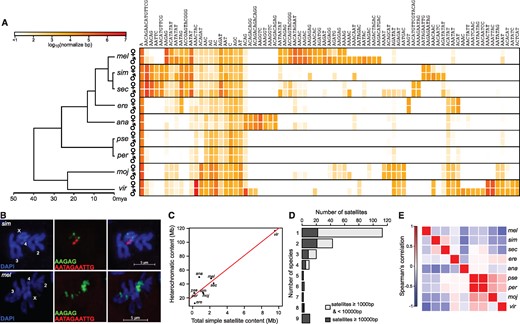
The landscape of satellite DNAs across nine Drosophila species. (A) The heatmap depicts satellite DNA quantities in log10 scale for females and males of the nine species, with the phylogeny of the species drawn on the left. Due to space constraints, only satellites >10 kb in at least one sample are plotted. For the complete set of 207 satellites, see supplementary figure 3, Supplementary Material online. The order of kmers was determined by hierarchical clustering of their quantities in the different samples. (B) Fluorescent in situ hybridization of AAGAG and AATACAATTG in D. melanogaster and D. simulans mitotic chromosomes from third-instar larval neuroblast cells. (C) Total simple satellite abundances are plotted against estimated heterochromatin content (modified from Bosco et al. 2007); the regression line is plotted in red. (D) Simple satellites of low (light gray) and high (dark gray) abundance are binned by the number of species in which they are found. (E) Pairwise Spearman’s correlation of satellite abundance between species is plotted as a heatmap. Negative correlations are driven largely by species-specific satellites.
D. virilis is, by far, the most satellite-rich, with over 55× more simple satellite content than the most satellite-poor species D. pseudoobscura (table 1). We note that while the total simple satellite abundances of these species are highly and significantly correlated with previous estimates of total heterochromatic content (Pearson’s r = 0.948, P = 9.62×10⁵) (Bosco et al. 2007), there are notable differences (fig. 2C). For example, with the exception of D. erecta, all the satellite-poor species have genomes comparable with or larger than that of D. melanogaster, indicating that other types of repeats including TEs and complex satellites likely contribute far more to genome size variation and heterochromatic content of the satellite-poor species.
kmer Types and Abundances.
| Species | Sex | No. of kmers | Total Abundance | Top 5 kmers (in order of abundance) |
|---|---|---|---|---|
| Drosophila melanogaster | F | 64 | 1759812.8 | AAGAG,AACATAGAAT,A,AACAC,AATAT |
| M | 83 | 2531520.6 | AAGAG,AACATAGAAT,AATAT,AAGAC,A | |
| D. simulans | F | 37 | 1000355.8 | AACAGAACATGTTCG,A,AACAG,AATAG,ACCGAGTACGGG |
| M | 51 | 1428511.5 | AACAGAACATGTTCG,AATAT,A,ACCGAGTACGGG,AATAG | |
| D. sechellia | F | 52 | 2057617.9 | AACAGAACATGTTCG,AACAG,A,AGAT,AATAG |
| M | 60 | 2727635.3 | AACAGAACATGTTCG,AATAT,AACAG,AGAT,AATAG | |
| D. erecta | F | 26 | 237547.4 | A,ACAT,AAGT,AATAG,AAGAGT |
| M | 26 | 258086.2 | A,ACAT,AAGT,AAATAT,AATAG | |
| D. ananassae | F | 38 | 854598.7 | AAGGTC,A,ACAGACAGACAGG,ACAG,AAAGGTC |
| M | 38 | 671633.8 | AAGGTC,A,ACAGACAGACAGG,ACAG,ACAGACAGG | |
| D. persimilis | F | 20 | 186310.7 | A,C,AGC,AG,AC |
| M | 17 | 168330.9 | A,C,AGC,AG,AC | |
| D. pseudoobscura | F | 20 | 194625.5 | A,C,AG,AGC,AC |
| M | 19 | 236419.0 | A,C,AG,AGC,AC | |
| D. mojavensis | F | 68 | 1344986.9 | A,ACAGAT,AG,AC,AT |
| M | 68 | 1172540.2 | A,ACAGAT,AG,AC,AT | |
| D. virilis | F | 59 | 9575780.2 | AAACTAC,AAATTAC,A,AAACTAT,AC |
| M | 90 | 9509916.9 | AAACTAC,ACAG,AAACTAT,AAATTAC,A |
The distribution of simple satellites across species (fig. 2D) shows an extreme lineage- and species-specific skew with 55.1% (n = 114) being found only in one species. The library hypothesis posits that the differences in satellites among related species result from differential amplification and contraction of a common set of satellites (Fry and Salser 1977; Plohl et al. 2008). This model thus predicts that most satellites should be present in multiple species, which is inconsistent with the distribution we observe. Only 11 satellites are shared across all species and these 11 are primarily short simple satellites (k < 5) including all mono and dinucleotide repeats and several trinucleotide repeats (supplementary fig. 4, Supplementary Material online). Although we cannot exclude the possibility that some satellites are below our detection level, we note that even at a much lower presence cutoff of >5 copies, we still see an abundance of species-specific satellites (supplementary fig. 5, Supplementary Material online). Moreover, nearly 80% (n = 91) of the species-specific satellites are found at lower abundance (<10 kb; fig. 2C), arguing that they are likely newly emerged and thus have had less time to amplify. Conversely, satellites shared by more than four species, and thus are likely older, are all of higher abundance (>10 kb).
As simple satellites are often species-specific, it is unsurprising that their abundances are also poorly correlated between species (fig. 2D); even the D. simulans and D. sechellia sister species, which diverged only 0.2 Ma, have a nonsignificant correlation of 0.194 (Spearman’s rho, P = 0.071). Many of the pairwise correlations are in fact negative, particularly between the repeat-rich species, due to species-specific satellites. Altogether these results further affirm the high turnover of simple satellites in Drosophila and indicate that this rate is not driven simply by amplification and contractions of existing repeats.
Accumulation of Simple Satellites on the Y Chromosome
Given the degenerate state of the Y chromosomes in Drosophila, we expected to see an overabundance of simple satellites in males versus females. For the three species in the melanogaster complex, we indeed see a clear pattern of simple-satellite accumulation on the Y, as males not only have more satellite types but also 1.33–1.44 times higher total satellite abundance than females (table 1). However this clear male-bias is not seen across the remaining species. For example, in D. virilis, whereas there are substantially more satellite types in males, the total abundance is similar between the sexes, most likely because of an abundance of X-linked satellites. In D. ananassae and D. mojavensis, males have less total abundance of simple satellites, which may have resulted from large-scale deletions as the Y-chromosome degenerated. To identify Y-enriched satellites, we compared the kmer quantities between males and females, reasoning that male-biased repeats must be at least partially Y-linked (fig. 3A and supplementary table 3, Supplementary Material online). As expected, the three species in the melanogaster complex all have numerous Y-enriched satellites; between 34% and 40% of the simple satellites are Y-enriched in these species, and among them 57–69% are Y-specific. We note that our classification Y-linkage of known satellites in these three species is entirely consistent with their reported localizations based on FISH (Jagannathan et al. 2017). For D. virilis, we observed an even larger fraction of Y-enriched and Y-specific satellites. In D. erecta, D. ananassae, and D. mojavensis, whereas multiple Y-enriched satellites were identified, they are mostly of low or intermediate abundance (fig. 3A). Consistent with the notion of rapid accumulation of repeats on the Y, the distribution of Y-enriched and Y-specific satellites is significantly more species-specific than all satellites, with 79.4% and 88.0% being found in individual species, respectively (fig. 3B) (one-tailed Fisher’s exact test, P = 0.0328 and P = 0.0101).
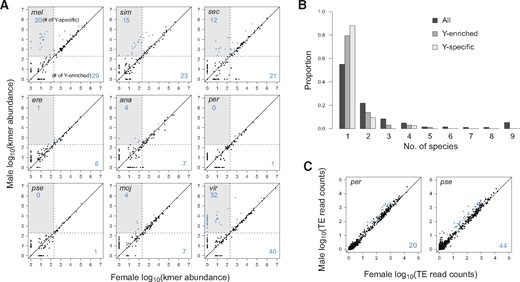
Y-enriched satellites across species. (A) For each species, the satellite quantities in females are plotted against those in males. Satellites with significant enrichment in males, and therefore at least partially Y-linked, are labeled in blue with the counts displayed on the bottom right of each plot. A subset of Y-linked satellites are absent in females, and are therefore Y-specific; they fall within the gray boxes and their counts are tallied in the top left corner. The presence/absence cutoffs of the samples are demarcated by the dotted lines. (B) Distribution of satellites across species is plotted for all satellites (same as fig. 2D), the Y-enriched satellites, and the Y-specific satellites. All pairwise comparisons of the three distributions are significantly different (Kolmogorov–Smirnov test, P values < 1e-5). (C) Read counts of TEs in females versus males are plotted for D. pseudoobscura and D. persimilis (see supplementary fig. 6, Supplementary Material online, for comparisons between all species).
Surprisingly, D. pseudoobscura and D. persimilis only have a single Y-enriched simple satellite each. Unlike the other species, they experienced a translocation of the ancestral Y onto an autosome <18 Ma (Larracuente and Clark 2014; Chang and Larracuente 2017), and the current Y is likely the degenerated remnant of an autosomal-X fusion that created neosex chromosomes along the lineage at about the same time (Carvalho and Clark 2005; Larracuente et al. 2010). The dearth of male-biased satellites is nonetheless unexpected given that most of the genes found on the neo-Y have been pseudogenized and the neo-X is dosage compensated, both of which are evidence of extensive differentiation of the chromosomes. To evaluate the extent of degeneration, we compared the normalized counts of reads mapping to TEs between the sexes (supplementary fig. 4B, Supplementary Material online). Indeed many TEs are enriched in males indicating an excess of insertions on the D. pseudoobscura and D. persimilis Y (fig. 3C); the former even has the most counts of Y-enriched TEs among all the species, consistent with the cytological observation that it has a sizeable Y chromosome (Dobzhansky 1935). These results reveal that unlike the other species the degeneration of the neo-Y was accompanied largely by TEs rather than simple satellites.
Although we found Y-enriched TEs in all species, the two species with the most satellites, D. melanogaster and D. virilis, have the fewest Y-enriched TEs. Although the low counts could be due to poor characterization of TEs in D. virilis, the same argument cannot be made for D. melanogaster. Moreover, our analysis was able to identify male-biased enrichment of the known Y-linked TE array of TART in D. melanogaster (Agudo et al. 1999), further indicating that this approach has adequate power to detect Y-enriched TEs. Together with the high abundance of Y-enriched TEs in D. pseudoobscura, these results raise the interesting possibility that satellite DNA and TEs accumulate on the Y-chromosomes at distinct and perhaps even antagonistic rates, such that copy number increase in one is at the detriment of the other.
Gains and Losses of Satellites along Drosophila Phylogeny
In order to investigate the evolutionary signal carried by simple satellites, we used kmer abundances to estimate phylogenetic relatedness of the nine species using both distance matrix and maximum parsimony methods (supplementary fig. 7, Supplementary Material online). We were able to recapitulate the consensus tree of the Drosophila genus (Drosophila 12 Genomes Consortium 2007), except for one nearest-neighbor interchange, indicating that simple satellites carry phylogenetic signal at the timescale of Drosophila evolution (∼40 Ma). For both methods, the one misplaced branch leads to D. ananassae, potentially indicating homoplasy of kmer abundances between D. ananassae and D. erecta. Given that these two species share a common ancestor with the melanogaster species complex, another possible explanation is that they undergo a slower rate of change in their simple satellite content as compared with the melanogaster species complex, and thus have less divergent kmer profiles.
To assess the rates of gains and losses, we inferred the branches in which each satellite emerges or disappears along the consensus Drosophila phylogeny, using a maximum parsimony framework. In the absence of any data on the relative rates of losses and gains, we took the conservative approach of weighing them equally (fig. 4A). We were able to unambiguously determine the branches of origin/loss for 187/207 satellites. As would be expected from the preponderance of species-specific satellites, we identified 167 terminal gains, most of which are found along branches leading to the satellite-rich species. The three species of the melanogaster complex all have large numbers of satellite gains despite their relatively recent divergence times (Garrigan et al. 2012). This contrasts starkly with the meager three gains on the D. erecta branch from which they split. Although both D. virilis and D. mojavensis have numerous gains, it is unclear whether they are recent acquisitions given the branch lengths of the two.
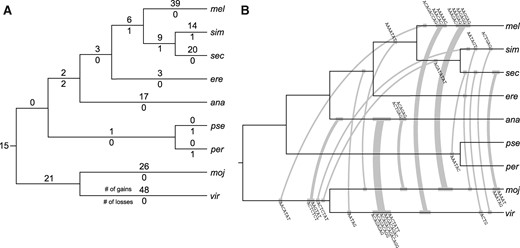
Satellite gains and losses along the Drosophila phylogeny. (A) Unambiguous simple-satellite gains and losses are labeled above and below each branch, respectively. The branch lengths are not drawn to scale. (B) Branches on which parallel gains are found are connected with gray lines. The width of the lines is proportional to the number of parallel gains, which are labeled above or below the lines. The branch lengths are not drawn to scale, and the placement of satellites on each branch does not reflect their actual age. Note that four satellites were gained in parallel but are not plotted here because the identity of one of the branches is ambiguous (see supplementary table S3, Supplementary Material online).
Interestingly, we found only seven losses across the entire phylogeny. This paucity may in part be driven by technical reasons. For example, 13 of the ambiguous cases include satellites that are present in D. melanogaster and either D. simulans or D. sechellia; we are unable to determine whether these species distributions are due to independent gains, or to gain in the branch prior to the split with D. melanogaster and subsequent loss in one of the two other species. If the latter scenario is correct, D. simulans and D. sechellia would have nine and four more losses, respectively (supplementary fig. 8, Supplementary Material online). There is an opportunity for ascertainment bias against loss events, because losses on terminal branches may go uncounted. Even with these, however, the number of gains is overwhelmingly larger than losses, suggesting that satellite loss is rare. Moreover, to exclude the possibility that the observed pattern is the product of the cutoff, we chose, we inferred the gains/losses using higher and lower presence cutoffs of >1,000 bp and >5 copies, respectively, and found the same general pattern of numerous terminal gains and few losses (supplementary fig. 9, Supplementary Material online).
We were able to identify 15 simple satellites that are likely present in the last common ancestor of all nine species. Interestingly, the D. pseudoobscura and D. persimilis lineage appears to have gained only one satellite since the split with the lineage leading to the melanogaster group, ∼26 Ma; these two species even each lost a satellite since their very recent split. Together with the fact that they have few if any Y-linked satellites, these two species clearly deviate from the trend of satellite accumulation.
Given the paucity of shared kmers, we were also surprised to observe 31 satellites that were gained in parallel (fig. 4B and supplementary table 3, Supplementary Material online). In all but one case, they were parallel gains on two distant branches; some branch pairs even contain multiple parallel gains. Along the branches leading to D. virilis and D. ananassae, as many as five parallel gains were found where four out of five are highly related in sequence composition. Similarly, four satellites were gained on the terminal branches leading to both D. melanogaster and D. mojavensis, all of which are related AG-rich satellites. These results suggest that simple satellites of similar sequences readily emerge from existing satellites, and the clustered parallel gains are the result of subsequent births from either shared satellites or satellites of related sequences.
Sequence Similarity of Satellites Gained within a Lineage
The most parsimonious way to gain a novel satellite is for a single motif in an existing satellite to gain a mutation which is subsequently amplified. To better understand this potential mechanism of satellite birth, we calculated the pairwise mutational distance between kmers found within a species and determined the number of satellites that are only one point mutation or indel away from another. In this analysis, we removed short satellites with base motifs <4 bp, as they can expand to almost any other sequence with merely one insertion (e.g., the mononucleotide A motif is one insertion away from any other motif containing A, which is nearly every satellite in our list). We then determined the proportion of simple satellites within a species that are only one mutation away from another. In every case, the satellites found within species are indeed closer to each other than random sets sampled from satellites found across all species (fig. 5A), supporting the notion that satellites of similar sequence are gained along a lineage.
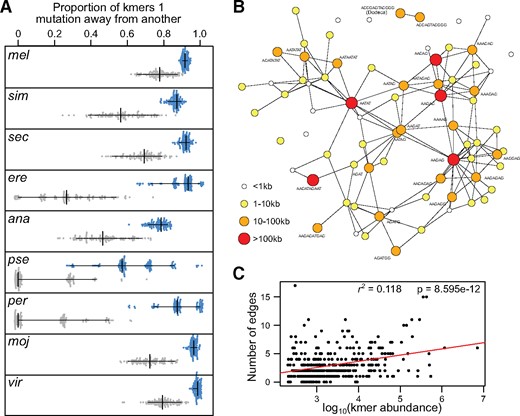
Sequence similarity of lineage-specific satellites. (A) Bootstrapped distributions of the proportion of satellites within one mutation from another are plotted for each species (blue), and for random sets sampled from all species (gray). The vertical and horizontal lines demarcate the median and 95% intervals of the swarms, respectively. All comparisons between the species and random distributions are significantly different (Wilcoxon ranked sum test, P values < 1e-10). (B) Simple satellites in Drosophila melanogaster are plotted as nodes where the size and color indicate their abundances; to prevent clutter, only those that are >10 kb in abundance are labeled. Simple satellites one mutation away from each other are connected by edges. See supplementary figure 9, Supplementary Material online, for networks in all species. (C) The log10 abundance of each simple satellite is plotted against the number of edges it has in a given species; the regression line for this correlation is in red with the P value and R2 shown on the top right.
If existing satellites are the source of novel ones, we expect that highly abundant satellites are more likely to give birth, since they provide a larger target size on which mutation can act, given a uniform mutation rate. To evaluate this prediction, we plotted the satellites within a species into a network, where satellites one mutation away from each other are connected by edges (fig. 5B and supplementary fig. 10, Supplementary Material online). For D. melanogaster, we find that the most abundant satellite, AAGAG, is the most connected, that is, has the most edges, followed by AATAT, and AAGAC, both of which are among the most abundant within the species. Curiously, the second most abundant satellite AACATAGAAT only has two connections. We also note that the only satellites with intermediate abundance that are not connected to the main network are the dodeca satellites (Abad et al. 1992), suggesting that they may have a more complex origin. Nevertheless, across all species, we find that the connectedness of satellites is significantly correlated with their abundance (Pearson’s r = 0.343, P = 8.60×10⁻¹², fig. 5C). Although this confirms our prediction, the correlation only explains 11.8% of the variation, indicating that our model of simple satellite birth only partially accounts for their diversity in the genome.
Discussion
Challenges in Quantifying Simple Satellites
Characterizing and quantifying repetitive DNA have long been problematic for genome analyses. Not only are simple satellites a significant challenge for sequence alignments and assemblies they are also prone to underrepresentation in DNA preparations. We demonstrate that the abundance of AT-rich simple satellites are substantially reduced as a result of PCR amplification, likely due to inefficiency of Taq polymerase amplifying sequences with extreme (low and high) GC content. We reduced this effect by using PCR-free library preparations and applying a GC correction to simple-satellite quantities. Nevertheless, we note that our satellite quantities are still substantially lower than previous estimates. We suggest two possibilities for the lingering under representation. First, multiple rounds of PCR take place during bridge amplification of libraries on Illumina flow cells, which means that with the current Illumina platforms, some degree of PCR underrepresentation is inevitable. Second, high heterogeneity of satellite sequences, that is, satellite blocks with numerous mutations, will reduce the efficacy of satellite quantification with k-Seek. Although there are many cases of highly heterogeneous complex satellites (Waye and Willard 1987; Zinić et al. 2000; Miga et al. 2014; Khost et al. 2017), in D. melanogaster and D. virilis, simple satellites appear to be highly homogeneous (Gall and Atherton 1974; Lohe and Brutlag 1986, 1987b). However, it is unclear whether this characteristic extends to the novel satellites we identified and to other species.
In addition to technical biases and challenges, many Drosophila tissues, including ovarian nurse cells, fat body cells, and gut cells, undergo polytenization, in which DNA replicates without cellular division (Beermann 1956; Ashburner 1990). Since heterochromatic sequences are underreplicated compared with euchromatic sequences during endoreplication, satellite abundance will be underestimated when DNA is extracted from whole flies. It is unlikely, however, that the low amount of simple satellites in D. pseudoobscura and D. persimilis are the result of underestimation, since the amount of reads mapping to TEs in these species are comparable with the satellite-rich species (supplementary fig. 6, Supplementary Material online).
Variable Rates of Simple Satellite Evolution
We observed a complex landscape of simple satellites in nine Drosophila species, spanning over 40 Ma of evolution. As with previous reports, we observed large differences in both satellite sequence and abundance between closely related species, particularly among species of the melanogaster complex, suggesting rapid change. But we also discovered lineages that have much slower rates of change, including D. erecta and D. pseudoobscura/D. persimilis. Therefore, rapid turnover of satellite DNA is not universal in Drosophila but instead appears to be heterogeneous across lineages. Interestingly, we also found that species differences are almost entirely caused by satellite gains rather than losses. Because we only sequenced one strain per species, we cannot be sure whether the inferred presence/absences are fixed or polymorphic. Given that library preparation and sequencing runs have such large effects on quantification, it is difficult to use other available WGS data for this purpose. However, we note that in flies, there is only one case, to our knowledge, of a simple satellite presence/absence polymorphism (Wei, Grenier, et al. 2014).
Why are the rates of satellite evolution so different among lineages? Based on the model that satellite DNAs are predominantly weakly deleterious, one might predict that the differences correlate with the effective population sizes of the species, whereby species with larger populations have more efficacious selection and therefore less satellite content (Stephan 1986). Given their well-characterized population history and demography, the three species in the melanogaster complex present an assessment of this, albeit in a limited way. Consistent with the model, D. simulans has the largest effective population size (Andolfatto et al. 2011) and the lowest abundance of satellites, whereas D. sechellia has the smallest effective population and highest abundance. However, weak purifying selection is clearly not the sole driving force of satellite DNA evolution, as it is difficult to conceive that species like D. pseudoobscura have historical effective population sizes large enough to account for the minimal abundance we observed. Moreover, D. virilis is estimated to have a similar effective population size as D. melanogaster (Vieira and Charlesworth 1999), yet has dramatically higher total satellite abundance. These results indicate that other mechanisms are likely involved, which we will discuss in the sections below.
We showed that the majority of simple satellites within a species are comprised of monomers that are only one mutation away from another satellite. This was initially observed in D. virilis where three 7-bp satellites (AAACTAC, AAACTAT, AAATTAC) that only differ at one position were identified (Gall and Atherton 1974). Because AAACTAC is also found in the closely related species, D. americana, the authors suggested that the other two likely emerged through point mutations of AAACTAC. To generate a novel satellite, mutated monomers must then be amplified to create an array. Given the short length of simple-satellite motifs, polymerase slippage during DNA replication is a likely cause of the initial tandem formation. Once tandem duplicates emerge, unequal crossing-over can then lead to rapid expansion. Consistent with this model, we find that simple satellites of higher abundance are more likely to generate satellites that are only one mutation away. This model is also supported by our previous observation in D. melanogaster that the most abundant simple satellite AAGAG is often interspersed with other related satellites (Wei, Grenier, et al. 2014). We note though that larger satellites may also homogenize their monomers more frequently through gene conversion (Dover et al. 1982; Plohl and Ugarković 1994; Shi et al. 2010), counterbalancing the rate of mutation.
Retention of Simple Satellites Conducive to Optimal Nucleosome Packaging
The stated model of rapid emergence cannot account, however, for the observation that the motif length of satellites within a species frequently is unevenly distributed (supplementary fig. 11A, Supplementary Material online), and that satellites tend to be connected with others of similar motif length (e.g., AAGAG is highly connected with other 5mers) and similar nucleotide configuration (e.g., AATAG with AAGAG and AAGAC, all of which have dinucleotide As). Generation of tandem duplicates via polymerase slippage will only maintain the monomer length if the slippage is of the same length. Unless there is a mechanistic bias for the length of slippage, such events are expected to generate novel arrays with monomers of different lengths. Therefore, the prevalence of 5mers in the melanogaster complex and 7mers in D. virilis suggests that novel arrays of those lengths may be preferentially retained. Similarly, unless there is a bias to the specific position of mutations, the fact that we find kmers that have derived from mutations at only a subset of positions further argues for a retention preference. For example, out of the nine most abundant 5mers in D. melanogaster, only one (AGATG) contains a sequence variant outside of the third and fifth position.
Here, we speculate that retention preference may be driven by deleterious fitness impacts of unfavorable monomer lengths and compositions. One possible source of fitness impact may be how tightly the nucleosomes can package the satellites to prevent ectopic exchange. Due to the high abundance of 5mers and 10mers in D. melanogaster, it has been suggested that monomer lengths that are multiples of 5 are particularly conducive for forming satellites (Lohe and Brutlag 1986). Consistent with this, nucleosome-bound DNA shows enrichment of AA dinucleotides with 10-bp periodicity at positions facing the histones (Segal et al. 2006; Mavrich et al. 2008), albeit only euchromatic sequences were examined. The AA dinucleotide is thought to provide an intrinsic curvature to the double helix, whereas the periodicity promotes wrapping around the nucleosome through interactions with specific histone residues (Wu and Crothers 1984). Genome-wide analyses at intergenic regions even showed that sites facing histones are under selection in D. melanogaster and D. simulans, presumably to maintain or improve nucleosome binding (Langley et al. 2014). Moreover, complex satellites in mice, beetles, and flies have an intrinsic curvature causing slower migration in gels (Radic et al. 1987; Doshi et al. 1991; Barceló et al. 1997). We indeed find that satellites in the species of the melanogaster complex have sequence compositions that appear favorable for nucleosome binding as they show elevated frequencies of AA dinucleotides at a 10-bp periodicity (supplementary fig. 11B, Supplementary Material online). It is unclear, however, whether the observed periodicity is the mere result of the preponderance of simple satellites that contain AA with motif length that are multiples of five. Additionally, the simple satellites in D. virilis, with their 7-bp bias, obviously do not produce the 10-bp periodicity, despite having AAs; therefore, this mechanism is likely to be specific to the melanogaster complex and different mechanisms may be at play in other lineages.
Emergence of Novel Satellites Driven by Sequence-Dependent Binding Proteins
Another possibility (not mutually exclusive) is that lineage-specific coevolution with sequence-specific satellite-binding proteins limits satellite evolution. There are a handful of such proteins known in D. melanogaster including GAGA-factor which localizes to AG-rich repeats (Raff et al. 1994). It has been suggested that the satellite-binding function of this essential transcription factor was required for the expansion of AAGAG and related satellites in the lineage leading up to the melanogaster complex (Csink and Henikoff 1998). Similarly, the protein proliferation disrupter (prod) binds to the D. melanogaster-specific 10mer, AACATAGAAT (Török et al. 2000), and might have mediated the expansion of this species-specific satellite. These proteins may create a permissive chromatin environment that allows for the emergence and expansion of satellites that are similar in sequence while mitigating strongly deleterious effects.
Simple Satellites Acquiring Cellular Function or Selfish Properties
The aforementioned mechanisms assume that satellites are either predominantly deleterious or nearly neutral. Alternatively, the rapid gains may result from nonneutral modes of evolution, like positive selection. For example, transcription of the AAGAG satellite in D. melanogaster is important for the integrity of the nuclear matrix (Pathak et al. 2013), which may be an acquired beneficial function that facilitated the expansion of the satellite in the melanogaster complex. Additionally, the centromeric and pericentromeric localization of many satellites implies that changes in the types and abundance of satellites may affect chromosome segregation, raising the possibility that positive selection drives changes in satellites (Henikoff et al. 2001). Given their centromeric function, satellites are also poised to accelerate their evolution through selfish mechanisms like segregation distortion and meiotic drive that bias the rate of chromosome transmission, typically at the expense of host fitness, as exemplified by centromere-linked loci bias segregation rates during female meiosis in plants and mice (Fishman and Willis 2005; Chmátal et al. 2014). Interestingly, in D. melanogaster the peri-centromeric complex satellite Responder (Rsp) appears to evolve under the influence of both positive selection and a selfish mechanism. Rsp is the target of the transmission distorter SD in spermatogenesis such that chromosomes with higher Rsp copy number are transmitted at lower frequency (Wu et al. 1988; Pimpinelli and Dimitri 1989). However, in the absence of SD, higher copy number of the satellite appears to confer a fitness advantage in both males and females, implicating positive selection as a driving force behind the increase in abundance and population frequency (Wu et al. 1989). Similar tests for non-Mendelian transmission and fitness differences can be done in future work for the satellites that we have discovered here.
Rarity of Loss Events
An early simulation of simple satellite formation through unequal crossing over suggested that once formed, satellite arrays tend to persist (Smith 1976). However, later studies argued that given a large enough number of crossover events, all satellites will eventually be lost since the mechanism of unequal crossover necessitates a nonzero chance of reducing an array to a monomer that can no longer amplify (Charlesworth et al. 1986). Although at face value our results support the former result, we note that the observed bias for gains may be driven, in part, by the maximum parsimony framework, we used and the assumption that gains and losses are equally probable. For an extreme example, if the last common ancestor had a large catalog of satellites and the rate of loss is uniformly high across the phylogeny, one expects to detect a large number of species-specific satellites, but our analysis would erroneously infer them to be terminal gains. However, we find this an unlikely scenario as it requires a large load of simple satellites in the last common ancestor. It is also inconsistent with our observations that the species-specific satellites are highly related in sequence and that satellite abundance is positively correlated with the number of satellites one mutation away within the species, both of which argue for the emergence of simple satellites from existing ones. Furthermore, while some true losses may be missed due to the sparse sampling of species, we note that the species in the melanogaster complex display the same gain bias, despite having a short time scale. Even D. simulans, which has the greatest number of losses when ambiguities are resolved in favor of losses (supplementary fig. 9, Supplementary Material online), has more gains.
Loss and contractions of tandem arrays are thought to result primarily from unequal crossovers and intrachromosomal exchange creating loop deletions. Because there are more opportunities for nonorthologous mis-pairing, longer arrays are expected to be more prone to contractions, but it remains unclear how frequently such events occur. Even if they are common, complete removal of a satellite block requires pairing to happen precisely at the edges of the block, which is likely to be extremely rare. Stepwise and gradual decreases in array size may also be limited as the rate of exchange necessarily diminishes with the array size. When the array becomes too small, the DNA can no longer bend to form the loop. These molecular constraints may therefore partly explain the small number of loss events across the Drosophila phylogeny.
Interestingly, D. simulans, as compared with D. sechellia and D. melanogaster with their high gain rates, has a large number of inferred losses. Among the simple satellites shared between D. simulans and D. sechellia, the number with lower abundance in D. simulans is significantly higher than expected (25 out of 31, binomial exact test P = 0.000342). This does not appear to be due to increases in D. sechellia, since, comparing across the melanogaster complex, we find that D. simulans also has a significantly disproportionate number of satellites with the lowest abundance across the three species (15 out of 23, binomial exact test P = 0.0029). These results suggest that D. simulans may be actively purging satellites. Supporting this, several lines of evidence argue that D. simulans may be less tolerant of repetitive sequences as a whole. First, the species has a smaller genome size and lower overall heterochromatic content compared with D. melanogaster and D. sechellia (Bosco et al. 2007), a trend we also observed regarding abundance of simple satellites. Second, naive D. simulans populations are resistant to the invasion of P-elements under laboratory conditions (Kimura and Kidwell 1994), compared with the invasion in D. melanogaster, even though the two have overlapping distributions worldwide and D. simulans was eventually invaded (Kofler et al. 2015). Third, TE regulators and chromatin modifiers appear to have stronger repressive activities in D. simulans than in D. melanogaster, suggesting that D. simulans may tolerate less TE activity (Wei, Clark, et al. 2014; Lee and Karpen 2017).
The interaction between Rsp and SD provides further insight into a potential mechanism of loss. Without the fitness benefits of large Rsp arrays (Wu et al. 1989), SD is expected to drive Rsp to extinction, since deletion of Rsp restores chromosome segregation to the Mendelian frequency (Wu et al. 1989). Extending this logic, drivers of segregation distortion and meiotic drive may result in the purge of targeted satellites. In D. simulans, there are several loci that distort transmission of the Y chromosome in males, causing sex ratio distortion. One distorter is the heterochromatic protein HP1D2 that localizes to the Y-chromosome, causing its mis-segregation during anaphase II and thereby producing fewer Y-bearing sperms (Cazemajor et al. 2000; Helleu et al. 2016). Much like Rsp, the satellite targeted by HP1D2, though yet unknown, is presumably deleterious in the presence of the driver. Selection is therefore expected to favor deletion of the target and eventual loss in the species, restoring a normal sex ratio. We note that our catalog of Y-linked satellites may facilitate the identification of the target and modeling these dynamics to more fully understand the system.
Genomes Lacking Simple Satellites
The sister species D. pseudoobscura and D. persimilis have low amounts of simple satellites. We were especially surprised that there is little evidence for Y-linked satellites even though the Neo-Y is clearly degenerated, as evidenced by many TE insertions. We consider it unlikely that this absence of Y-linked satellites is the result of large-scale deterioration and loss of Y-linked DNA since the D. pseudoobscura Y is comparable in size to the X (Dobzhansky 1935). Furthermore, while the Neo-Y is relatively young in these species (emerged ∼18 Ma), the three species in the melanogaster complex acquired multiple Y-linked satellites over a similar time-frame. We note that D. pseudoobscura does have complex satellites on the Y; the Y-linked IGS satellites are thought to act as homologous sequence to the rDNA array on the X for meiotic pairing (Larracuente et al. 2010).
The absence of simple satellites on the Y may instead reflect a general absence in these species. Given that D. pseudoobscura has a similar recombination rate to D. melanogaster (Kulathinal et al. 2008; Comeron et al. 2012), the absence of simple satellites genome-wide is unlikely due to lower rates of crossing-over. As mentioned previously, small arrays provide little material for homology-directed unequal exchange and therefore are unlikely to expand. We speculate that overcoming this barrier is the initial step required for the expansion of satellites. In the common ancestor of D. pseudoobscura and D. persimilis, emerging arrays either failed by chance to overcome this barrier or were actively deterred by repeat silencing mechanisms. Regardless of the mechanism, these results argue that the extensive divergence of simple satellites between species is not only the product of rapid gains but also reflects resilience to gains in different lineages. The tempo of satellite DNA evolution is therefore much more dynamic and species-specific than previously thought.
Materials and Methods
Updates to k-Seek
For extended description of the logic behind k-Seek, please see the supplementary material of Wei, Grenier, et al. (2014). To briefly summarize, k-Seek first identifies repeated motifs from short reads by dividing the sequence into short fragments of length n. The fragmented sequence are then stored as the index of a hash table with the number of occurrence as the value. For a read that contains repetitive sequence where the base motif has length k, the hash table will predominantly contain nonunique indexes (i.e., indexes with values >1); when n equals k, the hash table will contain exactly one nonunique index. To search for the appropriate n, the previous k-seek release sequentially generates hash tables from n = 6 to n = 10. The updated version generates hash tables up to n = 20. The search will stop once a hash table is generated with one nonunique index. This index is then identified as the correct motif, which we call the kmer. To reduce the search space, hash tables with n = 1 to n = 5 are not generated. Motifs with k <6 are identified by searching for internal repeats in larger kmers. For example, a 4mer will be initially identified as an 8mer, but it will be further broken down into two 4mers of the same sequence. Once the kmer is identified, the number of occurrences is determined using the regular expression function of Perl. The identification step and the counting step used to be two separate scripts; they are now combined in the k_seek.pl script for ease of use. Further documentation can be found at https://github.com/weikevinhc/k-seek.
Library Preparation and Sequencing
For the comparison between PCR and PCR-free libraries, DNA was extracted from a pool of 20 females from line T23 of the Global Diversity Lines (Grenier et al. 2015) using a Qiagen DNeasy Blood and Tissue kit (Cat# 69504). Libraries were generated in parallel with Illumina TruSeq DNA PCR-Free Library Preparation Kit (Cat# FC-121-3001) and TruSeq Nano DNA Library Prep Kit (Cat# FC-121-4001). For each of the three conditions (PCR-free, 8-cycle, and 12-cycle), three barcoded replicates were made. Barcoded libraries were then pooled and concentrated for one lane of 100-bp Illumina HiSeq 2500 single-end sequencing.
For WGS of the nine species, we used the same stocks as in (Drosophila 12 Genomes Consortium 2007), with the addition of the iso-1 genome-sequenced strain of D. melanogaster, and the Winters-2 line of D. simulans. DNA was extracted separately from ∼20 male and female flies using Qiagen DNeasy Blood and Tissue kit, and libraries prepared with TruSeq DNA PCR-Free Library Preparation Kit. The barcoded libraries were pooled and sequenced on one lane of Illumina HiSeq 2500 100-bp single-end with High Output mode and a second time using paired-ends on two lanes with 125-bp Rapid Run mode. All sequencing was done by the Genomics Core Facility, Cornell University (Ithaca, NY). The sequences are available on SRA, accession number PRJNA423291.
Processing Whole Genome Sequences
Quality checking of the reads was done using FastQC (http://www.bioinformatics.bbsrc.ac.uk/projects/fastqc/). We then used k-Seek to quantify satellites from the raw sequences which we have updated since the initial publication (Wei, Grenier, et al. 2014). To obtain average autosomal read depth, we aligned the reads to the reference assemblies of the respective species available on Flybase (Attrill et al. 2016) using BWA version 0.7.13-r1126 with default settings (Li and Durbin 2009). After sorting the aligned files with Samtools version 1.3.1 (Li et al. 2009), we used Bedtools v2.26.0 to obtain the read depth distribution for uniquely mapping reads to the autosomes (Quinlan and Hall 2010) which we then averaged. For species that do not have clear designations of the chromosomes in the reference assembly, we identified the sex chromosomes by identifying contigs that are at roughly half the coverage of the other contigs in males. These contigs are then excluded, and an average read-depth was obtained from remaining contigs that are over 5 Mb in length.
Where ck and lk are the copy number as reported by k-Seek and the length of k, respectively. The list of all simple satellite, their abundances, and their species distribution can be found in supplementary table 4, Supplementary Material online.
For TE counts, the sequences were aligned to the TE index downloaded from RepBase (Bao et al. 2015) using bowtie2 version 2.2.8 (Langmead and Salzberg 2012). Reads aligning to the different TE entries in the index were counted by parsing the SAM files.
All subsequent analyses were completed using R.studio (RStudio Team 2015).
To determine the extent of contamination in the D. sechellia sample, we mapped it to the D. mojavensis reference and compared the alignment of each read to the two references. Reads were considered to be of D. mojavensis origin when they had higher mapping quality to D. mojavensis compared with D. sechellia. We identified 1, 675, 972 such reads, which is 7.7% of all D. sechellia male reads. This represents 10.0% of the mapped D. mojavensis male reads (16, 695, 229). These reads were then removed from the D. sechellia male sequences. Since much of the simple satellite quantification is from unmapped reads or multiply mapped reads which cannot be assigned unambiguously to the two species, we removed D. mojavensis contamination in the k-Seek quantification by subtracting 10.0% of the D. mojavensis male quantities from the D. sechellia male.
Male-Biased Repeats
Male-biased (Y-linked) satellites were determined if the satellite’s abundance is >1.5-fold higher in males than in females with a P value of < 0.01 (Fisher’s exact test). Y-specific satellites are male-biased satellites absent in females. Male-biased TEs are those with >10 reads (which is equivalent to >1,000 bp) and >1.5-fold higher than females with a P value of < 0.01 (Fisher’s exact test).
Phylogenetic Inference
To estimate phylogenies from simple-satellite data, we first averaged the kmer abundances between males and females within each species to obtain a species-wide kmer profile. We employed two methods of phylogenetic estimation: distance-matrix based and maximum-parsimony based. The lack of an analytical evolutionary model for kmers precluded us from trying maximum likelihood or Bayesian approaches. For the distance-based phylogeny, we first standardized each kmer to mean 0 and variance 1 to make them comparable (although note that this makes implicit assumptions about the underlying evolutionary process), then calculated a distance matrix using the Euclidean distance between species. The distance matrix was fed into the neighbor-joining algorithm (Saitou and Nei 1987). For maximum parsimony, first we coded kmers as discrete characters based on the order of magnitude of their abundances in base pairs—an abundance was coded as 0 if the kmer is absent in a species, and as k if it is present in 10k−1−(10k−1) base pairs in a species. We defined the cost of evolutionary transitions between different states to be proportional to the number of orders of magnitude gained or lost—for example, going from hundreds to thousands of base pairs takes one evolutionary step, but going from hundreds to tens of thousands takes two. Finally, we used the Sankoff algorithm (Felsenstein 2004) to infer the most parsimonious tree given the data and the defined evolutionary costs. We rooted all trees at the branch leading to the D. virilis + D. mojavensis clade.
Inferring Gains and Losses across the Phylogeny
Based on the presence/absence of kmers, we devised a simple parsimony scheme to infer gains and losses. Gains and losses are deemed equally probable along the phylogeny. Ambiguous events and independent gains are tallied in supplementary table 3, Supplementary Material online. For supplementary figure 8, Supplementary Material online, we added an additional stipulation that two independent gains are less likely than a gain and a loss, to resolve ambiguities in favor of losses.
Mutational Distance between Kmers
To identify kmers that are one mutational step away, we first generated the pairwise Levenshtein distance using the R package “stringdist” (van der Loo 2014). The Levenshtein distance accounts for the minimal number of substitutions, insertions, and deletions required to change from one character sequence to another. For pairs with distances of >1, we reassessed the Levenshtein distance taking into account the reverse complement and all possible offsets of the kmers, and picked the lowest distance. Because the Levenshtein distance is not suitable for indels >1 bp, as it counts each additional character in the inserted/deleted sequence as one change, we also reevaluated potential indel pairs such that insertions and deletions >1 bp will be counted as only one change. kmers 3 bp or less in length were excluded since they, through a single insertion, can easily generate large numbers of kmers and therefore create uninformative connections. To generate confidence intervals for the proportion of connected satellites, we boot-strap sampled n−2 satellites where n is the number of satellites within species. For the random set to compare with, we randomly sampled n−2 satellites from the list of 207, and proceeded with the same bootstrap procedure. The satellite networks were generated using the “statnet” package in R (Handcock et al. 2003).
Fluorescence In Situ Hybridization
We used the probes AATAGAATTGAATAGAATTGAATAGAATTG and AAGAGAAGAGAAGAGAAGAGAAGAG which are 5′ labeled with Cy3 and Cy5, respectively (ordered from Sigma). We dissected the brains of wandering third instar larvae from the D. melanogaster strain Canton-S and D. simulans strain w501. Preparation of the tissues and hybridization procedure were based on the protocol by (Larracuente and Ferree 2015). Images of the mitotic chromosomes were taken using a Zeiss LSM710 confocal microscope (Institute of Biotechnology, Imaging Facility, Cornell University) and processed with the ZEN image-processing software.
Supplementary Material
Supplementary data are available at Molecular Biology and Evolution online.
Acknowledgments
We thank Michael McGurk, Ching-Ho Chang, Dr Anne-Marie Dion-Cote, Dr Grace Yu Chwen Lee, and Dr Satyaki Prasad for helpful comments and discussions. We also thank Dr Justin Blumenstiel and anonymous reviewers for insightful reviews. This research was funded by National Institute of Health R01-GM119125 to D.A.B. and A.G.C. and R01-GM074737 to D.A.B.
References
Author notes
Associate editor: Harmit Malik
