


Abstract
The process of plant domestication is often protracted, involving underexplored intermediate stages with important implications for the evolutionary trajectories of domestication traits. Previously, tomato domestication history has been thought to involve two major transitions: one from wild Solanum pimpinellifolium L. to a semidomesticated intermediate, S. lycopersicum L. var. cerasiforme (SLC) in South America, and a second transition from SLC to fully domesticated S. lycopersicum L. var. lycopersicum in Mesoamerica. In this study, we employ population genomic methods to reconstruct tomato domestication history, focusing on the evolutionary changes occurring in the intermediate stages. Our results suggest that the origin of SLC may predate domestication, and that many traits considered typical of cultivated tomatoes arose in South American SLC, but were lost or diminished once these partially domesticated forms spread northward. These traits were then likely reselected in a convergent fashion in the common cultivated tomato, prior to its expansion around the world. Based on these findings, we reveal complexities in the intermediate stage of tomato domestication and provide insight on trajectories of genes and phenotypes involved in tomato domestication syndrome. Our results also allow us to identify underexplored germplasm that harbors useful alleles for crop improvement.
Introduction
Plant domestication often involves initial cultivation of individuals of a wild plant species with desirable traits, followed by a later stage of improvement of those traits through selective breeding (Gross and Olsen 2010; Meyer and Purugganan 2013). However, the domestication history of crops can often be protracted, with populations in intermediate stages experiencing multiple evolutionary changes, such as altered population size, hybridization with ancestral populations, and loss of desirable traits (Bagavathiannan and Van Acker 2008). Such evolutionary changes can greatly impact the genetic and phenotypic variation available for each subsequent domestication step. Focusing exclusively on the endpoints of domestication processes can thus obscure the evolutionary trajectories of favored traits and genes. A thorough understanding of the tempo and limits of domestication entails examining the intermediate stages and their associated evolutionary changes.
The common cultivated tomato (Solanum lycopersicum L. var. lycopersicum; SLL) is the world’s highest value vegetable crop (http://www.fao.org/faostat/en/; last accessed December 26, 2019) and an important model organism for fruit development. Previous studies (Blanca et al. 2012, 2015; Lin et al. 2014) have proposed that wild red-fruited S. pimpinellifolium L. (SP) was domesticated in South America to give rise to S. lycopersicum L. var. cerasiforme (SLC), and SLC later gave rise to SLL in Mesoamerica through subsequent improvement. Tomato domestication history is generally depicted as a “two-step” process with an increase in fruit size from blueberry-sized SP to generally cherry-sized SLC, and then to the very large-fruited common tomatoes (Lin et al. 2014) consumed around the world. However, little is known about the evolutionary history of SLC, which is considered the intermediate group in tomato domestication but with a status that has been historically contentious. For years, the SLC term was applied to an assortment of forms with cherry-sized fruit that included escaped (feral) SLL worldwide and hybrid offspring between SLL and wild species (Ranc et al. 2008). Recent studies, however, have revealed that SLC is a true taxonomic group with origins in central South America (Blanca et al. 2012, 2015). A comprehensive understanding of tomato domestication history thus requires broad sampling of native SLC populations, and exclusion of feral or hybridized germplasm that represent modern offshoots of cultivated SLL.
A related obstacle to understanding tomato domestication history is that modern (20th century) breeding has incorporated alleles from multiple, sometimes distant, wild species into SLL for improved disease resistance and other industry-friendly traits (Hajjar and Hodgkin 2007). This introgressed germplasm can obscure the true patterns of domestication history. Overcoming this hurdle requires sampling of SLL landraces instead of modern improved varieties, as landraces are likely to more closely resemble the earliest diverging SLL.
In this study, we employ whole-genome sequencing, population genomics, and a comprehensive sampling of SLL, SLC, and SP to reconstruct tomato domestication history. In particular, we determine the role of SLC in the origin of SLL, assess the extent of genetic and phenotypic diversity in SLL and its closely related populations, and elucidate the genotypic and phenotypic changes that may have occurred at each step of tomato domestication history. Such insights facilitate identification of beneficial alleles for reintroduction to modern tomato varieties to improve its agriculturally desirable traits.
Results
Population Delimitation
We generated new whole-genome sequences for 166 samples, representing SP across its native range in South America and SLC across its native range in South America and Mesoamerica, along with SLL landraces from Mesoamerica, which previously have been undersampled (supplementary table 1, Supplementary Material online). We analyzed these newly generated data with 394 previously published tomato genome sequences (Aflitos et al. 2014; Lin et al. 2014), which comprised mostly SLL worldwide, but also some SP and SLC. We excluded published sequences that did not meet our quality or identity criteria (see Materials and Methods), in particular, discarding samples with >25% missing data, SLL with known wild introgressions from modern breeding practices, and dubious accessions designated as SLC but with origins from outside the Americas. Our final set included 295 accessions comprising 49 SP from South America, 153 SLC from South and Mesoamerica, 92 SLL accessions from Mesoamerica and elsewhere, and one accession of S. pennellii Correll included as outgroup. A total of 23,797,503 single nucleotide polymorphisms (SNPs), including 300,687 synonymous and 357,572 nonsynonymous SNPs were identified by aligning sequences to the SLL reference genome (“Heinz 1706,” build SL2.50) (Sato et al. 2012). We also obtained 4,303,329 small (≤10 bp) indels. We detected a moderate number of large insertions (>10 bp; see Materials and Methods) common or fixed in SLC and SLL, but largely absent in SP, but a surprisingly low number of genes affected by these insertions (supplementary table 2, Supplementary Material online).
We used a data set of 4-fold degenerate (4D) SNPs to reconstruct the phylogeny of the 295 accessions, and estimated population structure using whole-genome SNPs (fig. 1a, supplementary figs. 1 and 2 and table 3, Supplementary Material online). As has been previously documented for colored-fruited tomato species, levels of genetic diversity are low, leading to short branches, particularly in SLL (supplementary fig. 1, Supplementary Material online). Nonetheless, we noted high congruence between phylogenetically defined clusters, population structure results, predominant geographic origin, and group designations (SP, SLC, or SLL) in passport data (fig. 1a). Only a few accessions identified as SLL in passport data resolved outside of the SLL phylogenetic cluster, occurring within clusters of SLC accessions and likely indicating unrecognized modern introgressions; these accessions were excluded from subsequent analyses. We also identified some accessions labeled as SLC resolving within the SP clusters. These tended to be genetically heterogeneous based on structure analyses, were of variable geographic origin, and were distant from all other SLC in their phylogenetic placement, perhaps indicating diverse origins through admixture. Due to our inability to reliably assign these accessions to any population, we excluded these from our subsequent analyses. The remaining accessions were placed in nine well-defined populations, based on the combined criteria of phylogeny, structure, geographic origin, and passport data; these designations are further supported by congruent results of a principal components analysis (PCA; fig. 1c).
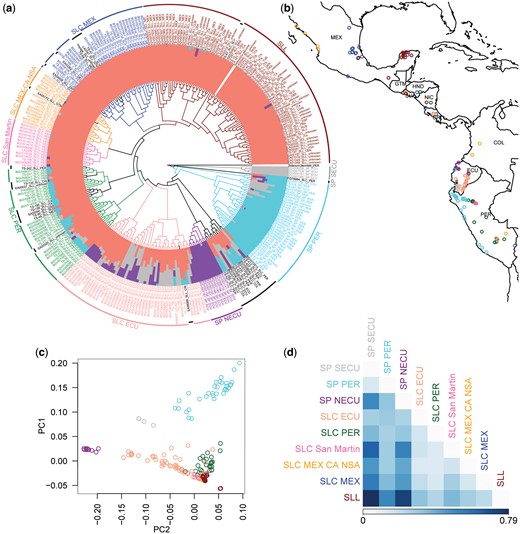
Population delimitation of SLL and closely related groups. (a) A coalescent-based phylogenetic tree (central area) constructed in SVDQuartets using whole-genome 4D SNPs; population structure (color bars associated with tree tips) constructed in fastSTRUCTURE using all genomic SNPs after quality filtering; population delimitations of each accession is provided with country abbreviations and lines in different colors. Main populations as well as unassigned accessions (black) were delimited following the results of ancestral structure, phylogenetic clustering, geographic origin, and passport data (see Materials and Methods). (b) Distribution map of each accession, excluding the unassigned accessions and SLL accessions from outside South and Mesoamerica (see Materials and Methods). (c) PCA based on genomic SNPs of all accessions except those unassigned in (a). The first two principle components explain 13.21% and 8.04% of the total variation. (d) Pairwise population differentiation estimated using FST.
Our results suggest three strongly differentiated populations of SP based on structure analyses and FST (Weir and Cockerham 1984) (fig. 1d, supplementary table 4, Supplementary Material online). The differentiation between northern and southern Ecuadorian SPs (SP NECU and SP SECU; FST = 0.50) is suggestive of a barrier to gene flow, consistent with SP SECU being limited to montane regions, and SP NECU occurring primarily in coastal areas (fig. 1b and supplementary table 1, Supplementary Material online) (Nakazato and Housworth 2011; Blanca et al. 2015). Unlike the Ecuadorian SP, the Peruvian SP (SP PER) incorporates accessions with unique population membership as well as ones that have some genetic similarity to SP SECU, suggesting gene flow or shared ancestry between these groups.
Our criteria detected five populations of SLC, with varying degrees of genetic heterogeneity and population structure (fig. 1a and d) and a wider geographic range compared with SP (fig. 1b). We distinguished three primarily South American SLC groups: a heterogeneous group with some genetic similarity to SP populations, based on structure, and distributed primarily in the Amazonian region of Ecuador (SLC ECU), a Peruvian group largely occurring on the eastern slopes of the Andes (SLC PER), and a more localized and genetically homogeneous group in northern Peru (SLC San Martin). A group of SLC accessions primarily from Mexico, Central America, and northern South America (SLC MEX-CA-NSA) and another group occurring predominantly in Mexico (SLC MEX) represent the northernmost populations of SLC. Despite similarity in population structure (fig. 1a), SLC San Martin, SLC MEX-CA-NSA, and SLC MEX are geographically distinct and are similarly differentiated from each other based on FST as to other SLC groups (fig. 1d). Also, most SLL accessions form a separate cluster, characterized by very short branch lengths, despite having similar population structure with three SLC groups (fig. 1a and supplementary fig. 1, Supplementary Material online). Of all SLC groups, SLC MEX has the lowest level of population differentiation with SLL (FST = 0.21). Within SLL, we observed a mostly Mexican subgroup and another with both Latin American accessions and other cultivated varieties consumed worldwide (fig. 1a). Our results are consistent with prior hypotheses of an origin of SLL in Mexico, after a northward spread of SLC to northern South America and Mesoamerica (Blanca et al. 2012). The precise sequence of events is explored further below.
Population History
We estimated linkage disequilibrium (LD) in each identified population based on average r2 for SNPs within 1,000 kb from one another (supplementary fig. 3, Supplementary Material online). Lowest values of LD were observed in SP PER and SLC MEX. Also, we observed very high LD in SP SECU, which may be attributed to undersampling of this population due to lack of prior knowledge of some differentiation between SP populations in southern and northern Ecuador.
We also calculated genome-wide levels of genetic diversity (table 1) to test for the possibility of bottleneck events in the major steps of tomato domestication history, as has been previously suggested (Lin et al. 2014; Blanca et al. 2015). Genetic diversity in SLC ECU is relatively high and comparable with SP populations. This suggests that the transition from SP to SLC may not have entailed a bottleneck event, although secondary contact between SP and SLC ECU could also explain this observation. Concordant with a prior study (Lin et al. 2014), levels of nucleotide diversity (π) are an order of magnitude lower in SLL, consistent with bottlenecks associated with domestication. However, Watterson’s theta (ΘW) in SLL is comparable with that of several other SLC populations (table 1). To further explore demography, we calculated average Tajima’s D for each population, and observed that SLL has a much more negative Tajima’s D than any other group (table 1), indicating an abundance of rare alleles. That this excess of rare alleles is likely driven by low-frequency derived alleles is confirmed by comparisons of the site frequency spectrum (SFS) across populations (supplementary fig. 4, Supplementary Material Online).
Genome-Wide Estimates of π, Watterson’s Θ, and Tajima’s D from 10-kb Windows for Populations Delimited in This Study.
| Population | HE | HO | π | Watterson’s Θ | Tajima’s D |
|---|---|---|---|---|---|
| SP SECU | 0.36684 | 0.06948 | 0.00071 | 0.00092 | 0.20780 |
| SP PER | 0.15502 | 0.04953 | 0.00038 | 0.00059 | −0.71840 |
| SP NECU | 0.25151 | 0.04624 | 0.00066 | 0.00088 | −0.26170 |
| SLC ECU | 0.19438 | 0.02074 | 0.00069 | 0.00079 | 0.00608 |
| SLC PER | 0.17290 | 0.01690 | 0.00038 | 0.00055 | −0.69670 |
| SLC San Martin | 0.24020 | 0.02304 | 0.00021 | 0.00026 | −0.38550 |
| SLC MEX-CA-NSA | 0.21702 | 0.02823 | 0.00048 | 0.00064 | −0.29230 |
| SLC MEX | 0.14028 | 0.00791 | 0.00017 | 0.00030 | −0.95790 |
| SLL | 0.04781 | 0.01076 | 0.00003 | 0.00012 | −1.39500 |
| SLL ex. 10 | 0.06583 | 0.01158 | 0.00003 | 0.00009 | −1.19800 |
NOte.—“SLL ex. 10” refers to SLL after excluding ten potentially modern admixed accessions (supplementary table 3, Supplementary Material online).
In exploring the provenance of these rare alleles, we identified ten SLL accessions with small signs of admixture from SP or SLC in our structure analysis (fig. 1a), which uniquely contain 49% of the rare alleles. According to passport data, these are mostly modern cultivars (Aflitos et al. 2014; Lin et al. 2014), which are likely to contain exotic introgressions acquired through contemporary breeding and which had escaped our initial culling of modern improved varieties (supplementary table 3, Supplementary Material online). After excluding these accessions, SLL still had a substantially negative Tajima’s D (table 1) and skewed SFS (supplementary fig. 4, Supplementary Material Online), indicating that prevalence of rare alleles also occurs in landraces and less improved SLL cultivars. Of the rare alleles in these remaining SLL accessions, 31% were unique to SLL, with the remainder segregating in SLC and/or SP. This suggests that many rare alleles in the SLL landrace/unimproved cultivars pool were acquired from SLC standing variation, a few are from wild groups such as SP, but a substantial portion may be novel. These results are further supported by the occurrence of a high proportion of private derived alleles in SLL at primarily low frequencies (supplementary table 5 and fig. 5, Supplementary Material Online). The accumulation of low-frequency novel alleles could be due to mutation during population expansion as the crop was spread around the world or relaxation of natural selection allowing for accumulation of deleterious mutations (Moyers et al. 2017). However, the possibility of minor introgression of some SLL with untested distant groups cannot be completely ruled out.
We employed TreeMix (v1.13) (Pickrell and Pritchard 2012) to examine the order of divergence between the tomato populations defined above and the possibility of gene flow between them. We used the complete set of SNPs and found that a topology without gene flow (m = 0) explains 98% of the variance in SNP data (fig. 2a and supplementary fig. 6, Supplementary Material online). This tree has strong branch support, except for moderate support in the order of divergence of SLC San Martin, SLC PER, and SLC MEX-CA-NSA. Allowing for one gene flow event, we observed a higher model fit (99%), but a lower bootstrap support for some of the nodes on the resulting tree topology (fig. 2b, supplementary figs. 6 and 7, Supplementary Material online). Models with more gene flow events, up to m = 10, did not substantially improve fit, and only the gene flow event between SP PER and SLC PER had a consistently high support in all models (supplementary fig. 6 and table 6, Supplementary Material online); we thus took the m = 1 as the most reliable model. Both the m = 0 and m = 1 models confirm a close relationships between SLL and SLC MEX, but the two models differ in the position of SLC PER. Also, the clade including SLC MEX-CA-NSA, SLC MEX, and SLL has lower bootstrap support in the model with one gene flow event, indicating uncertainty in the placement of SLC MEX-CA-NSA.
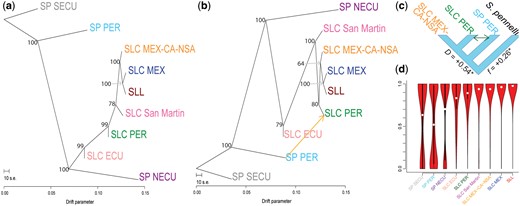
Gene flow and ADAFs. TreeMix topologies without gene flow (a) and with one suggested gene flow event (b) are presented. Bootstrap support values are provided for each node. The suggested gene flow event (orange arrow) were further evaluated using a four-taxon test (c). ADAF for SNPs containing different alleles for the SLL reference genome and Solanum pennellii is presented in (d). Derived alleles occur with relative high frequency on all populations, due to the distance between the outgroup and studied populations. However, derived alleles occurring in SLL are most common in SLC MEX, suggesting a close relationship.
We used a less-parametrized four-taxon test (Green et al. 2010) that relies on average allele frequencies per population to evaluate the gene flow event suggested by TreeMix and distinguish it from possible ancestral polymorphism. We devised this so that the tested relationship was consistent with both the m = 0 and m = 1 models (fig. 2c). Significant gene flow (26%, P value < 0.00001) between SP PER and SLC PER was supported, consistent with the admixture signature observed in the population structure results (fig. 1a).
To assess the evolutionary trajectory of alleles typical of SLL, we calculated average derived allele frequency (ADAF) in each population for SNPs with different alleles between the reference genome (an SLL) and the S. pennellii outgroup. We observed a gradual increase in ADAF comparing SP with SLC and SLC with SLL, as well as similar ADAF in SLC MEX-CA-NSA and in SLC San Martin (fig. 2d). These results support SLC MEX as the closest relative and possibly direct ancestor of SLL.
We also estimated divergence dates for major events in tomato domestication history using ∂a∂i (Gutenkunst et al. 2009). We evaluated models that allowed for gene flow at different points of divergence as well as models incorporating changes in population size (supplementary fig. 8, Supplementary Material online) and found the complex models to often be more statistically supported (supplementary fig. 9 and table 7, Supplementary Material online), suggesting that prior studies may have underestimated divergence times for tomato domestication history. According to our results, SLC probably diverged from SP ∼78 thousand years ago (ka; ±19 ka). The initial divergence of northern groups was estimated to be 13 ± 2 ka, with a subsequent divergence of the SLC MEX + SLL group almost 10 ± 1 ka. We estimated that the origin of SLL occurred ∼7 ka, without expansion in SLL population size (nu2 = 0.35, supplementary table 7, Supplementary Material online), suggesting that the extreme Tajima’s D in SLL may be driven more by accumulation of deleterious mutations during the domestication process. We note that the general complexities of crop domestication histories, which often involve population expansions, bottleneck events, and secondary contacts, as well as strong positive selection that can have large genomic effects through linkage, make it particularly challenging to fit demographic models. Despite our efforts to incorporate these factors in our models of tomato domestication history, we caution that there are inherent uncertainties to our date estimates, as illustrated by the residual values obtained.
Our analyses suggest a complex population history for cultivated tomato and its relatives. Based on the combined results of all population history analyses presented here, we propose the following scenario for tomato domestication (fig. 3). SLC probably diverged from SP over 78 ka, which predates estimates of human presence in South America and Mesoamerica, and was likely through natural divergence rather than a domestication event. High genetic heterogeneity in SLC ECU is likely due to ancestral polymorphisms and/or gene flow after the divergence process with SP, according to the best supported ∂a∂i model. Subsequently, SLC seems to have spread into Peru (SLC PER and SLC San Martin), with SLC PER experiencing local gene flow with SP PER. Between 10 and 13 ka, the SLC MEX-CA-NSA, and SLC MEX originated followed by their northward spread to Mesoamerica. We cannot readily distinguish whether these two SLC groups spread northward independently or diverged from each other after their northern migration, but the occurrence of some accessions from each group in South America could indicate separate northward spreads. The common cultivated tomato (SLL) and SLC MEX seems to have diverged ∼7 ka, with a portion of SLL subsequently taken to Europe from where it spread to other countries around the world. Although the northward spread of SLC and origin of SLL overlap with human presence in Mesoamerica and South America and may have been mediated by humans, the timing of SLC origin in South America raises questions about the role of humans in the origin of this group.
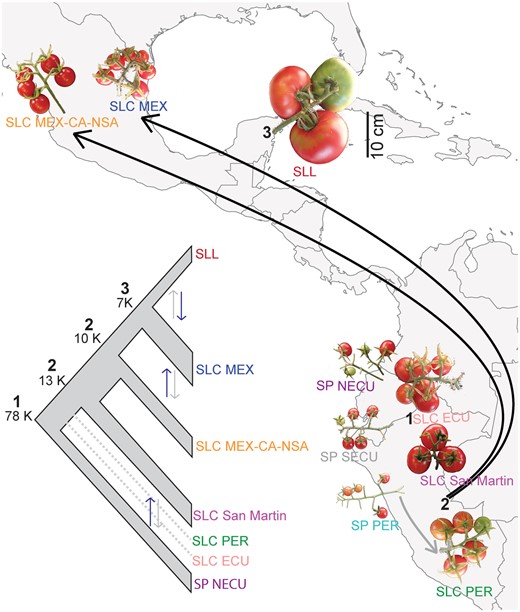
Inferred tomato phylogeny and domestication history based on the combined results of population history analyses and comparisons of median fruit size. Estimates of divergence times and changes in population sizes using ∂a∂i are provided for the major events in tomato domestication history (left panel): origin of SLC (1), northward spreads of SLC (2), and redomestication of SLL (3). Asymmetric gene flow between groups is shown by double arrows with black arrow representing stronger gene flow in that direction. Width of the branches on the summary tree represents population expansion or contraction. Dotted lines represent populations included only in the models examining the origin of SLC (1). In the right panel, a transition to wild-like fruit sizes is evident in the northernmost populations of SLC (SLC MEX and SLC MEX-CA-NSA). A scale bar (=10 cm) applicable to all fruit images is provided. Black arrows represent northward spreads of SLC. Gray arrow represents gene flow between SP PER and SLC PER.
Evolution of Traits Associated with the Tomato Domestication Syndrome
To understand how fruit phenotypes have changed throughout tomato domestication history, we measured several traits of importance for tomato breeding and consumer appeal (Paran and Van Der Knaap 2007; Huang and van der Knaap 2011) in our original sequenced set of accessions. It is evident that the common cultivated tomato accessions (SLL) have experienced radical changes compared with wild tomato (SP) phenotypes, with fruits that on average have thicker pericarps, more locules, lower dry weight, lower levels of beta-carotene, soluble solids, and citric acid, and higher levels of malic acid (fig. 4). Many of these SLL phenotypes (though not all; see, e.g., malic acid) are also evident to some degree in the South American SLC populations, which is consistent with the transition of SP to SLC representing a domestication event in which many of the same phenotypic trends as in SLL were favored. Curiously, for many of these domestication phenotypes, there seems to be an N- (or И-) shaped pattern when considering medians of the phenotypes for populations in the order of the transition from SP to SLC and subsequent likely geographic expansion from South America to Mesoamerica. That is, taking the population history model we have suggested above (fig. 3), and assuming current population phenotypes reflect those at time of divergence, the trend suggests a general wild-to-domesticate phenotypic transition in the South American SLC populations (SLC ECU, SLC PER, and SLC San Martin), a reversal to generally wild-like phenotypes in the northern SLC populations (SLC MEX-CA-NSA and SLC MEX), and finally a second wild-like to domesticate phenotypic transition in the SLL. This trend also suggests that the expansion of SLC to northern South America and Mesoamerica either relaxed artificial selection for human-preferred traits or favored wild-like phenotypes, perhaps as a necessity for adaptation to local conditions at higher latitudes.
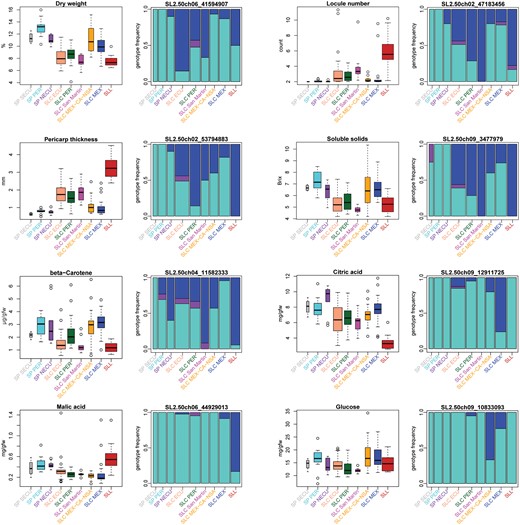
Phenotypic and genotypic changes of eight agriculturally important fruit traits (a–h) through tomato domestication history. For each trait, the phenotypic distribution (left) and the genotype frequencies of the most significantly correlated SNP from GWAS (right) are presented. In the genotype frequency plots, alleles frequent in SP were considered as ancestral homozygous genotypes for these and are shown in turquoise; homozygotes for derived alleles are shown in blue. The frequency of heterozygotes is shown in purple. Bar widths are proportionate to the sample size of each population. An N- (or И-) shaped trend (see Results) is evident in many of the phenotypes presented.
Interestingly, some phenotypes commonly believed to be domestication traits, such as lower tomatine content (Zhu et al. 2018), appear not to be a result of any domestication process in tomatoes, but are more likely associated with local preference or local adaptation, as levels are highest in a single SP group (SP SECU) and show increased variance in Peruvian SLC populations and in SLL (supplementary fig. 10, Supplementary Material online). Likewise, lycopene, the pigment responsible for red color of tomato fruits, seems to have decreased in content upon origin of SLC but shows no marked trend in the origin of SLL (supplementary fig. 11, Supplementary Material online).
For each of the phenotypes observed, we obtained the highest correlated variants through genome-wide association studies (GWAS, supplementary fig. 12, Supplementary Material online). Our most significant variants were often located within or close to known or novel plausible candidate genes, suggesting that our GWAS results are revealing causal or closely linked loci for many of the traits tested (table 2). For example, concentration of soluble solids (Brix) was correlated with a missense SNP (Asn to Asp) within Lin5 (Solyc09g010080), which codes for a beta-fructofuranosidase, an extra-cellular invertase involved in sucrose metabolism, and which has previously been implicated in changes in sugar content in tomato domestication (Tieman et al. 2017). Locule number is associated with the well-characterized transcription factor WUSCHEL, which is involved in stem cell fate (Munos et al. 2011). Malic acid was associated with an indel upstream of Solyc06g072840, which codes for a hydrogen peroxide-induced protein 1, a gene highly expressed in tomato fruits and seeds and part of a coexpression network involved in the Krebs cycle (CoNekT 2019), through which malic acid is converted to citric acid, making it a likely candidate for the trait.
A List of SNPs with the Highest Association (lowest P value below Bonferroni cutoff) with the Phenotypes Examined in Figure 4.
| Trait | Top Associated SNP (chromosome, position) | Associated Gene if No Known Candidate | Known Candidate Locus in Region | Function |
|---|---|---|---|---|
| Dry weight | 6, 41594907 | Solyc06g066330 | None | Poly polymerase catalytic domain |
| Locule number | 2, 47183456 | NA | WUSCHEL (Solyc02g083950) | Determining stem cell fate |
| Pericarp thickness | 2, 53794883 | NA | CNR (Solyc02g090730) | SQUAMOSA promoter binding protein-like |
| Soluble solids | 9, 3477979 | NA | LIN5 (Solyc09g010080) | Beta-fructofuranosidase |
| Beta-carotene | 4, 11582333 | Solyc04g019320 | None | PIF1-like helicase |
| Citric acid | 9, 12911725 | Solyc09g018100 | None | Ulp1 protease family C-terminal catalytic domain containing protein |
| Malic acid | 6, 44929013 | Solyc06g072840 | None | Hydrogen peroxide-induced protein 1 |
| Glucose | 9, 10833093 | NA | Solyc09g015490 | Transmembrane 9 superfamily member |
NOte.—Information on gene ID and function of the gene associated with each variant, or of known candidate genes in the GWA region are also provided.
In several cases, the N- (or И-) shaped trend we observed in phenotypes is also reflected in the genotypic distribution of the alleles correlated with each phenotype (fig. 4), indicating that derived “domestication alleles” increased in frequency during the origins of both SLC and SLL, but decreased in frequency in northern SLC groups. Some exceptions to this genotypic trend were observed, however, such as SLC MEX-CA-NSA and SLC MEX gaining a novel allele associated with increased average glucose content, and an increase in frequency of a novel or rare allele associated with increased average malic acid in SLL. The trend for citric acid, in contrast, is correlated with the increase in frequency of a rare derived allele in northern SLC populations which seems to have disappeared in SLL.
We also examined eight candidate genes that are known to control phenotypes underlying fruit trait variation in cultivated tomatoes and which may also be associated with domestication, such as fruit shape (OVATE and OFP20), fruit weight (CNR, KLUH, and CSR), locule number (WUSCHEL and CLV3), or jointed inflorescence (MADS1) (Huang and van der Knaap 2011; Rodriguez et al. 2011; Soyk et al. 2017). The distributions of causal allele genotypes for these genes (supplementary fig. 13, Supplementary Material online) also reveal a N- (or И-) shaped trend, similar to the trend above, for CNR, WUSCHEL, and MADS1, suggesting that genotypic distributions were affected by the origins of SLC and SLL, and the northward expansion of SLC. Similar to the trend described above, these causal alleles previously associated with tomato domestication seem to have been reduced in frequency in Mesoamerican SLC, but remained a part of the standing variation in these groups. Our results also revealed that CSR, which has been shown to be an important contributor to fruit weight (Mu et al. 2017), played a role at the origin of SLL, but not SLC. Comparing allele frequency distributions of CNR, WUSCHEL, and MADS1 with our ADAF results (fig. 2d) reveals that, although at a genome-wide level, SLC MEX and SLC MEX-CA-NSA are highly derived groups among the SLC, both groups seem to have experienced reversal to ancestral alleles for multiple loci associated with fruit domestication traits.
Based on these results and inferred population history, we make several inferences about the evolution of domesticated tomatoes. First, ancient divergence between SLC and SP suggests that SLC originated in Ecuador as a wild species (fig. 3). However, given the prevalence of domestication-type phenotypes in South American SLC and passport data indicating current human use, subsequent selection probably was human-mediated and favored several fruit traits similar to those favored in SLL. We also infer that the conditions experienced as SLC spread northward, led to, on average, more wild-like fruit phenotypes and sometimes to reversals in allele frequencies. These Mesoamerican SLCs are likely capable of surviving in the wild despite varying degrees of association with human-made habitats (supplementary table 1, Supplementary Material online). Last, we infer that a redomestication event from ancestors that were on average more phenotypically wild-like than South American SLC occurred during the transition from SLC to SLL in Mexico. Such a redomestication event was not necessarily de novo, as it seems to have involved reselection or reuse of ancestral domestication alleles that were reduced in frequency but persisted in SLC during its northward expansion. Thus, tomato domestication history encompasses a complex and multifaceted intermediate stage, in which diverse ancestral SLC populations experienced contrasting genotypic and phenotypic fates.
Genomic Signals of Selection during Tomato Domestication History
We conducted several analyses to identify the genomic regions under strong positive selection during each of the major stages of tomato domestication history. Putative selective sweep regions were identified based on genome-wide reduction in average nucleotide diversity (π ratio), genetic differentiation (FST), and deviation of SFS from neutrality, calculated using SweeD (Pavlidis et al. 2013) between ancestral and descendant populations. Significant regions were defined as those within the top 2% values for at least two statistics. Our highly conservative analyses were designed to decrease the possibility of false positives, and were used to reveal signals of selective sweeps during 1) the origin of SLC, comparing SP with SLC ECU, 2) the northward spread of SLC, comparing the South American SLC (SLC ECU-PER-San Martin) with the northward extensions of SLC (SLC MEX-CA-NSA and SLC MEX), and 3) the origin of SLL, comparing SLC MEX with SLL (supplementary tables 8 and 9, Supplementary Material online).
The origin of SLC seems to have involved a much higher number of putative sweeps (133) compared with any other group (SLC MEX-CA-NSA: 54, SLC MEX: 91, and SLL: 55; supplementary table 8, Supplementary Material online). This suggests that the origin of SLC involved selection on either more traits or traits with more underlying genes than any other main events in the evolutionary history of domesticated tomato. Gene ontology (GO) term enrichment among genes occurring in sweep regions (supplementary table 10, Supplementary Material online) revealed no clear trends in the examined transitions. The original transition of SP to SLC includes several terms related to intracellular transport and DNA repair, but the biological significance of selection on these genes is not obvious. Some GO terms possibly related to fruit ripening were overrepresented in sweeps specific to the northward spread of SLC, such as “carbohydrate metabolic process” and “cell wall macromolecule catabolic process.” At least one of the northward spreads (the origin of SLC MEX) has multiple GO terms related to plant defense (“chitin catabolic process,” “regulation of salicylic acid mediated signaling pathway,” and “regulation of defense response”), perhaps indicating the need to adapt to new biotic pressures. The diversity of terms overrepresented in the transition from SLC to SLL suggests that no single biological process dominated the selection landscape during the origin of modern cultivated tomatoes.
We then examined whether any loci associated with our examined fruit traits overlapped with sweep regions (supplementary table 11, Supplementary Material online). Although the exact locus targeted by selection cannot be determined from sweep data alone, overlap between GWAS and sweeps results is suggestive of which traits may have been shaped by positive selection during tomato evolution, and in some cases can be tied to known candidate genes. With our strict sweep filtering criteria, we found sweeps associated with GWAS peaks only for dry weight, locule number, soluble solids, and citric acid. Positive selection seems to have driven the increase in dry weight and locule number observed in the origin of SLC, and may have targeted the well-studied candidate gene WUSCHEL (supplementary fig. 13, Supplementary Material online). In contrast, soluble solids are the trait most associated with selection during the redomestication event leading to SLL. Interestingly, loci associated with both fruit size (locule number) and flavor (citric acid) overlap with sweeps in both northward expansion events of SLC, suggesting that some phenotypic changes observed in this expansion may have been driven by selection rather than drift. Notably, of the examined traits with N-shaped patterns, none gave selection signals during both the initial domestication of SLC and the redomestication of SLL, suggesting that not all phenotypic convergence between these events was necessarily driven by selection, or that selection for a given fruit trait was not equally strong for both events. However, if looser standards for detecting sweeps are adopted, such as a 5% cutoff, well-known genes affecting aspects of fruit development (e.g. WUSCHEL) or inflorescence structure (e.g. MADS1), appear close to sweeps in both SLC origins and SLL redomestication (supplementary table 12, Supplementary Material online).
We also explored whether our sweeps could provide clues on the diversity of phenotypes other than those related to fruit size in each step of tomato history. Although the exact gene targeted by selection in each region cannot be determined by sweep data alone, we focused our examination on genes with putatively known functions (fig. 5; supplementary table 13, Supplementary Material online). Thus, in the origin of SLC from SP, we found genes in sweep regions implicated in cold tolerance (MPK2; Lv et al. 2017), floral development (SlDEF; De Martino et al. 2006), fruit development (ETR2, SlOFP21, SlSUN14, and TBG3; Klee and Tieman 2002; Huang et al. 2013; Eda et al. 2016), drought tolerance (SlAGO4A and WAT1; Huang et al. 2016; Lee et al. 2018). These genes may have potential roles in the adaptation of SLC ECU to a more forested environment than is typical for SP. The origin of SLC MEX-CA-NSA, a group with a wide distribution and notable colonization of the dry western coast of Mexico is associated with a sweep that includes a gene for drought tolerance (CAT1; Li et al. 1998). In contrast, genes associated with disease resistance or defense are more apparent in sweeps in the origin of SLC MEX, for example SOLYC02G031790, NBS-IRR (Plant Resistance Gene Wiki; http://prgdb.crg.eu) and GAME12 (Itkin et al. 2013), consistent with the GO term overrepresentation, and possibly implying adaptation to growth under different biotic environments as tomatoes moved northward. Notable well-studied genes associated with sweep regions specific to redomestication of SLL from wild-like ancestors include LIN7, a cell-wall invertase that may be important for fertility (Slugina et al. 2018).
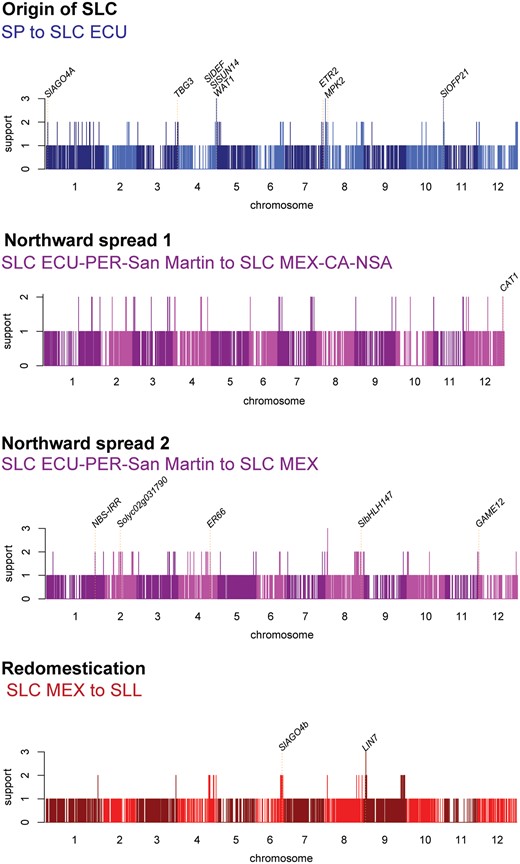
Signals of selective sweeps during the main events in the domestication history of tomato. Support (y-axis) for each sweep is defined as the number of statistics (π ratio, FST, and/or CLR) with a top 2% value for a potential sweep (see Materials and Methods) at a chromosomal position (x-axis). The position of well-studied genes is marked with dotted lines.
Last, we note that if our strict sweep filtering criteria is relaxed, many more previously characterized genes can be considered to show signs of selection during tomato domestication history. For example, we detected weaker signals of selection, that is based on single sweep statistics, for regions containing numerous well-studied genes involved in secondary metabolism, disease resistance, circadian clocks, photosynthesis, and fruit development and morphology (supplementary table 14, Supplementary Material online).
Discussion
We have reconstructed a putative domestication history of tomato groups, focusing especially on the underexplored intermediate stage represented by SLC. We found that SLC originated in Ecuador probably as a wild species over 78 ka, likely as a vicariance event that separated more coastal SP populations from inland emerging SLC. Curiously, despite the age of this SLC origin and the evidence for gene flow from SP in SLC PER, South American SLCs generally display fruit traits consistent with the tomato domestication syndrome (defined as traits we see in SLL), including tendencies toward larger fruit size than SP, thicker pericarps, more locules, lower citric acid, lower soluble solids, and lower beta-carotene. Though it is possible that natural selection may have shaped the fruit traits present in South American SLC, we speculate that it is unlikely that natural selection would overlap with human preference to such an extent. Unfortunately, too little is known of the animal dispersers of SLC in South America to determine if these fruit traits could have been driven by animal-mediated selection. Examination of passport data suggests that most South American SLC accessions have been collected in areas of human influence even when direct evidence of purposeful cultivation is only sometimes evident, with some collected SLC being sold in markets, but most coming from environments such as backyards and field edges (supplementary table 1, Supplementary Material online). Intermediate groups with evidence of human use are not uncommon in crops, and have also been reported for chiles, Capsicum annuum L. (Aguilar-Meléndez et al. 2009). Given this, we propose that consistent human use of SLC may have shaped fruit evolution in South American SLC, but only after SLC naturally diverged from SP. This human selection may have taken South American SLC to the point where domesticated plants have outnumbered purely wild SLC. In support of our hypothesis, when we partitioned the SLC ECU group into two clusters according to our phylogenetic tree (fig. 1a), one cluster presents a smaller median fruit size and more closely resembles the typical SP phenotype (supplementary fig. 14, Supplementary Material online). However, this clade also presents more shared population structure with SP, making it difficult to disentangle the effects of possible gene flow on phenotypes. We do note, however, that our analyses did not detect significant gene flow between the more distant SP groups and SLC ECU, suggesting the similarity is likely due to shared ancestral polymorphisms.
Although SLC accessions that feature traits consistent with domestication are persistent in South America, remarkably, these traits were reduced once SLC spread north. SLC populations in northern South America, Central America, and Mexico on average have smaller fruits, with fewer locules, thinner pericarps, and higher levels of beta-carotene and citric acid than South American SLC. With origins of these groups occurring about 10–13 ka, it is possible that the northward spread was carried out by humans, either purposefully or unintentionally, as a weedy companion. It could be that domestication traits were reduced because these SLC populations became more feral, that is less associated with/selected by humans as they spread northward. However, despite the reduction of domestication traits, SLC in northern South America and Mesoamerica are still largely associated with human-created environments, though, not always under evident purposeful cultivation, for example within corn fields in Mexico (Chacon and Gliessman 1982; Casas et al. 2016) (supplementary table 1, Supplementary Material online). Alternatively, while spreading north, tomatoes would have encountered biotic and abiotic conditions associated with higher latitudes, such as changes in temperature, water availability, or pathogens. Thus, selection on genes responsive to these changed conditions could have imposed costs or opposed selection for human preference, leading to reduction of some domestication traits. At least some of the fruit traits that we surveyed are, such as citric acid and locule number, are associated with selective sweeps in the northern SLC groups, suggesting that the traits were shaped by positive selection imposed by new environmental conditions rather than relaxed selection and drift. Likewise, the occurrence of some genes associated with disease resistance and abiotic stress tolerance in sweeps in these groups support a role of selection during the northward expansions.
Taken together, our population tree, the identity of SLC groups that have spread north, our divergence date estimates for the northern migrations and for the origin of SLL, estimated levels of genetic diversity, and ADAF analysis, all are consistent with SLC MEX as the likely direct ancestor of SLL. Thus, the origin of the common cultivated tomato, SLL, about 7 ka, probably entailed reselection of domestication traits from phenotypically more wild-like SLC. Our interpretation of tomato domestication history could be altered if current population phenotypes for SLC groups differ greatly from ancestral populations at time of divergence. Despite the absence (to our knowledge) of archeological data on past tomato phenotypes, our redomestication scenario is bolstered by the presence of two separate Mesoamerican SLC populations with similar phenotypic distributions for many domestication traits. This suggests that the process of northward spread, which must have preceded origins of SLL, obligatorily entailed phenotypic changes each time it occurred. As an alternative, we have considered scenarios in which SLL evolved directly, as an improvement event, from South American SLC (SLC PER or SLC San Martin) with SLC MEX as a feral derivative of either SLL or South American SLC. However, independent origins of SLC MEX and SLL from South American SLC is not compatible with our best supported population trees (fig. 2a and b), and SLC MEX as a feral derivative of SLL is not consistent with higher levels of genetic diversity in SLC MEX (table 1), ADAF results (fig. 2d), or the greater geographic range of SLC MEX in Latin America (fig. 1b). Curiously, despite the wide geographic range of Mesoamerican SLC groups, extending to northern South America, cultivated SLL seems to have arisen only in Mexico. This event seems to have occurred in eastern Mexico, in a geographically distinct area from the SLC MEX-CA-NSA presence in Mexico.
Our scenario of an SLL origin from SLC MEX ancestors is consistent with arguments presented by Jenkins (1948) that the association of SLC with human environments as well as the abundance of native names for small, “weed-like” SLC forms in Mexico, in contrast to a paucity of names for the larger common cultivated tomato (i.e. SLL), support a more ancient establishment of these “weedy forms” in Mesoamerica, from which the cultivated tomato was subsequently domesticated. This reselection of domestication traits can essentially be considered a redomestication event, which was enabled by standing variation that maintained low-frequency domestication alleles for some traits, originally from South American SLC, in Mesoamerican SLC.
Conclusions
The results provided in this study can be applied in a broader context to the study of domestication dynamics and of convergent evolution, given the occurrence of similar traits in South American SLC and SLL and similarities between the two SLC groups that spread northward. Based on multiple lines of evidence provided in this study, we reveal the complexities in the intermediate stages of tomato domestication history and advocate for a broader sampling and higher care in defining the populations considered intermediate in the domestication history of any crop. Recently, a similar approach revealed complexities in maize domestication with improvement in South America after only partial domestication in Mexico as well as independent diversification of some semidomesticated lineages into landraces in Mexico and beyond (Grimaldo et al. 2018).
The manifold evolutionary changes among groups revealed by exploring the intermediate stages of tomato domestication have also direct implications for crop improvement. For example, higher beta-carotene content in the Mexican SLC (fig. 4), make this an attractive group in which to exploit genetic variants to improve levels of this anti-oxidant in cultivated tomatoes. Likewise, the gain of novel alleles for glucose in northern SLC groups (fig. 4) could provide a unique source of variants for a trait correlated with human taste preference (Tieman et al. 2017). These insights can help breeders identify these “lost alleles” for introduction to modern tomato varieties, thus improving agriculturally desirable traits.
Materials and Methods
Plant Material, Sequencing, and Variant Calling
Genomic DNA was extracted from a single seedling from 166 accessions (supplementary table 1, Supplementary Material online) using the Qiagen’s DNeasy 96 Plant Kit and quantified using a Qubit. Complete methods for our library preparation, whole-genome sequencing and variant calling can be found in supplementary notes, Supplementary Material online.
Selection of Population Data Set
Accessions with >25% missing data were excluded from the resulting total data set. An initial phylogenetic tree (not shown) was built using the coalescent-based SVDquartets method (Chifman and Kubatko 2014) implemented in PAUP (v. 4a157) (Swofford 2003) based on 23,339 4D SNPs, excluding SNPs missing in >10% of all accessions. The number of quartets was fixed to n3, where n is the number of individuals. Based on the initial tree and available passport data, SLL accessions resolved within the SP clades, SLL accessions classified as modern (F1 and “processing”), and accessions of SP and SLC with origins outside Latin America were then excluded from the extended data set. From the extended data set, 295 accessions, representing the three taxa of interest (SP, SLC, and SLL) as well as one accession of outgroup S. pennellii Correll, were included in the all subsequent analyses.
Discovery of Structural Variations
Representative accessions of each detected population, with higher sequence coverage (48 in total) were selected for larger (>10 bp) structural variant (SV) detection by comparison with the reference genome. Detailed methods for SV discovery are provided in supplementary note, Supplementary Material online.
Phylogeny and Population Structure
Using the same method and settings as the initial tree above, except with an exhaustive search of all possible quartets, the final phylogenetic tree of all included accessions was obtained based on 162,276 4D SNPs with missing data <10% in the accessions passing the filtering criteria.
Population structure was estimated in fastSTRUCTURE (v.1.0) (Raj et al. 2014) for 2–10 ancestral populations (K), using 8,871,314 SNPs with <10% missing data. The optimal number of ancestral populations to explain structure while maximizing the marginal likelihood (K = 4) was chosen based on the output from the chooseK algorithm provided in the fastSTRUCTURE software package.
Populations of each species were delimited following the results of ancestral structure and phylogenetic analyses. Several accessions, labeled in black in figure 1 and described as follows, were excluded from further analyses due to concerns of modern admixture that would obscure population history or inability to confidently assign a population of origin: 1) one accession identified as SLC (TS-67), which resolved within SLL cluster; 2) ten accessions identified as SLL (EA02054, EA03362, EA04939, LA0767, Voyage, TS-41, TS-48, TS-90, TS-138, TS-190), which resolved within SLC clusters; and 3) 13 accessions identified as SLC that showed heterogeneous ancestral structure and resolved within SP (BGV006767, BGV006148, BGV008042, BGV012613, BGV012615, BGV012626, PI378994, TS-262, TS-413, TS-423, TS-427, TS-430, and TS-431). After excluding these accessions, each monophyletic or paraphyletic cluster comprising accessions of the same taxa, with a similar ancestral structure and geographic provenance was considered as a separate population. Each such population was named after the geographical origin of the majority of accessions (>60%) composing that population. An SLC clade of accessions from San Martin, Peru, was defined as separate population from the rest of the Peruvian SLC, due to their distinct phylogenetic placement and population structure. The main SLL clade, which comprises both Latin American and modern accessions, was labeled SLL because it represents the tomatoes that are predominantly cultivated worldwide and because of the uncertain origin of many accessions in that group. A map emphasizing the native distribution of the populations was created using Maps package (v3.2.0; https://CRAN.R-project.org/package=maps) in R.
Diversity Analyses
A data set with the same accessions examined in the structure analysis, except without filtering SNPs for missingness, leaving 18,192,290 SNPs, was used for all population-genetic analyses herein. PCA was conducted using SNPRelate package (v1.10.2) in R (v3.4.0; https://www.r-project.org/; last accessed December 26, 2019) and the unassigned accessions were removed from the PCA output. Genetic diversity (π) and Tajima’s D were calculated using diploid sample sizes and for nonoverlapping 10-kb windows using VCFtools (v0.1.15) (Danecek et al. 2011). Watterson’s theta (ΘW) was calculated in R based on sample size, number of SNPs, and SNP density.
Linkage Disequilibrium
LD analyses were conducted separately for all nine populations defined in this study. Due to high computational demand of LD analyses, a reduced input data set was created for each group, keeping only one SNP per 1 kb. An unphased input was used because all groups are highly self-fertilizing. Mean r2 values were calculated in PLINK (v1.9) (Purcell et al. 2007), for all SNPs within windows of 1,000 kb in distance and the output was plotted in R.
Population Differentiation and Derived Alleles
Average pairwise population differentiation (FST) was calculated for all population pairs using diploid sample sizes and in 10-kb windows using VCFTools. ADAF per population was calculated in R using a VCFTools output for derived allele frequencies of all variants where reference allele differed from outgroup in each population within the same input used for the diversity analyses.
Allele Frequency Statistics for All Populations
We calculated the SFS as well as the proportion of private alleles in each population using custom scripts in R. We also created a list of SNPs with rare alleles (MAF <0.05) in SLL. We found that 89% (3,142,096 out of 3,536,874) of all SNPs segregating in SLL contain rare alleles. This could be due in part to intentional crossing of modern SLL cultivars with wild species to enhance agriculturally favorable traits (Hajjar and Hodgkin 2007). Based on population membership coefficients (supplementary table 3, Supplementary Material online), we identified ten accessions that contributed a disproportionate amount (49%) of rare alleles to our SLL samples, and noted that they displayed small signs of admixture in our population structure analysis. We thus excluded these potentially admixed accessions from the original data set of rare alleles in SLL (see Results) and searched for the rare alleles of remaining SNPs (51%) within other populations.
Population History
Relationships between populations as well as admixture between them was tested using TreeMix, using the same input used in fastSTRUCTURE analysis, except excluding accessions without assigned groupings. To account for the effect of LD, stretches of 1,200 SNPs were grouped together in separate windows (“-k 1200”), approximately representing 10-mb windows to account for LD, as in Pickrell and Pritchard (2012). We rooted the tree topologies with SLC NECU. TreeMix runs were conducted 11 times allowing for 0–10 admixture events (m). The model with the optimal number of admixture events, m = 1, was chosen based on the model fit score (fit = 0.99), beyond which the model fit scores improved only marginally. Bootstrap support for the resulting tree topologies was obtained using 100 bootstrap replicates. The admixture event suggested by the TreeMix results were further tested by in a four-taxon test, calculating average genome-wide D and f statistics (Martin et al. 2015) based on average derived and ancestral allele frequencies in each population, using the scripts provided by Simon H. Martin (https://github.com/simonhmartin/tutorials). Standard errors and significance of D and f were calculated in R, based on Z score obtained using the Weighted Block Jackknife procedure (Kunsch 1989; Green et al. 2010); |Z score| >2.58, that is P < 0.01, was considered significant.
Divergence Date Estimation
Population divergence times were estimated using ∂a∂i, which is, to our knowledge, the only available tool to estimate divergence dates using large unphased genomic data sets while allowing for testing complex models. ∂a∂i analyses were run using an input identical to the one used in fastSTRUCTURE analysis. For each tested divergence event, six models using folded option for the input, with and without gene flow and size change, were designed and tested. Each ∂a∂i analysis was conducted using at least 10 independent runs with 10,000 iterations for each run. The number of runs was increased until achieving convergence. Convergence was assured by finding at least three runs reaching the highest likelihood scores and similar parameter estimates. A neutral substitution rate of 10−8 substitutions per base pair per generation (Gaut 1998) and a generation time of 1 year were used to calculate divergence times. Random numbers between were used as starting parameter values. Errors for the divergence times were calculated based on 100 bootstrap run based on Godambe approach (Coffman et al. 2016).
Phenotyping
Direct measurements of fruit traits were made in summer 2016 using 1–3 replicates of all the accessions sequenced de novo in this study (supplementary table 1, Supplementary Material online). For details on phenotyping techniques, please see our supplementary notes, Supplementary Material online.
Genotyping Fruit Development Genes
Genotyping was conducted on eight genes previously reported to be involved in tomato fruit development: OVATE and OFP20, CNR, KLUH, CSR, WUSCHEL, CLV3, MADS1 (Huang and van der Knaap 2011; Rodriguez et al. 2011; Xu et al. 2015; Soyk et al. 2017). DNA extraction, PCR, and restriction were conducted as described in Rodriguez et al. (2011). Descriptions of PCR primers, restriction enzymes, and resulting fragments are provided in supplementary table 15, Supplementary Material online.
Genome-Wide Association Studies
A data set of all phenotyped SLC accessions sequenced in this study (supplementary table 1, Supplementary Material online) was used for GWAS, given the moderate levels of LD and larger sample size of SLC. This data set included small indels and “chromosome-zero” SNPs, but excluded SNPs with MAF <0.05 and missing rate >10%. Phenotypes with distributions that deviated significantly from normality (P value from Shapiro test <0.01) were normalized in R. GWAS was conducted using a mixed linear model provided in GEMMA (v 0.94.1) (Zhou and Stephens 2012). The associations were adjusted for population structure using a genetic relatedness matrix created also using GEMMA. P values from Likelihood Ratio Test were used for assessing significance. The significance cutoff was determined based on the effective number of independent SNPs calculated using the Genetic Type I error calculator (GEC, v0.2) (Li et al. 2012).
Selective Sweeps
We used R to calculate genome-wide reduction in average π in the descendant populations compared with their probable ancestors, calculated as a ratio (πancestor/πdescendant) within 10-kb windows. To avoid loss of information for the windows without genetic diversity (π = 0) in the descendant population, we changed the π values for those windows to the minimum window π in the descendant population. To detect genomic regions with high genetic differentiation, we calculated Weir and Cockerham’s FST (Weir and Cockerham 1984), using VCFtools, and deviation of SFS from neutrality, using SweeD (Pavlidis et al. 2013), for each 10-kb window. For FST calculations, we excluded SNPs with MAF <2.5% to adjust for the effect of rare alleles on FST values.
To reveal potential sweeps related to the origin of SLC, we conducted selective sweep analyses combining all three populations of SP and comparing the combined SPs with SLC ECU, the earliest diverging population of SLC. For the northward spread of SLC, we designed two separate tests, one comparing a combined group of SLC ECU, SLC PER, and SLC San Martin (SLC ECU-PER-SM) with SLC MEX-CA-NSA and one comparing the same group with SLC MEX, to reveal potentially unique sweeps in each of the two populations. Also, to test for the possibility of unique sweeps in SLL, we compared SLC MEX with SLL.
We created lists of windows with top 2% values for each statistic and selected the windows shared by at least two of the three lists for defining sweeps regions.
GO Term Enrichment
GO term enrichment analyses were conducted using topGO (v.2.28.0) (Alexa et al. 2006) in R. Several algorithms were tested for annotations, but the results from “weight01” algorithm were chosen to explore further because of the minimum number of repetitive annotations. Significance was measured using Fisher’s exact test. As described in the topGO manual, the “weight01” algorithm accounts for the GO term relationships, thus its significance tests are not independent from one another and the resulting P values need not to be adjusted for multiple testing.
Acknowledgments
We thank Joaquin Cañizares, Jose Blanca, Peio Ziarsolo, María José Diez, and Javier Montero-Pau from the Polytechnic University of Valencia in Spain for providing access to germplasm and mapping of sequence data. We appreciate the feedback from Zhangjun Fei, Boyce Thomson Institute, USA, as well as feedback from two anonymous reviewers during the manuscript preparation and revision. We also thank Tilman Wolf, Department of Electrical and Computer Engineering, University of Massachusetts Amherst, USA, for providing computational resources for the population genomic analyses conducted herein. We thank the Institute for Applied Life Sciences, University of Massachusetts Amherst for access to core facilities. This study was funded by the National Science Foundation of USA, grant number: IOS 1564366.
References
Casas A, Blancas J, Lira R. 2016. Mexican ethnobotany: interactions of people and plants in Mesoamerica. In: Lira R, Casas A, Blancas J, editors. Ethnobotany of Mexico. New York: Springer. p. 1–19.
CoNekT.
Gaut BS. 1998. Molecular clocks and nucleotide substitution rates in higher plants. In: Hecht MK, Macintyre RJ, Clegg MT, editors. Evolutionary biology. New York: Springer. p. 93–120.
Moyers BT, Morrell PL, McKay JK. 2017. Genetic Costs of Domestication and Improvement. J. Hered. 109:103–116.
