


Abstract
The origin of domesticated Asian rice (Oryza sativa) has been a contentious topic, with conflicting evidence for either single or multiple domestication of this key crop species. We examined the evolutionary history of domesticated rice by analyzing de novo assembled genomes from domesticated rice and its wild progenitors. Our results indicate multiple origins, where each domesticated rice subpopulation (japonica, indica, and aus) arose separately from progenitor O. rufipogon and/or O. nivara. Coalescence-based modeling of demographic parameters estimate that the first domesticated rice population to split off from O. rufipogon was O. sativa ssp. japonica, occurring at ∼13.1–24.1 ka, which is an order of magnitude older then the earliest archeological date of domestication. This date is consistent, however, with the expansion of O. rufipogon populations after the Last Glacial Maximum ∼18 ka and archeological evidence for early wild rice management in China. We also show that there is significant gene flow from japonica to both indica (∼17%) and aus (∼15%), which led to the transfer of domestication alleles from early-domesticated japonica to proto-indica and proto-aus populations. Our results provide support for a model in which different rice subspecies had separate origins, but that de novo domestication occurred only once, in O. sativa ssp. japonica, and introgressive hybridization from early japonica to proto-indica and proto-aus led to domesticated indica and aus rice.
Introduction
The Asian rice Oryza sativa is the world’s most important food crop, and is a staple for more than one-third of the world’s population (Gnanamanickam 2009). Oryzasativa is genetically differentiated into several groups, the main ones being japonica and indica, which have been considered as subspecies/subpopulations with distinct morphological and physiological characteristics (Matsuo et al. 1997). While these two represent the major groups, large-scale studies indicate that O. sativa is better described as comprising five major subpopulations (Garris et al. 2005): aus, indica, temperate japonica, tropical japonica, and aromatic rice. Temperate and tropical japonica are closely related and group with aromatic rice, while indica and aus show closer genetic affinities (Garris et al. 2005). There is incipient intraspecific reproductive isolation within O. sativa, at least between japonica and indica (Chen et al. 2008), and these two are sometimes considered subspecies. Oryzarufipogon is commonly accepted as the wild progenitor of O. sativa (Khush 1997), although O. nivara, often considered as the annual form of O. rufipogon, has also been proposed as the ancestor (Yamanaka et al. 2003).
The evolutionary origins of the domesticated Asian rice have been enigmatic. Proponents have advocated either single or multiple origins of O. sativa, and different lines of genetic evidence support conflicting hypotheses on the origin of this domesticated species (Sang and Ge 2007; Gross and Zhao 2014). The single-origin hypothesis suggests O. sativa was domesticated once and differentiated into various subpopulations (Vaughan et al. 2008). Genes controlling critical domestication traits, such as seed shattering (Li et al. 2006) and pericarp color (Sweeney et al. 2006), for example, indicate that domesticated alleles are shared between indica and japonica (Sang and Ge 2007; Sweeney et al. 2007; Zhang et al. 2009; Huang et al. 2012a). Moreover, demographic modeling using polymorphism data provide support for a single domestication (Molina et al. 2011).
The two-origin hypothesis, on the other hand, posits that japonica and indica have independent origins from distinct O. rufipogon subpopulations (Oka 1988). This would explain the deep genetic differentiation between japonica and indica, where divergence times between these subspecies are much earlier (Ma and Bennetzen 2004; Zhu and Ge 2005) than the earliest archeological evidence of domesticated rice ∼8–9 thousand years ago [ka] (Fuller et al. 2010). In addition, genome-wide data shows japonica and indica clustering with different O. rufipogon accessions and not with each other (Second 1982; Cheng et al. 2003; Londo et al. 2006; Huang et al. 2012a; Yang et al. 2012). A recent study (Civáň et al. 2015) even suggests a multiple-origin model hypothesizing japonica, indica, and aus having three separate origins with independent domestications [but see Huang and Han (2015)].
How can one resolve these conflicting lines of evidence that point to disparate evolutionary models for the origin of rice? To address this question, we conducted phylogenomic analyses and demographic modeling using high-quality whole genome sequence data from various subspecies of O. sativa and its wild progenitors O. rufipogon and O. nivara. Whole genome sequences allow for population genomic inference even from a single representative of each species/subspecies, since unlinked genomic regions have independent coalescent histories; therefore, genome-wide analysis of single genomes can provide species-wide population genetic information (Gronau et al. 2011).
We show that rice subspecies japonica and indica, as well as aus, are derived from genetically distinct lineages of O. rufipogon and/or O. nivara, originating prior to rice domestication. We also show significant gene flow from japonica to indica and aus lineages, consistent with previous studies that show the transfer of domestication alleles into indica from japonica (Huang et al. 2012a). Our results suggest that modern Asian rice subspecies or subpopulations originated from multiple and distinct wild rice populations. However, de novo domestication occurred only once, in japonica, and the domestication of indica and aus arose from gene flow from this early japonica domestication that introduced domestication alleles into a proto-indica population.
Results
We generated a multi-genome alignment of Asian rice (japonica, indica, and aus), the wild progenitors (O. rufipogon and O. nivara), and an outgroup species (O. punctata); the japonica genome was used as a reference. For most pairwise genome alignments, an average 74% of a genomes’ sequence aligned with japonica (see supplementary table S1, Supplementary Material online). Oryzapunctata, however, had 37% of its sequence aligned to the japonica genome. We focused our analysis on orthologous regions from the six key species/subspecies (japonica, aus, indica, O. rufipogon, O. nivara, and O. punctata). For demography analysis, we excluded O. punctata due to its evolutionary divergence. For gene topology analysis, ∼19,000 genes were analyzed depending on the cultivar genome that was being compared (see supplementary table S2, Supplementary Material online). For demographic modeling, there were 1,183 regions with sizes of 1-kb that matched our neutral criteria.
Estimating the Species Tree
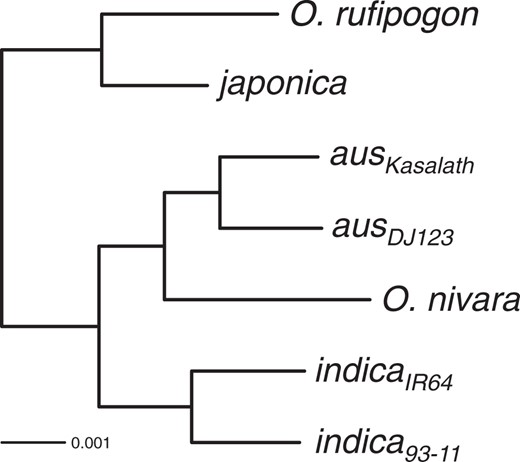
Species phylogeny for the Asian rice complex. Oryza punctata genome was used for rooting the tree but omitted from figure due to its evolutionary distance. Scale bar length represents number of substitutions per site. All nodes had 100% bootstrap support and were thus omitted from labeling. The phylogenetic tree had a log-likelihood (lnL) of –8,171,522.67.
These results are concordant with the major population relationships determined using genome-wide polymorphism datasets (Garris et al. 2005; McNally et al. 2009; Xu et al. 2011). Interestingly, analysis of aus, indica, and O. nivara indicated that O. nivara was more closely related to aus than to indica. This suggested that aus evolved from O. nivara, while indica originated earlier from either O. nivara, or a separate, genetically distinct O. rufipogon or O. nivara population. It is also possible that aus and indica have a common origin but aus was extensively backcrossed to an ancestral O. nivara. It should be noted that while the wild rice genome sequences used in this study are representative of each of the wild rice species, they might not necessarily represent the direct wild progenitor populations for domesticated rice. Nevertheless, our proposed species topology for the Asian rice complex suggests all three domesticated rice originated from two or three independent populations.
Inference of Admixture and Incomplete Lineage Sorting
Although the genome-wide species phylogeny supported a single topology (fig. 1), rarely will the entire genome reflect a single topology, as incomplete lineage sorting and gene flow can distort the underlying species tree (Degnan and Rosenberg 2009). To examine the degree of admixture and incomplete lineage sorting, we looked at each gene topology and compared it to the species tree. Proportion of genes that support the minor topologies can estimate the proportion of admixture and incomplete lineage sorting across the genomes (Pollard et al. 2006; see Materials and Method for brief discussion).
Approximately, unbiased (AU) tests (Shimodaira 2002) were conducted for each gene to test for significant support of either the species tree (major topology) or the two minor tree topologies. Results are shown for tests involving japonica, indicaIR64, ausDJ123, O. nivara, and O. rufipogon (table 1) but results from the full combination of comparisons are listed in the supplementary table S3, Supplementary Material online.
Four-Taxon Topology Test.
| Major Topology | Minor Topologies | |
|---|---|---|
| Topologies Testing the Origin Of Domesticated Rice | ||
| ([japonica,O. rufipogon],O. nivara) 5409 (85.1% [84.3–86.0%]) | ([japonica,O. nivara],O. rufipogon) 497 (7.8% [7.2–8.5%]) | ([O. nivara,O. rufipogon],japonica) 446 (7.0% [6.4–7.7%]) |
| ([aus,O. nivara],O. rufipogon) 2214 (65.0% [63.4–66.6%]) | ([aus,O. rufipogon],O. nivara) 975(28.6% [27.1–30.1%]) | ([O. nivara,O. rufipogon],aus) 215 (6.3% [5.5–7.1%]) |
| ([indica,O. nivara],O. rufipogon) 2499 (56.9% [55.5–58.4%]) | ([indica,O. rufipogon],O. nivara) 1447 (33.0% [31.6–34.3%]) | ([O. nivara,O. rufipogon],indica) 444 (10.1% [9.2–11.0%]) |
| Topology Testing the Relationship Between aus and indica | ||
| ([aus,O. nivara],indica) 2854 (58.8% [57.4–60.3%]) | ([aus,indica],O. nivara) 1113 (22.9% [21.7–24.1%]) | ([indica,O. nivara],aus) 883 (18.2% [17.1–19.3%]) |
| Topologies Testing the Relationship Between aus and japonica | ||
| ([japonica,O. rufipogon],aus) 4887 (77.4% [76.4–78.4%]) | ([japonica,aus],O. rufipogon) 972 (15.4% [14.5–16.3%]) | ([aus,O. rufipogon],japonica) 451 (7.1% [6.5–7.8%]) |
| ([aus,O. nivara],japonica) 3062 (67.1% [65.8–68.5%]) | ([japonica,aus],O. nivara) 965 (21.1% [20.0–22.4%]) | ([japonica,O. nivara],aus)535 (11.7% [10.8–12.7%]) |
| Topologies Testing the Relationship Between indica and japonica | ||
| ([japonica,O. rufipogon],indica) 4932 (77.9% [76.9–79.0%]) | ([japonica,indica],O. rufipogon) 947 (15.0% [14.1–15.8%]) | ([indica,O. rufipogon],japonica) 450 (7.1% [6.5–7.8%]) |
| ([indica,O. nivara],japonica) 2562 (59.9% [58.4–61.3%]) | ([japonica,indica],O. nivara) 1025 (23.9% [22.7–25.2%]) | ([japonica,O. nivara],indica) 693 (16.2% [15.1–17.3%]) |
Note.—Total number of gene trees significantly supporting a topology after the Approximately Unbiased (AU) test. Numbers in parenthesis represent percentage with 95% bootstrap confidence interval indicated in square brackets. Oryza punctata was used as outgroup for all topology tests.
Comparing O. nivara and O. rufipogon to a domesticated rice sample, most of the genes significant after the AU test supported a major topology that was concordant with the genome-wide species phylogeny (fig. 1). Specifically, more then 80% of the genes supported the topology grouping japonica with O. rufipogon while more then 55% of the genes supported the topology grouping O. nivara with either aus/indica. For aus and indica, however, the bootstrap confidence interval for the two minor topologies (minor topology 1 = ([aus/indica, O. rufipogon], O. nivara) vs. minor topology 2 = ([O. rufipogon, O. nivara], aus/indica)) did not overlap with each other. The topology grouping aus or indica with O. rufipogon had support from significantly greater number of genes (aus had 28.6% [27.1–30.1%] of genes supporting minor topology 1 vs. 6.3% [5.5–7.1%] of genes supporting minor topology 2; and indica had 33.0% [31.6–34.3%] of genes supporting minor topology 1 vs. 10.1% [9.2–11.0%] of genes supporting minor topology 2). Although this suggested potential gene flow between aus/indica with O. rufipogon it is more likely due to indirect evolutionary effects from japonica and O. rufipogon sharing a common ancestor, and the strong japonica originating gene flow (see below, ABBA-BABA test, and G-PhoCS results).
Gene topologies involving indica, aus, and O. nivara were consistent with our species topology, where 58.8% of the genes with significant AU test supported monophyly between aus and O. nivara. Between the two minor topologies, however, a significantly higher number of genes supported the topology grouping aus and indica together (22.9% [21.7–24.1%] of genes supported ([aus, indica], O. nivara) topology vs. 18.2% [17.1–19.3%] of genes supported ([indica, O. nivara], aus) topology), suggesting potential gene flow between aus and indica.
Topology tests comparing japonica and aus/indica with a wild rice were then conducted to test possible introgressions involving japonica. Consistent with previous results, more then 60% of the genes supported a major topology that was concordant with the species phylogeny. However, for all comparisons the two minor topologies were not represented by an equal number of genes. Specifically, the topology that grouped aus/indica with japonica had significantly greater number of gene support. These results suggested significant gene flow between domesticated japonica and aus/indica.
We then conducted the ABBA-BABA test (Green et al. 2010; Durand et al. 2011; see Materials and Method for brief discussion of method) to differentiate admixture between populations from incomplete lineage sorting. ABBA-BABA tests with Z-scores greater than are shown in table 2 (see supplementary table S4, Supplementary Material online, for full results). Consistent with the gene topology results, there was significant evidence of gene flow between japonica and either indica or aus. Also concordant with the topology test results, O. rufipogon was the only wild progenitor to show significant evidence of gene flow to both aus cultivars and indica93–11. However, we note this may be an artifact arising from japonica and O. rufipogon sharing a common ancestor, and the strong signal of gene flow associated with japonica. In contrast to the topology test results, no admixture was detected among aus, indica, and O. nivara.
Significant ABBA-BABA Test for Four Populations (P1, P2, P3, O).
| P1 | P2 | P3 | aABBA sites | aBABA sites | D (±SE) | bZ-score |
|---|---|---|---|---|---|---|
| Gene Flow with japonica | ||||||
| O. nivara | ausDJ123 | japonica | 65702 | 27461 | 0.41 ± 0.07 | 6.15 |
| O. nivara | ausKasalath | japonica | 60243 | 24190 | 0.43 ± 0.05 | 8.28 |
| O. nivara | indicaIR64 | japonica | 71212 | 36520 | 0.32 ± 0.05 | 5.86 |
| O. nivara | indica93-11 | japonica | 79451 | 32779 | 0.42 ± 0.05 | 9.14 |
| Gene Flow with indica | ||||||
| O. rufipogon | japonica | indicaIR64 | 55955 | 31426 | 0.28 ± 0.05 | 5.80 |
| O. rufipogon | japonica | indica93-11 | 58892 | 30055 | 0.32 ± 0.04 | 7.66 |
| Gene Flow with aus | ||||||
| O. rufipogon | japonica | ausKasalath | 52744 | 29107 | 0.29 ± 0.05 | 6.38 |
| O. rufipogon | japonica | ausDJ123 | 55873 | 31422 | 0.28 ± 0.05 | 5.43 |
| Gene Flow with O. rufipogon | ||||||
| O. nivara | ausDJ123 | O. rufipogon | 54327 | 32606 | 0.25 ± 0.05 | 4.71 |
| O. nivara | ausKasalath | O. rufipogon | 50974 | 29685 | 0.26 ± 0.06 | 4.52 |
| O. nivara | indica93-11 | O. rufipogon | 65547 | 39474 | 0.25 ± 0.05 | 5.00 |
Note.—The ABBA-BABA test examines possible admixture between P3 lineage and P1 or P2 lineage. The O. punctata genome was used as the outgroup genome (O).
Number of sites with allele conformations ABBA or BABA for 4 populations in order of P1, P2, P3, and O.
Z-score higher then 3.9 (P < 0.0001) are shown.
The methods used so far were able to detect admixture between the domesticated rice genomes, but the direction of introgression could not be determined. To characterize the source and recipient genomes involved in the introgression a five-taxon based phylogenetic test called DFOIL (Pease and Hahn 2015; see Materials and Method for brief discussion of method) was conducted. An extension of the ABBA-BABA test, the DFOIL test analyzes a five-taxon phylogenetic tree with P1, P2, P3, P4, and O lineages (where P1 and P2 are monophyletic with each other; P3 and P4 are monophyletic with each other; and O represents the outgroup). Results from the DFOIL test indicated a complex history of admixture between japonica and aus/indica, where the signs (+, –, 0) from the four DFOIL statistics (table 3 and supplementary table S5, Supplementary Material online) were not compatible with any of the unidirectional gene flow scenarios (see supplementary table S6, Supplementary Material online). However, a recent study by Schumer et al. (2016) have shown that a pattern such as ( ++ −−) for the four DFOIL components can occur when there is bidirectional gene flow from two terminal lineages (specifically between P2 and P3; and in our case between japonica and aus/indica). Thus, the admixture history between the domesticated rice samples was most consistent with bidirectional gene flow between japonica and aus/indica genomes.
Signs for the DFOIL Test Components.
| aCompared Genomes (P1,P2,P3,P4) | bDFO | bDIL | bDFI | bDOL |
|---|---|---|---|---|
| O. nivara, ausDJ123, japonica, O. rufipogon | + | + | − | − |
| O. nivara, ausKasalath, japonica, O. rufipogon | + | + | − | − |
| O. nivara, indicaIR64, japonica, O. rufipogon | + | + | − | − |
| O. nivara, indica93-11, japonica, O. rufipogon | + | + | − | − |
Note.—The O. punctata genome was used as the outgroup genome (O).
Order of taxa (P1,P2,P3,P4) are arranged so that P1 and P2 are monophyletic and P3 and P4 are monophyletic.
Signs for the four DFOIL test components. D-statistic and chi-square value are listed in the supplementary table S6, Supplementary Material online.
The Demographic Model for Asian Rice
To model demographic parameters in domesticated and wild Asian rice, we used the Bayesian coalescence-based program G-PhoCS (Gronau et al. 2011). To model gene flow between populations, migration bands were fitted to allow bidirectional gene flow between two current populations. All 20 pairwise migration rate comparisons are shown in the supplementary figure S1, Supplementary Material online. Consistent with genome-wide topology and ABBA-BABA tests, significant evidence of gene flows were detected between japonica and indica/aus. Further, consistent with the DFOIL results all gene flow between japonica and indica/aus were bidirectional. High levels of gene flow were also detected between indica and aus; however, its 95% HPD overlapped with zero. There was also unexpected evidence of gene flow between O. nivara and japonica; this estimated migration rate was highest among all significant migration rates, but it also had a large 95% HPD interval.
Using these initial results, we analyzed a multi-migration model that included all significant gene flows. As evidence for gene flow between indica and aus were not significant, two migration models were examined–with and without the indica-aus migration band (see supplementary fig. S2, Supplementary Material online). Results showed that in both models, the O. nivara to japonica gene flow was no longer significant, while the 95% HPD for gene flow between indica and aus no longer overlapped with zero. Moreover, gene flows were all unidirectional–from japonica to indica, japonica to aus, and indica to aus. We note, however, G-PhoCS has increased power of detecting migration in cases where the direction of gene flow is from an old to young lineage (Gronau et al. 2011). In our multi-migration model, the direction of gene flow went from an older lineage (japonica or indica) donor to a younger lineage (aus and indica) recipient, whereas the gene flows in the opposite direction were no longer significant. As there were different numbers of gene flows detected by the unidirectional vs. bidirectional gene flow models, we also explored if there were any resulting differences in the estimated divergence times. Results indicated that the mis-incorporation of aus/indica to japonica gene flow was not likely to have significantly affected our divergence time estimates and our interpretation of the Asian rice domestication scenario (see supplementary text, Supplementary Material online).
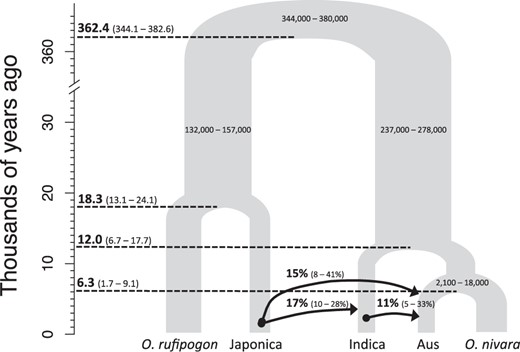
G-PhoCS estimated demographic model of the Asian rice complex. Each internal node has a median mutation rate calibrated divergence time (T) estimate (ka) with its 95% Highest Posterior Density (HPD) in parenthesis. Only the 95% HPD is shown for each ancestral effective population size (Ne). Arrows indicate the migration band and direction of gene flow. Arrows are labeled with median and 95% HPD for the total migration rate estimates.
G-PhoCS estimated current population sizes were inconsistent and had large 95% HPD (see supplementary fig. S3, Supplementary Material online), likely due to weak evolutionary signal in the data for recent demographic events, where G-PhoCS has limited power (Gronau et al. 2011). On the other hand, parameter estimates for the ancestral effective population sizes showed a series of bottlenecks that reduced Ne by ∼20- to ∼160-fold.
Total rates of gene flow were similar and moderate (median mtotal = 11% for indica to aus gene flow; median mtotal = 15% for japonica to aus gene flow; median mtotal = 17% for japonica to indica gene flow). This is likely an underestimate since neutral sequences were used for the G-PhoCS analysis, and significant introgression between domesticated rice subpopulations are expected to occur at non-neutral domestication genes (Gross and Zhao 2014). Thus, we considered gene flow as a parameter that allows deviations from the standard “lineage splitting and isolation model” while estimating divergence time (τ) along the species phylogeny (Gronau et al. 2011). Results showed mis-incorporation of gene flow led to a significant upward bias in estimated divergence times for the O. rufipogon/japonica split (τRJ) and downward bias in estimated divergence time for domesticated and wild rice population (τroot) (see supplementary fig. S4, Supplementary Material online).
Mutation rate estimates from a previous study on grass molecular evolution (Gaut et al. 1996) was used to calibrate the mutation rate scaled τ to absolute divergence time (T) in years. Our analysis indicated the wild and domesticated Asian rice lineages last shared a common ancestor at ∼362.4 thousand years ago (ka), comparable to the ∼400 ka estimated using molecular clock approaches (Cheng et al. 2003; Ma and Bennetzen 2004; Zhu and Ge 2005). Among the three domesticated rice populations, the absolute divergence time (i.e., mutation calibrated divergence time) of japonica lineage (TRJ) occurred earliest at 18.3 ka (with a 95% range of 13.1–24.1 ka). This overlapped with the 95% HPD of indica lineage divergence time (12.0 ka with a 95% range of 6.7–17.7 ka). On the other hand, TRJ was significantly earlier than the divergence time of aus and O. nivara (6.3 ka with a 95% range of 1.7–9.1 ka), indicating that aus is a more recently formed rice subpopulation.
Discussion
Hypotheses for multiple origins of Asian rice gain support primarily from phylogenetic analyses that indicate different rice subpopulations are more closely related to distinct O. rufipogon or O. nivara populations, rather than to each other (Garris et al. 2005; Zhu and Ge 2005; Londo et al. 2006; Xu et al. 2007; He et al. 2011; Xu et al. 2011; Huang et al. 2012a). Our genome-wide analysis does show phylogenetic tree topologies consistent with multiple origins for each domesticated rice population. Specifically, the majority shows japonica as more closely-related with O. rufipogon, and indica with O. nivara, concordant with previous studies (Zhu and Ge 2005; Londo et al. 2006; Xu et al. 2007; Xu et al. 2011).
Interestingly, we have evidence that aus may have separate origins from an O. nivara progenitor independent of indica. Previous studies of genome-wide polymorphism have clustered aus and indica together (Garris et al. 2005; McNally et al. 2009; Xu et al. 2011), however, none have specifically tested whether aus and indica have a single or separate origins. Our results suggest that japonica, indica, and aus have their origins in distinct ancestral populations, consistent with phylogeographic studies that show population structuring and geographic subdivision within O. rufipogon, with O. nivara as a separate group (Sun et al. 2002; Huang et al. 2012a; Huang et al. 2012b; Liu et al. 2015).
Archeological evidence suggests the domestication of rice occurred at the latest ∼6.5 ka (Fuller et al. 2009) or as early as ∼8.5 ka (Deng et al. 2015) in the Lower and/or Middle Yangtze River basin (Silva et al. 2015). Our estimated divergence time, on the other hand, for the split of japonica and O. rufipogon lineages (18.3 ka) is much earlier. This earlier divergence fits with paleoenvironmental and archeological evidence. Wild rice only appeared in the Yangtze Basin after the Last Glacial Maximum ∼18 ka, representing an expansion from tropical refugia in the south of China (Fuller et al. 2010). Archeologically recovered wild populations in and north of the Yangtze River, regarded as the most probable source of early domesticated rice (Silva et al. 2015), have since been extirpated by climate change and human impacts (Fuller et al. 2010; Fuller 2011a). Thus, the last common ancestor between extant O. rufipogon of southern China and domesticated japonica should date to the immediately post-glacial era, that is., ∼18 ka. Earliest evidence for human use of wild rice in the Yangtze basin similarly dates to this period (Fuller and Qin 2009; Fuller et al. 2010).
The indica/O. nivara divergence time (∼12.0 ka) similarly coincides with hypothesized geographic expansion of wild rice westwards in India during the terminal Pleistocene (Fuller et al. 2010), and the earliest evidence for rice use in this region. Rice phytoliths associated with vegetation burning suggest management for open habitats suitable for wild rice in the Ganges valley between ∼14.5 and 8 ka (Fuller and Qin 2009). Archeological evidence for reliance on rice in this area dates from ∼9 ka, and has been interpreted as early management of a proto-indica that, however, did not lead to selection for domestication traits (Fuller and Qin 2009; Fuller 2011a; Fuller 2011b). The importance of proto-indica in the evolution of domesticated rice is consistent with this transitional population still experiencing the pre-domestication cultivation phase of crop evolution (Allaby et al. 2008), when early agricultural societies have already begun planting O. nivara for food use, but prior to the evolution of domestication traits.
While there is strong genetic evidence for multiple population origins of O. sativa, there is also a history of introgressive hybridization during the evolution of this domesticated species. Specifically, we find clear introgression from japonica to both indica and aus in both the ABBA-BABA test, DFOIL test, and Bayesian modeling with G-PhoCS. In full coalescence-based demography modeling, we observe significant gene flow from japonica to indica (10–28%), and japonica to aus (8–41%). Parenthetically, we also see introgression from indica to aus (5–33%). As aus have received gene flow from both japonica and indica it is also possible for some of the japonica originating introgression may have indirectly been transferred by japonica to indica then to aus.
Interestingly, previous studies indicate that such introgression resulted in the transfer of domestication alleles from early japonica to the indica (and now possibly aus) lineages. Analysis of key domestication genes Bh4, sh4, OsC1, and PROG1 (Saitoh et al. 2004; Li et al. 2006; Jin et al. 2008; Tan et al. 2008; Zhu et al. 2011) shows monophyly among domesticated rice subpopulation for these loci. Moreover, genome-wide examination (Huang et al. 2012a) showed phylogenetic trees reconstructed from domestication-associated genomic regions clustered indica and japonica alleles together, again consistent with gene flow of domestication alleles from japonica.
These results validate an alternative model for the origin of domesticated rice that could resolve the various conflicting genetic patterns observed by numerous studies. Aspects of this model have been previously proposed (Molina et al. 2011; Huang et al. 2012a; Huang and Han 2015; Castillo et al. 2016), and our analysis provides more details about the timing and gene flow patterns underpinning this scenario. This model suggests that during the expansion of O. rufipogon/O. nivara across South and East Asia over the last ∼500,000 years, populations of wild rice began to diverge in different parts of the species range. The last major expansion of wild rice, including O. rufipogon in East Asia and O. nivara in western South Asia took place as glacial conditions retreated from ∼18 to ∼13.5 ka (Fuller et al. 2010). This maximal range extent of wild rice was in place in the Early Holocene (∼11.5 to ∼8 ka). Local hunter/gatherer communities and early cultivators began to manage local wild rice populations, possibly in the terminal Pleistocene and certainly in the Early Holocene in India and in China. Differing genetic histories of indica and japonica together with archeological evidence for early Holocene subsistence in the Yangtze Valley in China and Ganges Valley in India suggests different management strategies (Fuller and Qin 2009; Fuller 2011a), only one of which promoted domestication.
Domestication thus occurred first with japonica in the Yangtze Valley in China (Fuller et al. 2009; Fuller and Qin 2009; Deng et al. 2015), associated with fixation of alleles for non-shattering, color, and other domestication traits. Subsequent spread of domesticated O. sativa ssp. japonica to India led to hybridization with wild O. nivara or a cultivated proto-indica, resulting in the incorporation of domestication alleles from japonica that resulted in the origin of indica and intensification of rice agriculture and its expansion in South/Southeast Asia. Archeobotanically, there is no strong evidence for proto-indica having any domestication traits until the 2nd millennium BC, which is substantially later then the domestication time for japonica (Fuller et al. 2010; Fuller 2011a; Bates et al. 2016). We, therefore, have a case of multiple origins of the various Asian rice subspecies/subpopulations (in China and India) but only one original de novo domestication (in China).
This multiple origin/single domestication model is consistent with archeological evidence (Fuller and Qin 2009; Fuller 2011a; Fuller 2011b). Archeobotanical samples have suggested the existence of a possible proto-indica population genetically divergent from the progenitor of japonica (Fuller 2011b). Ancient DNA from rice >2 ka of age in India shows both O. nivara/indica and japonica chloroplast haplotypes, which indicates mixed populations are indeed ancient (Castillo et al. 2016). Proto-indica may have been cultivated in India without being domesticated for millennia until introduction of domestication alleles from japonica (Fuller and Qin 2009; Fuller et al. 2010; Fuller 2011b). Archeological finds of rice in northwest India dating 4–4.5 ka, for example, are morphologically wild, with <10% non-shattering spikelet bases (Bates et al. 2016). Modeling of archeological data suggests that japonica rice moved westward out of China and into South Asia via Central Asia along a precursor of the historical Silk Route (the so-called Hexi corridor) perhaps shortly after ∼4 ka (Stevens et al. 2016). Aus may have had a similar evolutionary trajectory with a proto-aus origin and millennia of pre-domestication cultivation, until it also received domestication alleles from japonica or indica.
Consistent with McNally et al. (2009), our evidence of gene flow was not strictly unidirectional (from japonica to aus/indica) as there were some evidence of gene flow from aus/indica to japonica as well. The introgression from aus/indica to japonica, however, may have occurred during the diversification phase of rice, as historical and archeological evidence suggests the contact between domesticated indica and japonica were more recent then the initial time of their domestication (Fuller et al. 2010). Here, estimating the dates of gene flow between domesticated rice from both genetic and archeological data would be an important area for future research. If consistent with our proposed domestication scenario, the gene flow originating from japonica would be older then gene flows originating either from aus or indica.
In the end, our analysis calls into question how we conceptualize our definition of domestication. Domestication is an evolutionary process that results in the genetic transformation of a wild species into one dependent on humans for reproduction and dispersal, as a consequence of its adaptive evolution to meet human needs. At the genetic level, however, domesticated species can be operationally defined as species that carry the suite of alleles that have been positively selected for human association, adaptation to cultivation environments, and to meet human needs. As humans translocated domesticated populations during species dispersal, these populations come into contact and hybridize with distinct regional wild populations, creating regional affinities in domesticated varieties. Such processes, dubbed introgressive capture, have been widely documented in domesticated animals (Larson and Fuller 2014), and there is now increasing evidence of a similar process operating in some crop plants (e.g., in apples, Cornille et al. 2014). The introgressive transfer of domestication alleles from japonica to other populations through gene flow is what led to the genetic merging of distinct populations into what we now consider one domesticated crop species, O. sativa (Molina et al. 2011; Huang et al. 2012a). Indeed, O. sativa may be considered a complex of between 2–5 genetically distinct and (to greater or lesser degrees) reproductively isolated subspecies, bound together as a single crop species by shared presence of domestication alleles. As we identify various domestication genes in O. sativa, we can precisely identify the entire suite of loci that were selected and which characterize this one crop species, and model the precise evolutionary sequence that gave rise to this crucial domesticated crop species.
Materials and Methods
Oryza Genomes Analyzed
For consistency in the analyzed dataset Oryza species that have de novo assembled genome sequences were only analyzed. These include genome sequences that were obtained from EnsemblPlants release 30 (ftp://ftp.ensemblgenomes.org/pub/plants/; last accessed January 14, 2017) for cv. Nipponbare (International Rice Genome Sequencing Project 2005), cv. 93–11 (indica93–11) (Yu et al. 2002), cv. Kasalath (ausKasalath) (Sakai et al. 2014), cv. IR64 (indicaIR64), and cv. DJ123 (ausDJ123) (Schatz et al. 2014). In addition, genome assembly from the International Oryza Map Alignment Project (Jacquemin et al. 2013) were obtained and includes genome assemblies for O. nivara, O. rufipogon, O. punctata, O. glaberrima, O. barthii, O. brachyantha, O. longistaminata, O. glumaepatula, and O. meridionalis.
Whole Genome Alignment of Oryza Genomes
Repetitive regions were identified and masked using Repeatmodeler ver. 1.0.8 (http://www.repeatmasker.org/RepeatModeler.html; last accessed January 14, 2017) and Repeatmasker ver. 4.0.5 (http://www.repeatmasker.org/RMDownload.html; last accessed January 14, 2017). The japonica genome was used as reference and other genomes were aligned using LASTZ ver 1.03.73 (Harris 2007; http://www.bx.psu.edu/∼rsharris/lastz/; last accessed January 14, 2017). Alignment blocks less then 100 kb apart were then chained together (Kent et al. 2003) using the UCSC Kent utilities suite (http://hgdownload.cse.ucsc.edu/admin/exe/linux.x86_64.v287/; last accessed January 14, 2017). To avoid evolutionary differences arising between ortholog and paralogs (Koonin 2005), a single chain with the highest score was selected to represent each orthologous region of the reference genome. To generate a multi-genome alignment, the aligner MULTIZ (Blanchette et al. 2004) was used to combine the target non-reference genome alignments.
Estimating the Species Phylogeny
Genome annotations for the japonica genome were downloaded from EnsemblPlants release 30. Four-fold degenerate (4D) sites were extracted for each gene using the msa_view program from the phast package ver. 1.3 (Hubisz et al. 2011; http://compgen.cshl.edu/phast/; last accessed January 14, 2017). All 4D sites were then concatenated into a single supergene alignment which was then used by RAxML ver. 8.2.5 (Stamatakis 2014) to estimate the maximum-likelihood based phylogenetic tree. We assumed a general time reversible model of DNA substitution with gamma distributed rate variation. Confidence of the phylogeny was determined after 1,000 bootstrap replicates.
Testing Gene Tree Topologies
Using the japonica genome annotation, genes with overlapping genome coordinates were excluded from analysis. The program msa_split from the phast package was used to parse out japonica CDS and its orthologous sequences from the multi-genome alignment. To control artifacts arising from missing data and alignment gaps, we omitted a gene if the proportion of missing sequence and gaps exceeded 20%.
RAxML estimated site-likelihood values were calculated for each non-overlapping japonica gene and its orthologs from aus, indica, O. rufipogon, and O. nivara. Significance of the phylogenetic relationships were determined using the Approximately Unbiased (AU) test (Shimodaira 2002) using the program CONSEL ver 0.20 (Shimodaira and Hasegawa 2001). AU test results for genes with likelihood difference of zero between topologies were excluded. For each gene, the topology with AU test P value greater then 0.95 was selected as the best representative topology (Schumer et al. 2016).
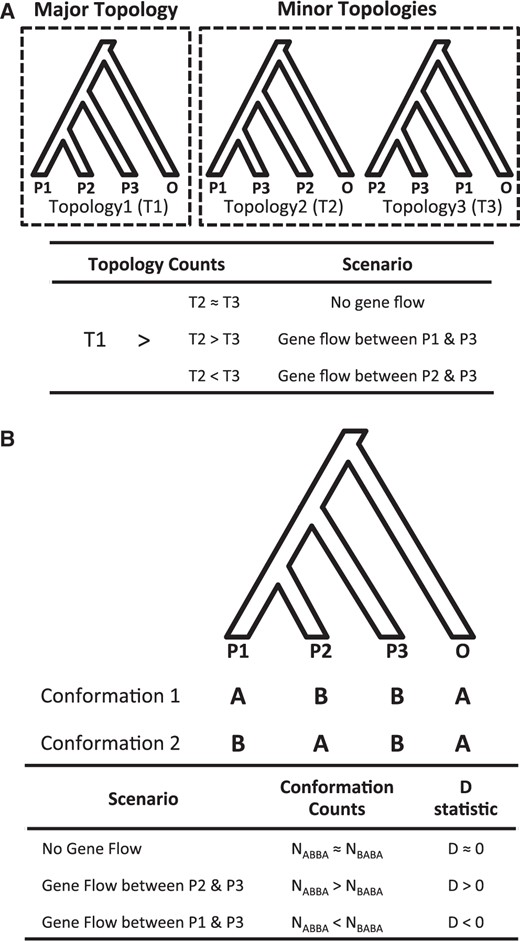
Phylogenomic methods for examining species relationship and admixture. The methods involve a rooted four-taxon phylogeny, specifically with three species (P1, P2, and P3) and an outgroup (O). P1 and P2 are most closely related to each other while P3 is an in-group taxon that is equally distant to both P1 and P2. (A) Gene tree topology test. T1, T2, and T3 represent total number of genes supporting Topology 1, 2, and 3, respectively. In this hypothetical example, Topology 1 is assumed to be the major topology. (B) ABBA-BABA test. NABBA and NBABA represent total number of sites with the “ABBA” and “BABA” conformation, respectively.
ABBA-BABA and DFOIL Test for Detecting Evidence of Admixture
To detect evidence of admixture between and within the domesticated and wild rice ABBA-BABA test were conducted (Green et al. 2010; Durand et al. 2011). Similar to the topology test, the ABBA-BABA test also involves the same four-taxon phylogeny while examining sites with biallelic conformations (fig. 3B; where “A” corresponds to the ancestral allele and “B” corresponds to the derived allele state). Specifically, the test is restricted to sites where the outgroup has an “A” allele and the P3 taxon has a “B” allele, while the two most closely related taxa P1 and P2 differ in its allele state. Hence, with a taxa ordered as {P1,P2,P3,O} the possible allele conformations for each biallelic sites are “ABBA” and “BABA.” Sites with ABBA or BABA conformation are then counted to determine whether there has been admixture between P1 and P3 or P2 and P3 taxa. As incomplete lineage sorting leads to an almost equal number of biallelic sites with the ABBA or BABA conformation, gene flow between P2 and P3 or P1 and P3 is expected to generate an excess of ABBA or BABA sites, respectively. Using the ABBA and BABA site counts a D-statistic (Green et al. 2010; Durand et al. 2011) can then be calculated where a positive D value indicates an excess of ABBA sites while a negative D value indicates an excess of BABA sites.
The O. punctata reference genome was used as the outgroup population (O) for all ABBA-BABA tests. Standard errors for the D-statistic were determined using jackknife resampling method by dividing the genome into 1 Mb blocks. Significance of D-statistic was determined using a Z-test and ABBA-BABA test with Z-score greater then were considered significant. We note that this does not correct for multiple hypothesis testing, however, our cutoff (P < 0.0001) is higher than previous studies that have used this method (Green et al. 2010; Freedman et al. 2014; Li et al. 2016).
Although the ABBA-BABA test detects evidence of admixture it is not able to determine the direction of the introgression. To determine the direction of introgression the DFOIL test (Pease and Hahn 2015) was conducted. This method is an extension of the four-taxon ABBA-BABA test by analyzing biallelic sites from a five-taxon phylogeny. Specifically, the test requires that the underlying species phylogeny for the five-taxon consists of two pairs of sister species in a symmetrical conformation: (((P1,P2),(P3,P4,)),O) (see supplementary fig. S6, Supplementary Material online). The ABBA-BABA test D-statistic essentially measures the relatedness between two sister species and a third ingroup species from a four-taxon phylogeny. With a four-taxon there is only one possible D-statistic but in a five-taxon with a symmetrical conformation there are four possible D-statistic values (referred as DFO, DIL, DFI, and DOL by Pease and Hahn [2015]; see supplementary fig. S6, Supplementary Material online). Unidirectional introgression involving a species from one monophyletic group to another (i.e., P1→P3) would lead to a paraphyletic relationship, clustering the recipient species with the donor group: that is, ((((P1,P2),P3),P4),O). Here, the recipient species not only clusters with the donor species, but also with the donors’ sister species leading to distinct signs (+, –, or 0) for the four D-statistics. Thus, the combination of signs from each four D-statistic holds information on the direction of introgression (see supplementary table S6, Supplementary Material online).
Each DFOIL statistic was calculated using the dfoil script (https://github.com/jbpease/dfoil; last accessed January 14, 2017) and significance for each D-statistic was assessed using a chi-squared goodness-of-fit test with 1 degrees of freedom (Pease and Hahn 2015). Similar to the ABBA-BABA test cutoff, we chose DFOIL test with chi-squared values greater than 15.14 (P < 0.0001) as significant.
Estimating Demographic Parameters
The software Generalized Phylogenetic Coalescent Sampler (G-PhoCS) ver 1.2.3 was used to estimate the demography parameters ancestral population sizes, divergence times, and migration rates using loci close to neutrality (Gronau et al. 2011). Each locus length was chosen as 1 kb while between loci at least 50 kb apart. Sites without insertions/deletions were only counted towards the final size of a locus.
Neutral loci were selected in a similar manner to Gronau et al. (2011). Three non-neutral regions were of interest: i) genic regions, ii) repetitive regions, and iii) conserved noncoding sequences (CNSs): Using the japonica genome as the reference, site-wise phastcons scores (Siepel et al. 2005) were calculated using 4-fold degenerate site as the neutral model. Sites with phastcons scores greater than 0.8 were considered candidate CNSs. Any CNSs separated by 10 bps were merged and 100 bps flanking each CNS were considered to be functional.
For every demography scenario, we ran G-PhoCS five times to ensure convergence. Each MCMC run had 3,000,000 iterations and 10–25% of the iterations were discarded burn-in runs. Priors were modeled using a gamma distribution (α = 1 and β = 10,000 for population size and divergence time; α = 0.002 and β = 0.00001 for migration rates). To estimate gene flow, we took an approach similar to Freedman et al. (2014). Initially, migration bands were fitted between two terminal branch lineages where gene flow was hypothesized to occur in both directions. Then we ran a model incorporating all significant migration bands and estimated population sizes and divergence times. Outputs were analyzed with program Tracer ver 1.6 (http://tree.bio.ed.ac.uk/software/tracer/; last accessed January 14, 2017) to determine the burn-in cutoff and 95% HPD for each parameter.
Estimated parameters are scaled by the mutation rate (μ) (population size where Ne is effective population size; divergence time where T is absolute divergence time in years and g is average generation time in years). To estimate calibrated population size (Ne) and divergence time (T), μ was estimated at mutations per site per generation (= year) from grass data (Gaut et al. 1996). Migration rate (m) is also scaled by μ and estimates the proportion of individuals in the target population that have origins in the source population. To estimate migration independent of μ, total migration rate (mtotal) was calculated by scaling against the total time of the migration event (). Here, mtotal represents the probability a target population received gene flow from the source population.
Supplementary Material
Supplementary data are available at Molecular Biology and Evolution online.
Acknowledgments
We would like to thank Bin Han and Nori Kurata for providing early access to the O. rufipogon genome assembly used in this study. We thank New York University - High Performance Computing for providing computational resources and support. This work was funded in part by grants from the National Science Foundation Plant Genome Research Program (IOS-1126971 and IOS-1546218), the Zegar Family Foundation (A16-0051) and the NYU Abu Dhabi Research Institute (G1205) to M.D.P., and from the UK Natural Environment Research Council (NERC) to D.Q.F. (NE/N010957/1).
References
Author notes
Associate editor: Yuseob Kim
