


Abstract
British history contains several periods of major cultural change. It remains controversial as to how much these periods coincided with substantial immigration from continental Europe, even for those that occurred most recently. In this study, we examine genetic data for evidence of male immigration at particular times into Central England and North Wales. To do this, we used 12 biallelic polymorphisms and six microsatellite markers to define high-resolution Y chromosome haplotypes in a sample of 313 males from seven towns located along an east-west transect from East Anglia to North Wales. The Central English towns were genetically very similar, whereas the two North Welsh towns differed significantly both from each other and from the Central English towns. When we compared our data with an additional 177 samples collected in Friesland and Norway, we found that the Central English and Frisian samples were statistically indistinguishable. Using novel population genetic models that incorporate both mass migration and continuous gene flow, we conclude that these striking patterns are best explained by a substantial migration of Anglo-Saxon Y chromosomes into Central England (contributing 50%–100% to the gene pool at that time) but not into North Wales.
Introduction
Following depopulation during the last glacial maximum and subsequent resettlement by hunter-gatherers ca. 7000 b.c., the history of Britain has been marked by a series of cultural transitions. These include the appearance of sedentary agricultural communities (the Neolithic transition) (ca. 4000 b.c.), the arrival and spread of Late Bronze-Iron Age and Celtic material culture (ca. 1000–100 b.c.), Roman occupation and influence (a.d. 43–410), the rise of Anglo-Saxon language and culture (ca. a.d. 400–800), Viking invasions and influence (ca. . 800–1000), and the Norman Conquest (a.d. 1066) (Kearney 1989 ; Hunter and Ralson 1998 ; Davies 1999 ).
The use of migration as an explanation for cultural transitions has varied greatly over the past 100 years and remains controversial (Clark 1966 ; Chapman 1997 ; Burmeister 2000 ; Shennan 2000 ). Before the 1960s, archaeological evidence for cultural change (such as changes in pottery type) was often interpreted as prima facie evidence for substantial immigration. The processual school or New Archaeology that emerged in the 1960s and 1970s rejected this view, arguing firstly that the adoption of new cultures could occur through trade or by the influx of a small ruling elite with minimal or no impact on the gene pool (the “elite dominance” model of Renfrew [1987] ) and secondly that if no positive evidence for migration could be found then explanations based on non–migrational internal forces were more parsimonious and therefore preferable (Adams 1968 ; Adams, Van Gerven, and Levy 1978 ). More recently, this antimigrationist stance has been questioned (Anthony 1990 ; Härke 1998 ) and migrational models reconsidered (e.g., Chapman and Hamerow 1997 ; Burmeister 2000 ).
These changes in archaeological opinion have had a particular impact on interpretations of cultural transitions in Britain (Clark 1966 ). Because of its geographical location on the northwestern edge of Europe, migrations and invasions from the continental mainland were once considered to be the obvious explanation for cultural transition (e.g., Hawkes and Hawkes 1942 ). Today, cultural changes before the Roman invasion, which are for the most part lacking in historical records, are no longer interpreted as automatically implying migration, and for these changes the role of migration remains unresolved. For cultural transitions after the Roman invasion, historical records argue against large migrations coinciding with either Roman occupation or the Norman Conquest, and the prevailing view is therefore that these later events represent examples of elite dominance (Kearney 1989 ; Davies 1999 ). Historical and archaeological research argue for some degree of Viking settlement in both East Anglia and the Midlands in the 9th century a.d. but against a substantial displacement of the existing people during this period (Richards 2000) .
Today, the most hotly debated of all the British cultural transitions is the role of migration in the relatively sudden and drastic change from Romano-Britain to Anglo-Saxon Britain (Hamerow 1997 ; Burmeister 2000 ). This transition was once widely accepted as providing clear evidence for a mass migration from continental Europe and the near-complete replacement of the indigenous population in England (Leeds 1954 ; Myres 1986 ). Stories of migration are included in the writings of Gildas (ca. a.d. 540) and Bede (a.d. 731) and hinted at in Anglo-Saxon sagas, such as Beowulf (Davies 1999 ). Archaeological evidence confirmed a rapid rise of continental culture in England (Esmonde-Cleary 1993 ) and suggested a contemporaneous desertion of continental Germanic settlements. More recently, however, authors have questioned the evidence for large-scale immigration (Crawford 1997 ; Hamerow 1997 ) and continental emigration (Näsman 1988 ; Petersen 1991 ) and emphasized the continuity of the Romano-British population in England. The sudden change to an Anglo-Saxon culture has been attributed instead to rapid acculturation and indigenous developments, with only a small number of Germanic immigrants (perhaps a male military elite) settling in Britain (Arnold 1984 ; Hodges 1989 ; Higham 1992 ). The contribution of Anglo-Saxon immigration to the modern English gene pool thus remains uncertain.
Genetic data comprise an obvious source of information to help resolve these issues. Previous studies examining biological variation in Britain have identified various patterns of genetic variation. These include studies on blood groups (Bodmer 1993 ; Mascie-Taylor and Lasker 1996 ), serum proteins and isoenzymes (Cartwright, Hargreaves, and Sunderland 1977 ; Mastana et al. 1993 ), HLA genes (Papiha, Duggan Keen, and Rodger 1985 ; Bodmer 1993 ), and multiple classical genetic markers (Falsetti and Sokol 1993 ; Cavalli-Sforza, Menozzi, and Piazza 1994 ; Mastana and Sokol 1998 ), as well as on patterns of disease incidence, such as phenylketonuria (Tyfield, Osborn, and Holton 1997 ), multiple sclerosis (Poser 1994 ), skin cancer (Long, Darke, and Marks 1998 ), and haemochromatosis (Merryweather-Clarke et al. 1997 ). These data have been interpreted as reflecting historical migrations and settlement patterns, but formal testing of alternative migratory models has not been attempted.
The non–recombining portion of the Y chromosome and the mitochondrial genome are useful sources of data because they provide exceptionally detailed high-resolution haplotypes, allowing fine definition of the underlying gene genealogies. The Y chromosome, which is much larger, is particularly useful because it has many slowly mutating biallelic markers to help resolve genealogical clades as well as rapidly mutating microsatellite markers to aid in the dating of very recent events (Thomas et al. 1998 ; Kayser et al. 2001 ). The extra information provided by these high-resolution haplotypes facilitates the fitting of population genetic models. Although the resulting demographic inferences are based on only a single locus, increasing the effects of evolutionary variance derived from chance differences in the genealogy, such systems are still useful because they are the only ones that allow sex-specific demographic inferences to be made.
Previous studies of mtDNA and Y chromosome variation across Europe have reported evidence of Paleolithic and Neolithic expansions reflected in large-scale clines (Torroni et al. 1998 ; Casalotti et al. 1999 ; Hill, Jobling, and Bradley 2000 ; Malaspina et al. 2000 ; Richards et al. 2000 ; Rosser et al. 2000 ; Semino et al. 2000 ; Simoni et al. 2000 ), but these studies did not consider the effects of historical migrations on more local patterns of genetic variation. Helgason et al. (2000) examined Y chromosome and mtDNA variation in the modern Icelandic population to assess the relative proportions of Scandinavian and Celtic ancestry stemming from historical migrations, whereas Wilson et al. (2001) compared Y chromosome, X chromosome, and mtDNA variation in eight population samples (including the Llangefni, Norway, and Friesland samples reported here) to investigate genetic changes associated with cultural transitions in North Wales and Orkney, two areas at the fringes of the British Isles. Through a comparison of signature haplotypes, Wilson et al. (2001) found evidence for Celtic male ancestry in the North Welsh and/or both Celtic and Scandinavian (Viking) male ancestry in the modern Orcadian population. Further comparisons of these British samples with Basque data suggested that the male Celtic genetic component was Paleolithic in origin, and therefore, that subsequent cultural transitions in North Wales were not associated with substantial incoming male gene flow. However, the study of Wilson et al. did not directly address the effects of cultural transitions in other areas of Britain.
This study is the first to analyze data from an east-west transect across Central England and North Wales to evaluate evidence of male population migration under a wide range of flexible population genetic models. Samples were collected in seven towns along this transect, and a combination of slowly evolving biallelic markers (so-called Unique Event Polymorphisms or UEPs) and rapidly evolving microsatellites on the Y chromosome were typed to look for evidence of local or small-scale genetic transitions. We compared the data with samples from Friesland and Norway to look for evidence of male immigration from the continent. In addition to comparing signature haplotypes among population samples, we applied novel model-based methods to make inferences about both the possible timing and extent of male continental migration into Central England.
Materials and Methods
Population Samples and Genotyping
Buccal swabs were collected from 313 males in the British towns of North Walsham, Fakenham, Bourne, Southwell, Ashbourne, Abergele, and Llangefni (fig. 1 ). These towns were selected because they lie approximately 50 km apart along an east-west transect of Britain and are long established market towns (mentioned in the Domesday Book of a.d. 1086 with current populations of 5,000–10,000) that are less likely to be influenced by recent migration than large cities (Pooley and Turnbull 1998 ). We apply the labels “East Anglia” to the North Walsham and Fakenham samples, “Midlands” to the Bourne, Southwell, and Ashbourne samples, “North Wales” to the Abergele and Llangefni samples, and “Central England” to the combined Midlands and East Anglia samples, although these labels are for convenience and only designate the general geographical area of these samples. Samples were acquired if both the donor and the donor's paternal grandfather were born within 30 km of one of these market towns. For comparison, we also collected DNA samples from 94 males in Friesland (northern Netherlands) and 83 males in Norway, two nearby locations with different roles in Britain's immigration history. Friesland is thought to be one of the source locations for Anglo-Saxon immigration both because of its geographical location and because Frisian is considered to be the closest extant language to Old English (Nielsen 1985 ). Norway represents one source of the Viking invaders. Samples were collected anonymously, and informed consent was obtained from all individuals before samples were taken.
Standard phenol-chloroform DNA extractions were performed. Six microsatellites (DYS19, DYS388, DYS390, DYS391, DYS392, DYS393) and 11 of the biallelic UEP markers (92R7, M9, M13, M17, M20, SRY+465, SRY4064, SRY10831, sY81, Tat, YAP) were typed and analyzed, as described by Thomas, Bradman, and Flinn (1999) . One additional UEP marker, 12f2, was typed, as described by Rosser et al. (2000) . Microsatellite repeat sizes were assigned according to the nomenclature of Kayser et al. (1997) . Haplogroups were defined by the 12 UEP markers according to a nomenclature modified from Rosser et al. (2000) and Weale et al. (2001) and are presented in figure 2 . The correspondence between this nomenclature and that proposed by the Y Chromosome Consortium (2002) is as follows: hg1 = P*(xR1a), hg2 = BR*(xDE,JR), hg3 = R1a1, hg4 = DE*(xE), hg7 = A3b2, hg8 = E3a, hg9 = J, hg16 = N3, hg20 = O2b, hg21 = E*(xE3a), hg26 = K*(xL,N3,O2b,P), hg28 = L, hg29 = R1a*, hg37 = Y*(xBR,A3b2).
Statistical and Population Genetic Analysis
We tested for significant population differentiation using the Exact Test for Population Differentiation of Raymond and Rousset (1995) . Unbiased genetic diversity, h, and its standard error were calculated using the formulae given by Nei (1987 , pp. 178–180). We quantified patterns of genetic differentiation using the genetic distance measures FST and RST estimated from analysis of molecular variance (AMOVA) ΦST values (Reynolds, Weir, and Cockerham 1983 ; Michalakis and Excoffier 1996 ). Confidence intervals for these statistics were constructed using bootstrap estimates of standard errors based on resampling haplotypes according to observed population frequencies. We visualized patterns of genetic differentiation using principal coordinates analysis performed on a similarity matrix calculated as 1 − RST. Values along the main diagonal of the similarity matrix, representing the similarity of each population sample to itself, were calculated from the estimated genetic distance between two copies of the same population sample (for ΦST-based FST and RST values, the resulting self-similarity values simplify to n/(n − 1), where n is the sample size).
We explored population genetic models that could explain our data using two methods of inference. The first method involved full-likelihood Bayesian inference of genetic and demographic parameters under population splitting and growth using the BATWING program (URL: http://www.maths.abdn.ac.uk/∼ijw), extended from the Markov chain Monte Carlo (MCMC) algorithm presented by Wilson and Balding (1998) . Microsatellite mutation likelihoods were calculated using an unbounded symmetric stepwise mutation model. The priors chosen for major BATWING parameters are summarized in table 1 . Locus-specific priors for the mutation rate per generation were based on observed mutations for these loci, as reported in Heyer et al. (1997) , Bianchi et al. (1998) , and Kayser et al. (2000) , combined with a standard exponential pre-prior. As a precautionary measure, DYS388 was excluded from BATWING analysis (and also from the Monte Carlo likelihood method described later) because no published data on observed meioses are available for this locus, and therefore, no direct verification exists of stepwise mutation behavior. Unique-event mutations inferred from binary marker data were used to condition the possible trees but otherwise did not contribute to the likelihood. Population splitting was modeled under strict fission with no subsequent background migration. Population growth was modeled as an exponential from an initially constant effective population size. Weakly informative priors were given to other parameters to aid in the convergence of the MCMC process. The prior for initial effective population size covers the values commonly assumed for the global Y chromosome effective population size as well as lower values to compensate for this being a regional sample and for representing the effective size before growth. The prior for population growth rate per generation is very flat and gives support to a very wide range of possible values (extending beyond the 2.5% and 97.5% quantiles) to reflect the uncertainty in relating growth in effective population size to growth in real (census) population size. All other parameters, such as the start-of-growth date and the population split dates, were given flat, uninformative priors.
BATWING suffers from the drawback that inference is based on a model of population differentiation that involves population splitting only, with no subsequent migration. In contrast, the MIGRATE method of Beerli and Felsenstein (2001) and the GENETREE method of Bahlo and Griffiths (2000) , both also based on coalescent modeling, allow constant background migration but do not allow population splitting or mass migration at a single point in time. Nielsen and Wakeley (2001) have presented a coalescent-based MCMC inference method that allows both population splitting and migration, but it is not suitable for microsatellite data and does not allow for population growth or for additional mass migration events that may occur at specific points in time. We therefore developed an alternative inference method that allowed us to explore more flexible models under a range of historical scenarios involving both background and mass migration in the presence of population splitting and growth. This method proceeds through Monte Carlo likelihood estimation based on summary statistics describing genetic differentiation. In what follows, we use the term background migration to refer to continuous gene flow occurring in each generation and mass migration to refer to a single large gene flow event. A program was written (available from M.E.W.) to simulate the coalescent under growth from an initially constant effective population size, allowing a single split TS generations ago of the parent population into two descendent populations, A and B, and subsequent background migration at a rate m, where a proportion m migrates from population A to B and simultaneously from B to A in each generation. A further extension to the program allowed for a single unidirectional migration event from B to A at a time TF generations ago, such that lineages in A immediately after this event had a probability F of having just migrated from B. Final sample sizes in each population were set to match those obtained in our study, and microsatellite repeat sizes in these samples were simulated using the unbounded symmetric stepwise mutation model. Parameters for population growth and mutation rates were set as fixed constants based on BATWING posterior modal values and were validated firstly by checking that the simulated within-population microsatellite variances were similar to observed values and secondly through comparison with BATWING results under scenarios involving no background migration. These parameters were fixed as follows: initial effective population size = 300; start of growth = 80 generations before present (BP); growth rate = 0.06; ratio of effective sizes of population A to population B = 1:1; mutation rates—DYS19 = 0.0023, DYS390 = 0.0030, DYS391 = 0.0012, DYS392 = 0.0011, DYS393 = 0.0012. The sensitivity of inferences to the initial effective population size was assessed by setting its value an order of magnitude higher (to 3000). Inferences considered here were little affected, and unaffected when (δμ)2 was used as a summary statistic (see below).
Confidence intervals (95%) for the remaining parameters TS, m,TF, and F describing population differentiation were estimated by setting constant values for all but one of the parameters and finding the upper and lower limits for the remaining parameter of interest. Preset values for the split date TS were chosen to reflect one of the three scenarios: (1) Island model (TS = ∞), (2) Neolithic (TS = 240 generations BP or 6,000 years BP assuming 25 years per generation), and (3) Anglo-Saxon (TS = 60 generations BP or 1,500 years BP assuming 25 years per generation). Preset values for the background migration rate m were set at one of two extremes: (1) an implausibly low value of m = 0, and (2) an implausibly high value of m = 0.1%. The latter value is estimated from migration statistics to and from the European Economic Area as a whole over the past 25 years (source: http://www.homeoffice.gov.uk/rds/index.htm). We regard this as a figure well in excess of realistic values for continuous background migration both because it is based on figures for the whole of Europe (i.e., not just Friesland) and because we expect background migration in recent times to be very high as a result of modern trends in communication and travel. In models that included the parameters F and TF, F was always the parameter of interest and TF was set under an Anglo-Saxon scenario (TF = 60).
Confidence limits (95%) for the parameter of interest were found using RST as a summary statistic of population differentiation, such that 2.5% of the simulated RST values were equal to or more extreme than the observed RST value when the parameter was set at one of the two limits, based on 10,000 Monte Carlo iterations of the coalescent simulation. Confidence limits were determined to an accuracy of the least significant digit stated. We also obtained confidence limits using (δμ)2 rather than RST as the summary statistic (Goldstein et al. 1995 ) and found these to be similar although generally wider than those obtained using RST.
Results
Patterns of Genetic Differentiation
The UEP markers defined seven haplogroups (hereafter abbreviated to hg) (fig. 2 and table 2 ), whereas the UEP plus microsatellite markers defined 150 haplotypes (table 3 ). Hg1 and hg2 predominate in the samples, with hg1 occurring at the highest frequencies in North Wales and hg2 occurring at the highest frequencies in East Anglia, Friesland, and Norway. Hg2 is almost completely absent from North Wales. Except for the high frequency of hg21 in Abergele, the observed haplogroup frequencies match their geographic distribution in Europe (Rosser et al. 2000). The high frequency of hg21 in Abergele may indicate high genetic isolation and drift in some parts of North Wales, a hypothesis that is consistent both with the tight clustering of Abergele haplotypes within this haplogroup and with the lower genetic diversity found in Llangefni.
Several patterns emerge from analyses of genetic distance and population differentiation (table 4 and fig. 3 ). Firstly, little genetic differentiation exists among the Central English towns. The only significant difference in haplotype frequencies occurs between the neighboring towns of Fakenham and North Walsham (P = 0.032 for individual pairwise comparison or P = 0.035 for combined test of all English towns). Although more hg1 and fewer hg2 chromosomes were observed in the Midlands than in East Anglia (table 2 ), Mantel tests on the genetic versus geographic distance correlation and linear regression on hg1 and hg2 frequencies reveal no significant within-England clinal patterns.
Secondly, in contrast to the Central English towns, the two North Welsh towns show highly significant differences, both from each other and from the five Central English towns. Llangefni has a very high frequency of hg1, tightly clustered around the modal haplotype (haplotype #1 in table 3 ; haplotype 1.15 in Wilson et al. 2001) that has been found at high frequency in other Atlantic populations, including Ireland (Hill, Jobling, and Bradley 2000) and the Orkneys (Wilson et al. 2001) . Both Llangefni and Abergele have very low frequencies of hg2 and dispersed haplotypes within this haplogroup, a pattern which is consistent with these haplotypes entering the North Welsh populations through separate, infrequent admixture events.
Thirdly, no significant differences in haplotype frequencies exist between Friesland and any of the Central English towns. Comparisons between Norway and the Central English towns, on the other hand, are all significant, apart from Bourne (P = 0.237), which may be explained by the small number of samples collected from this town (n = 12). Furthermore, bootstrap tests on RST values revealed that the Central English (all five towns combined) are significantly more closely related to the Frisians than they are to the North Welsh (Llangefni: P < 0.001; Abergele: P = 0.046) or to the Norwegians (P = 0.005). Both Friesland and Norway are significantly different from the North Welsh towns. Similar results were obtained using FST values based on haplogroup frequencies, but tests on FST values based on haplotype frequencies were not significant because of the large number of singletons at this level. Taken together, these results suggest considerable male-line commonality between Central England and Friesland.
Wilson et al. (2001) identified two haplotypes—(1) 2.47 (haplotype #60 in our table 3 ), and (2) 3.65 (haplotype #107 in our table 3 )—that proved useful in inferring a Viking contribution to the Orcadian gene pool, although they noted that it might not be possible to distinguish 2.47 from an Anglo-Saxon contribution in other parts of Britain. We compared the frequencies found in the Central English, Frisian, and Norwegian samples of (1) the 2.47 and 3.65 haplotypes on their own, (2) these two haplotypes plus their one-step mutational neighbors, and (3) these two haplotypes plus their one-step networks (defined as all haplotypes within a sample connected to the named haplotype by a series of one-step mutations via observed intermediate haplotypes). As suggested by the results in the previous paragraph, in each case the frequency distribution in Central England more closely matched that in Friesland than that in Norway. Thus, neither of these two haplotypes provided any positive evidence of a (Norwegian) Viking contribution to the Central English gene pool that could not be explained by a substantial contribution originating in Friesland only.
Population Genetic Models
We explored various population genetic models (see Materials and Methods) to evaluate whether or not a large Anglo-Saxon migration event is needed to explain the extremely high Central English-Frisian affinity. We started with a simple model of population fission with no background migration. We found a 95% credible interval for the split date using BATWING of 0–88 generations (0–2,200 years BP, assuming 25 years per generation), which corresponded well with the 95% confidence interval from the Monte Carlo likelihood method with no background migration (0–91 generations or 0–2,275 years BP assuming 25 years per generation).
Next, we looked at the levels of background migration, operating continuously from generation to generation, needed to maintain the Central English-Frisian genetic similarity under two other scenarios not involving Anglo-Saxon mass migration. Under an Island Model scenario (constant background migration between two populations that split at TS = ∞) the 95% confidence interval for m, estimated from the Monte Carlo likelihood method, is 0.3%–50% (where 50% indicates complete panmixia and is a maximum value for m). The same result (to the significant digit given) is found under a Neolithic mass migration scenario (population split 240 generations BP). We note that a figure of m = 0.3% is three times higher than the figure we estimated as representing an implausibly high value for m, well in excess of realistic values, based on migration statistics to and from the European Economic Area as a whole over the past 25 years. If we set m at the implausibly high value of 0.1%, the 95% confidence interval for a Central English-Frisian split date is 0–97 generations (0–2,425 years BP, assuming 25 years per generation). The figure of 97 generations BP represents an extreme upper limit for the migration event in this case both because it is based on such an implausibly high value for background migration and because it requires the most severe mass migration event imaginable, namely a 100% replacement of the English Y chromosome pool.
Next, we assumed that an Anglo-Saxon migration event did take place 60 generations ago (i.e., 1,500 years BP assuming 25 years per generation) and asked how big an event would be needed to explain the Central English-Frisian genetic similarity. If the Central English and Frisian populations were very different at the time of the event, a larger mass migration would be needed. We therefore started by assuming complete genetic identity of the two populations at the time of the Neolithic (i.e., a Central English-Frisian population split 240 generations BP). Assuming no background migration, the 95% confidence interval of the proportion F of the Central English population derived from an Anglo-Saxon mass migration event is 65%–100%. If a background migration rate since the Neolithic of m = 0.1% is allowed, the 95% confidence interval for F widens to 50%–100%. This result is unchanged if a 30-year generation time is assumed (i.e., an Anglo-Saxon migration event 50 rather than 60 generations ago).
Discussion
Our results indicate the presence of a strong genetic barrier between Central England and North Wales and the virtual absence of a barrier between Central England and Friesland. Any attempt to explain these results in terms of demographic history and migration needs to encompass both these findings satisfactorily. The Central English-North Welsh barrier cannot be explained purely as a simple isolation-by-distance phenomenon because it contrasts strongly with the lack of evidence for a cline among the five widely separated English towns. Our findings are particularly striking, given the high resolution and rapid mutation rate of the Y chromosome haplotypes on which they are based. These allow genetic barriers, if they exist, to be clearly defined.
The best explanation for our findings is that the Anglo-Saxon cultural transition in Central England coincided with a mass immigration from the continent. Such an event would simultaneously explain both the high Central English-Frisian affinity and the low Central English-North Welsh affinity. If we use a rate of 0.1%, as observed over the past 25 years, to represent an extremely high value for continuous background migration between Central England and continental Europe, then we estimate that an Anglo-Saxon immigration event affecting 50%–100% of the Central English male gene pool at that time is required. We note, however, that our data do not allow us to distinguish an event that simply added to the indigenous Central English male gene pool from one where indigenous males were displaced elsewhere or one where indigenous males were reduced in number. Furthermore, although our models assume a single instantaneous migration event, we would also expect a more gradual process lasting several generations but still resulting in the same degree of admixture (a picture which may fit the historical data better [Härke 2002]) to produce very similar genetic patterns.
We accept that our data do not prove conclusively that an Anglo-Saxon mass migration event took place. If a background migration rate of 0.3% is allowed between Central England and Friesland, then the need for a mass migration event disappears. However, we note that this is an extremely high rate even by modern standards and would have to have been maintained continuously over thousands of years. A background migration rate of 0.3% would imply that one in six of today's Central English males descend from Frisians (or a population identical to Frisians) that emigrated to England after the Anglo-Saxon period and that an equal proportion of today's Frisians descend from English in a like manner. We also note that under a unidirectional gene flow model involving immigration into Central England only, the rate of background migration would then have to double to be at least 0.6% on a continuous basis.
It is also true that a mass migration event could have occurred outside the Anglo-Saxon migration period because the 95% confidence interval for a Central English-Frisian split extends as far back as 425 b.c. (if one allows a background migration rate of 0.1% and a generation time of 25 years). Archaeology and the testimony of Caesar combine to suggest an immigration of the Belgae, a Celtic tribe from northern Gaul, into central southern England (Hampshire and West Sussex) between 100 and 80 b.c. (Hawkes 1968 ; Cunliffe 1988 , pp. 147–149; Cunliffe 1991 , pp. 108–110). Furthermore, although Friesland lay outside the maximum extent of the Roman Empire, small numbers of Frisian mercenaries were recruited by the Romans and stationed as far north as Hadrian's Wall (Breeze and Dobson 1978 , pp. 139–140; Collingwood, Wright, and Tomlin 1995 , p. 501). However, most historians would see these movements, if they would acknowledge them at all, as preludes to post-Roman Anglo-Saxon migration, and it would be odd indeed to deny the latter while at the same time assigning an extremely large mass migration status to the former.
Finally, we accept that our inferences are based on population genetic analyses that assume a particular model of microsatellite evolution under selective neutrality and growth and that departures from these assumptions may influence our results. However, we note that the accuracy of the mutation model is diminished in importance by the small number of generations that would allow new mutations to accumulate since Anglo-Saxon times and also that any selective sweeps would also have to have been very recent in order to have influenced our conclusions greatly, especially because the effects of such sweeps would partly be accommodated by our model of exponential population growth. In addition, the estimates provided by BATWING for effective population sizes at the time of the Anglo-Saxon migration event are very small (table 1 ). Thus, a large amount of error caused by drift is already allowed for by our BATWING and Monte Carlo likelihood analyses. We do not presume an exact correspondence between real and effective population size dynamics or between the real population history of England, which has seen many different changes in size, and our simple model of exponential growth. However, we note that the posterior mode of the effective population growth rate per generation provided by BATWING (6.0%) almost exactly matches the real estimated population growth rate averaged over the past 1,500 years (Hatcher 1977 , pp. 1348–1530; Wrigley and Schofield 1989 , pp. 1541–1871; Härke 2002 ), whereas our 95% credible interval covers both the lower average growth rates of a.d. 500–1750 (approximately 3% per 25 years, albeit with large fluctuations) and the higher average growth rates of a.d. 1750–2000 (approximately 23% per 25 years).
Anglo-Saxon settlements and culture appeared throughout England but, importantly, did not extend into North Wales, where many of the original Celtic Britons living in England are thought to have fled (Kearney 1989 ; Davies 1993, 1999 ). Conflict between the Welsh and Anglo-Saxon kingdoms continued over a long period. Offa's Dyke (an earthwork barrier 240 km long) was constructed ca. a.d. 790 and provided a well-defined boundary between England and Wales. The linguistic, cultural, and political separation of the two regions lasted at least until a.d. 1282 when Edward I of England defeated the Welsh King Llywelyn II (Davies 1993 ). Our results suggest that this separation has also restricted male-mediated gene flow between the two regions over the past approximately 1500 years.
Comparisons of Central English and Norwegian haplotypes reveal no evidence of distinctive common signature haplotypes indicative of Viking origin, in contrast to Orcadian-Norwegian comparisons (Wilson et al. 2001) . However, the Vikings who may have settled in East Anglia and the Midlands are thought to have been predominantly from Denmark, rather than Norway (Richards 2000) . Previously published data suggest that the Danish have greater Y chromosome genetic affinity with the English than with the Norwegians (Malaspina et al. 2000; Rosser et al. 2000) . However, the Danish-German border is believed to be another source location of the Anglo-Saxons (Kearney 1989 ; Davies 1999 ), so any Danish Viking influence on the English gene pool may prove difficult to distinguish from Anglo-Saxon influence. Further studies within Scandinavia and elsewhere are needed to resolve this issue.
This study shows that the Welsh border was more of a genetic barrier to Anglo-Saxon Y chromosome gene flow than the North Sea. Remarkably, we find that the resultant genetic differentiation is still discernible in the present day. These results indicate that a political boundary can be more important than a geophysical one in population genetic structuring and that informative patterns of genetic differentiation can be produced by migration events occurring within historical times.
Edward Holmes, Reviewing Editor
Both these authors contributed equally to this work
Keywords: Y chromosome unique event polymorphisms microsatellite haplotypes British population history genetic anthropology population genetic models
Address for correspondence and reprints: Michael Weale, The Centre for Genetic Anthropology, Departments of Biology and Anthropology, University College London, University of London, Darwin Building, Gower Street, London WC1E 6BT, United Kingdom. m.weale@ucl.ac.uk .
Table 1 Prior Distributions of Major BATWING Parameters and Posterior Values Based on a Splitting Model Between Central England and Friesland
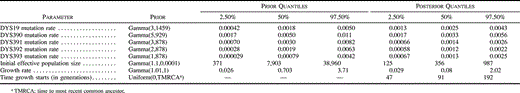
Table 1 Prior Distributions of Major BATWING Parameters and Posterior Values Based on a Splitting Model Between Central England and Friesland
Table 2 Haplogroup Frequencies and Genetic Diversities in Seven British Towns, Friesland and Norway
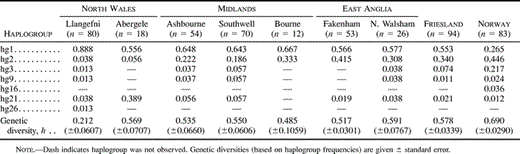
Table 2 Haplogroup Frequencies and Genetic Diversities in Seven British Towns, Friesland and Norway
Table 3 UEP + Microsatellite Haplotype Frequencies and Genetic Diversities in Seven British Towns, Friesland, and Norway
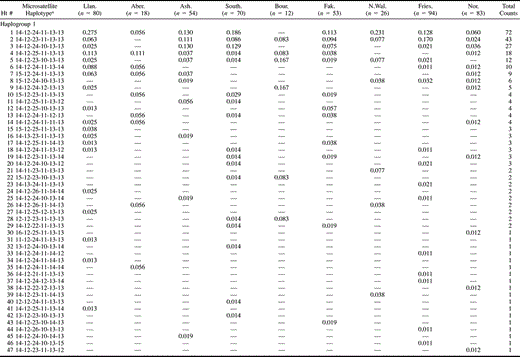
Table 3 UEP + Microsatellite Haplotype Frequencies and Genetic Diversities in Seven British Towns, Friesland, and Norway
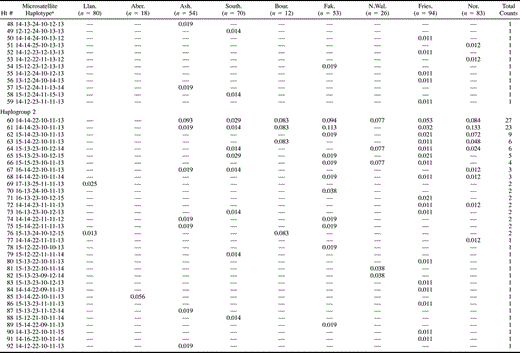
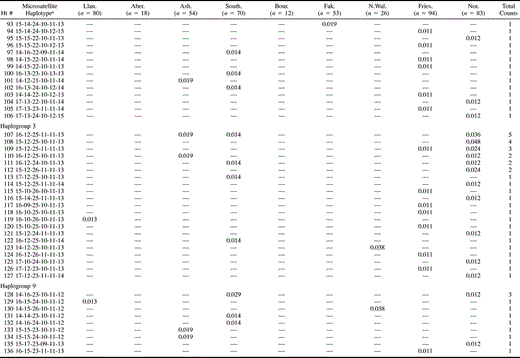
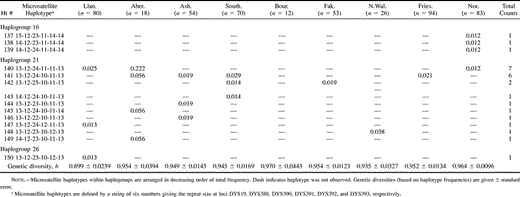
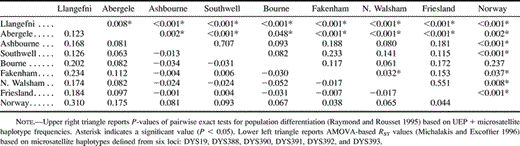
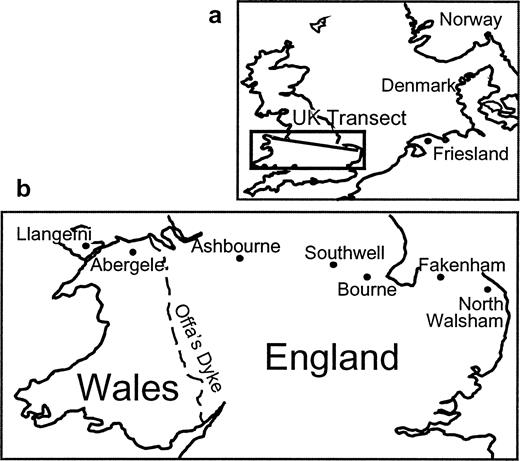
Fig. 1.—(a) Map of Britain and neighboring area. (b) Enlargement showing towns within Britain along east-west transect
![Fig. 2.—Y chromosome haplogroup network defined by the 11 UEP markers used in this study following a nomenclature modified from Rosser et al. (2000) and Weale et al. (2001) . The root has been deduced by comparison with other great ape species (Underhill et al. [2000]; P. Underhill, personal communication for position of SRY10831). Shading indicates haplogroups observed in this study](https://oup.silverchair-cdn.com/oup/backfile/Content_public/Journal/mbe/19/7/10.1093_oxfordjournals.molbev.a004160/2/m_mbev-19-05-18-f02.jpeg?Expires=1716327621&Signature=DzCuqP6QFGNHYks2iYxddIIc~yK3R7grt79M~atvW-Z0jpIV95mDEqgAu~-U5PsnOcVmjScCtSaE0b4qeWaLwytegVZdtYKulfi7nAkdHjEyp-oKx1kSHkKAHnmTG19SyTnWAb97FJUr10UcsK8~HXaoorQwwcra6ayOcAk2MzR7YjlFLnK5jbETz-xSNcVEzIPWto2BQcyqzCuZjM0gMZSAb~ExiacSrVE0lwMoDpKSEAIxUrHIrdQdyFp7T1~d0lZiMC2E97fw6EsYfqlbhCFG6OMQFxYCXJ34NXhfimN23sg-0krE7tlo4I7zJyx0RzNevWbqNSQ3O4yMzmCzfA__&Key-Pair-Id=APKAIE5G5CRDK6RD3PGA)
Fig. 2.—Y chromosome haplogroup network defined by the 11 UEP markers used in this study following a nomenclature modified from Rosser et al. (2000) and Weale et al. (2001) . The root has been deduced by comparison with other great ape species (Underhill et al. [2000]; P. Underhill, personal communication for position of SRY10831). Shading indicates haplogroups observed in this study
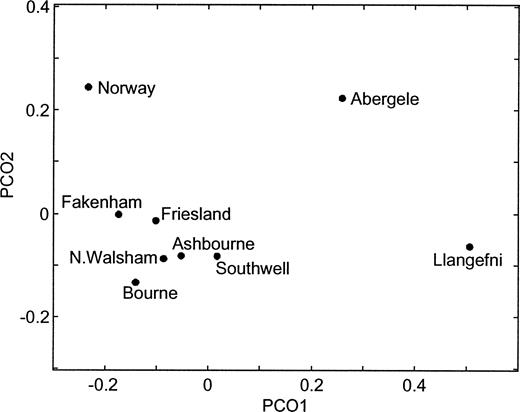
Fig. 3.—Principal coordinates plot of RST values reported in table 4 . The first and second projections (PCO1 and PCO2) explain 59% and 20% of the variation, respectively
We thank all of the Y chromosome donors who contributed to this study and M. A. Strøksnes, Drs. P. Clark, M. Gee, P. R. Gage, S. J. Keen, M. R. Greenwood, J. D. Peterson, Kirtley, A. Hawkes, L. J. Moore, and M. Sears for helping to collect the samples. We thank Heinrich Härke, Lounès Chikhi, and two anonymous referees for valuable comments on an earlier draft of this paper. M.G.T. is supported by a Nuffield Foundation grant (NUF-NAL).
References
Adams W. Y., D. P. Van Gerven, R. S. Levy,
Bahlo M., R. C. Griffiths,
Beerli P., J. Felsenstein,
Bianchi N. O., C. I. Catanesi, G. Bailliet, V. L. Martinez-Marignac, C. M. Bravi, L. B. Vidal-Rioja, R. Herrera, J. S. Lopez-Camelo,
Burmeister S.,
Cartwright R. A., H. J. Hargreaves, E. Sunderland,
Casalotti R., L. Simoni, M. Belledi, G. Barbujani,
Cavalli-Sforza L. L., P. Menozzi, A. Piazza,
Chapman J.,
Chapman J., H. Hamerow, eds
Collingwood R. G., R. P. Wright, R. S. O. Tomlin,
Crawford S.,
———.
Esmonde-Cleary A. S.,
Falsetti A. B., R. R. Sokol,
Goldstein D. B., A. Ruiz Linares, L. L. Cavalli-Sforza, M. W. Feldman,
Hamerow H.,
———.
Helgason A., S. Sigurdardóttir, J. Nicholson, B. Sykes, E. W. Hill, D. G. Bradley, V. Bosnes, J. R. Gulcher, R. Ward, K. Stefánsson,
Heyer E., J. Puymirat, P. Dieltjes, E. Bakker, P. de Knijff,
Hill E. W., M. A. Jobling, D. G. Bradley,
Hodges R.,
Kayser M., S. Brauer, G. Weiss, W. Schiefenhövel, P. A. Underhill, M. Stoneking,
Kayser M., A. Caglià, D. Corach, et al. (30 co-authors)
Kayser M., L. Roewer, M. Hedman, et al. (14 co-authors)
Long C. C., C. Darke, R. Marks,
Malaspina P., F. Cruciani, P. Santolamazza, et al. (24 co-authors)
Mascie-Taylor C. G. N., G. W. Lasker,
Mastana S. S., R. Jayasekara, P. Fisher, R. J. Sokol, S. S. Papiha,
Merryweather-Clarke A. T., J. J. Pointon, J. D. Shearman, K. J. H. Robson,
Michalakis Y., L. Excoffier,
Näsman U.,
Nielsen H. F.,
Nielsen R., J. Wakeley,
Papiha S. S., M. F. Duggan Keen, R. S. E. Rodger,
Petersen P. V.,
Pooley C., J. Turnbull,
Poser C. M.,
Renfrew C.,
Reynolds J., B. S. Weir, C. C. Cockerham,
Richards M., V. Macaulay, E. Hickey, et al. (37 co-authors)
Rosser Z. H., T. Zerjal, M. E. Hurles, et al. (63 co-authors)
Semino O., G. Passarino, P. J. Oefner, et al. (17 co-authors)
Simoni L., F. Calafell, D. Pettener, J. Bertranpetit, G. Barbujani,
Shennan S.,
Thomas M. G., N. Bradman, H. M. Flinn,
Thomas M. G., K. Skorecki, H. Ben-Ami, T. Parfitt, N. Bradman, D. B. Goldstein,
Torroni A., H. Bandelt, H. D'Urbano, et al. (11 co-authors)
Tyfield L. A., M. J. Osborn, J. B. Holton,
Underhill P. A., P. Shen, A. A. Lin, et al. (21 co-authors)
Weale M. E., L. Yepiskoposyan, R. F. Jager, N. Hovhannisyan, A. Khudoyan, O. Burbage-Hall, N. Bradman, M. G. Thomas,
Wilson I. J., D. J. Balding,
Wilson J. F., D. A. Weiss, M. Richards, M. G. Thomas, N. Bradman, D. B. Goldstein,
Wrigley E. A., R. S. Schofield,
