


Abstract
Male mutation bias is a higher mutation rate in males than in females thought to result from the greater number of germ line cell divisions in males. If errors in DNA replication cause most mutations, then the magnitude of male mutation bias, measured as the male-to-female mutation rate ratio (α), should reflect the relative excess of male versus female germ line cell divisions. Evolutionary rates averaged among all sites in a sequence and compared between mammalian sex chromosomes were shown to be indeed higher in males than in females. However, it is presently unknown whether individual classes of substitutions exhibit such bias. To address this issue, we investigated male mutation bias separately at non-CpG and CpG sites using human-chimpanzee whole-genome alignments. We observed strong male mutation bias at non-CpG sites: α in the X-autosome comparison was ∼6–7, which was similar to the male-to-female ratio in the number of germ line cell divisions. In contrast, mutations at CpG sites exhibited weak male mutation bias: α in the X-autosome comparison was only ∼2–3. This is consistent with the methylation-induced and replication-independent mechanism of CpG transitions, which constitute the majority of mutations at CpG sites. Interestingly, our study also indicated weak male mutation bias for transversions at CpG sites, implying a spontaneous mechanism largely not associated with replication. Male mutation bias was equally strong at CpG and non-CpG sites located within unmethylated “CpG islands,” suggesting the replication-dependent origin of these mutations. Thus, we found that the strength of male mutation bias is nonuniform in the primate genomes. Importantly, we discovered that male mutation bias depends on the proportion of CpG sites in the loci compared. This might explain the differences in the magnitude of primate male mutation bias observed among studies.
Introduction
Mutations are the ultimate source of genetic variation in natural populations and the cause of many human genetic diseases; however, spontaneous mutations are very difficult to study directly because of their rarity. To address the question of whether mutations result primarily from errors in DNA replication, one can compare mutation rates and the numbers of germ line cell divisions for males and females. In mammals, the male germ line undergoes more cell divisions (and more DNA replications) than the female germ line (Vogel and Motulsky 1997), giving replication errors more opportunity to accumulate in males. If mutations originate mostly during DNA replication, then the male-to-female ratio of mutation rates (α) should be similar to the male-to-female ratio of germ line cell divisions (c). If α is different from c, then the contribution of replication-independent factors is not negligible. The Y chromosome is transmitted only through the male germ line, the X chromosome is transmitted more often through the female germ line, and autosomes are transmitted equally in the male and female germ lines. Thus, comparisons of mutation rates among X, Y, and autosomes can be used to estimate α (Miyata et al. 1987) and to speculate about the mechanism (replication dependent vs. replication independent) of a particular type of mutation.
Male bias for nucleotide substitutions has been observed in a variety of mammals (Li, Yi, and Makova 2002). The magnitude of such bias in primates has been the subject of a recent controversy. In primates, males undergo approximately five to six times more germ line cell divisions than females (Hurst and Ellegren 1998). Comparisons of nucleotide substitution rates between primate genes homologous between chromosomes Y and X resulted in α ≈ 5 (Shimmin, Chang, and Li 1993; Huang et al. 1997), consistent with an important role for replication errors in the generation of substitution mutations. However, two other studies (Bohossian, Skaletsky, and Page 2000; Lander et al. 2001) claimed that α was only ∼2 in humans and thus suggested a significant input of replication-independent factors. Recently, two additional studies observed a stronger male mutation bias in primates with α equal to ∼3 (Ebersberger et al. 2002) and ∼5 (Makova and Li 2002).
While the existence of male bias for substitution (point) mutations in mammals is well accepted, not “all” substitution mutations are expected to exhibit this bias. In particular, transitions at CpG dinucleotides occur predominantly due to spontaneous deamination of methylated cytosines (Ehrlich and Wang 1981), a replication-independent process. Thus, it has been suggested that CpG transition rate should scale with time and not with the number of cell divisions (Vogel and Motulsky 1997). Investigations of male mutation bias at CpG dinucleotides have led to contradictory results. Two studies—one in primates (Nachman and Crowell 2000) and the other in rodents (Smith and Hurst 1999)—observed similar rates of transitions at CpG dinucleotides between autosomes and chromosome X. However, a third study (Anagnostopoulos et al. 1999) observed a higher rate of CpG transitions on chromosome Y than on chromosome X in primates. All three studies analyzed a relatively small number of sites.
The draft sequence of the chimpanzee genome (Mikkelsen et al. 2005) and human-chimpanzee genomic alignments provide a novel opportunity to investigate male mutation bias in primates. Chimpanzee is the closest human relative, and the two species have similar generation times (Ruvolo 1997) and physiologies. Thus, humans and chimpanzees are expected to undergo about the same number of germ line cell divisions. The small evolutionary distance also reduces the chance of multiple substitutions occurring at the same site, requiring minimal, if any, correction (Ebersberger et al. 2002). A genome-wide study allows substitution rates to be estimated for a large number of loci, counterbalancing the effects of regional (intrachromosomal) variation (Waterston et al. 2002; Hardison et al. 2003). Additionally, the determinants of such variation (e.g., GC content and recombination rate) can be assumed to be equivalent in closely related species (although see Ptak et al. 2004).
Male mutation bias estimated for closely related species should be corrected for diversity in the ancestral population (Li, Yi, and Makova 2002; Makova and Li 2002). Indeed, for closely related species, the observed divergence is equal to the sum of divergence since speciation and the diversity present in the ancestral population at speciation (Li 1977). Diversity differs among autosomes, X, and Y due to the different effective population sizes of these chromosomes. Selective sweeps and background selection are additional factors that might contribute to the extremely low levels of diversity on chromosome Y (Begun and Aquadro 1992; B. Charlesworth and D. Charlesworth 2000; Berlin and Ellegren 2004). Because interchromosomal differences in diversity caused by these factors might confound estimates of substitution rate, it is important to subtract diversity at the point of speciation (henceforth referred to as “ancient diversity”) from the observed divergence before calculating the magnitude of male mutation bias from closely related species. This approach has been utilized in a number of recent studies (Makova and Li 2002; Bartosch-Harlid et al. 2003; Axelsson et al. 2004).
Here, we use the human-chimpanzee whole-genome alignments to address the following questions. (1) Is male mutation bias observed at CpG dinucleotides and does its magnitude differ from that at non-CpG sites? (2) Can male mutation bias be explained by intrachromosomal variation in substitution rates? (3) Does the magnitude of male mutation bias differ between transitions and transversions? (4) What is the magnitude of male mutation bias at CpG islands, which are usually unmethylated? (5) How do our estimates of male mutation bias compare with those obtained from previous studies?
Methods
Data Sets
BlastZ (Schwartz et al. 2003) alignments of the July 2003 human genome assembly (hg16) with the November 2003 ARACHNE chimpanzee draft assembly (panTro1) were obtained from the University of California Santa Cruz (UCSC) Genome Browser (http://genome.ucsc.edu). Sequences that aligned between two different sex chromosomes or between a sex chromosome and an autosome were discarded. Due to the draft state of the chimpanzee assembly, we examined only high-quality sites by employing a modified version of the neighborhood quality standard (NQS; Altshuler et al. 2000) used by the Chimpanzee Genome Analysis group (Mikkelsen et al. 2005). Specifically, we excluded any alignment column satisfying any of these conditions: (1) quality score <30 in the chimpanzee sequence; (2) within five columns of another column with quality score <20 in the chimpanzee sequence; or (3) within five columns of an alignment gap. The pseudoautosomal and recently transposed regions of chromosome X and chromosome Y, the palindromic and ampliconic regions on chromosome Y (Skaletsky et al. 2003), and recent segmental duplications (Cheung et al. 2003) were excluded. Additionally, at this stage we removed CpG islands because they are usually unmethylated (Cross and Bird 1995) and thus might confound our analysis of substitutions at CpG sites. As a result, we obtained the “filtered” data set (Supplementary Table 1, Supplementary Material online).
To minimize the effects of selection, we also analyzed the “noncoding nonrepetitive (NCNR) set” (Supplementary Table 1, Supplementary Material online), a subset of the filtered set, from which we excluded interspersed repetitive elements, known genes, and 5-kb flanking regions upstream and downstream of known genes. Interspersed repetitive elements were excluded because they (particularly the young ones) undergo frequent gene conversion (Batzer and Deininger 2002) and have a heterogeneous methylation pattern (Meunier et al. 2005). The locations of known CpG islands, genes, and interspersed repetitive elements were obtained from the UCSC Genome Browser. An additional data set contained CpG islands on autosomes and chromosome X. CpG islands were not analyzed on chromosome Y due to lack of data.
Defining CpG and Non-CpG Sites
Two definitions were used to distinguish between CpG and non-CpG sites. According to the “inclusive” definition, all sites were divided into CpG sites (sites that were CG in at least one of the two species) and non-CpG sites (sites that were not CG in both species). According to the “restricted” definition, sites were considered to be CpG if they were CG in at least one of the two species, however, sites that were part of overlapping CpGs were excluded; non-CpG sites were defined as sites that were not CG in both species and were not immediately preceded or followed by either C or G in either species. Simulations have indicated that the restricted definition leads to minimal errors (potential homoplasies due to high mutation rate at CpG sites) in estimation of substitution rates (Meunier and Duret 2004). However, the use of this definition substantially decreased sample size and might have introduced bias (e.g., non-CpG sites were located in regions with lower GC content when the restricted definition was used). Thus, the results for both site definitions are reported.
Calculating Divergence and Male-to-Female Mutation Rate Ratio
Following Ebersberger et al. (2002), divergence was determined by dividing the number of sites different between humans and chimpanzees by the total number of aligned sites. For each chromosome, this was done separately for CpG and non-CpG sites (according to the two definitions used) as well as for all sites. The divergence for autosomes (A) was calculated as the average divergence among individual autosomes weighted by their lengths (a similar approach was later used to calculate the diversity for autosomes). Each of the three ratios of these rates (X/A, Y/X, Y/A) was then used to derive α according to the formulas in Miyata et al. (1987). The 95% confidence intervals (CIs) for α were estimated using the bootstrap method. Namely, we divided the human genome into 10-kb windows (a total of 307,002), randomly selected the alignments 1,000 times with replacement, and estimated the divergence from these pseudosamples.
Correcting for Ancient Diversity
To correct for ancient diversity, two times and four times the human diversity (π) was subtracted from the value of observed divergence for X, Y, and autosomes (Ebersberger et al. 2002). Human diversity was estimated by sequencing eight unrelated African-American individuals with an average coverage of 1× (sequencing was done at the Baylor College of Medicine and the Broad Institute (The International HapMap Consortium 2003). Assuming a Poisson distribution, most sites were covered by one sequence read (the reads were clonal and had no heterozygotes), and all the reads were likely to come from independent samples. We counted a base as covered at depth N, if N different reads aligned to that base and the alignment met the NQS at that position. Total coverage for a chromosome was calculated as the sum of the coverage of all the bases. Diversity was calculated as the total number of single-base differences between any reference base and any read (because all reads are expected to be independent and randomly distributed) divided by the total number of bases analyzed. For each individual chromosome, diversity was calculated separately for CpG and non-CpG sites and for CpG sites in CpG islands. Because of differences in methylation, divergence at CpG sites located in CpG islands was corrected using diversity calculated specifically for these sites.
The correction for ancient diversity led to a decrease in αX/A but to an increase in αY/X and αY/A. The divergence on autosomes was higher than that on chromosome X (Supplementary Table 2, Supplementary Material online). As the diversity on autosomes was also higher than that on chromosome X (Supplementary Table 3, Supplementary Material online), correcting for ancient diversity decreased the autosomal divergence to a greater extent than the chromosome X divergence, thus bringing the two divergence values closer together and leading to lower αX/A. Similarly, in the Y/X and Y/A comparisons, correcting for ancient diversity led to lower divergence on autosomes and on chromosome X but to virtually no change on chromosome Y. As a result, αY/X and αY/A increased.
Correcting for Regional Variation in GC Content and Recombination Rates
For this part of the analysis, the human-chimpanzee divergence and human diversity were calculated in 3-Mb windows, for which sex-averaged recombination rates were available (Kong et al. 2002). Recombination rates (in cM/Mb) were calculated as the slope of the regression of genetic and physical distances of markers within each 3-Mb window separately. To obtain divergence values corrected for the effect of ancient diversity, two times the human diversity was subtracted from the human-chimpanzee divergence.
To assess the significance of differences in human-chimpanzee divergence between autosomes and chromosome X when correcting simultaneously for GC content and recombination rate, we employed a regression approach. Restricting attention to windows for which both GC content and recombination rate were available (a total of 36 windows on X and 840 windows on autosomes), we regressed divergence on GC content (linear and quadratic terms) and recombination rate (linear) and took residuals. To compare residual divergences between autosome and chromosome X windows, we calculated a two-sample t-statistic (Ott 1993). The null distribution of the t-statistic was simulated by random permutations. Namely, we randomly permuted the labels that identified windows as belonging to autosomes or X 1,000 times and recomputed the t-statistic for each permutation. Thus, we obtained a null distribution and a right-tail P value (the probability of a t-statistic equal to or larger than the observed one if indeed the human-chimpanzee divergence differed between autosomes and X only by chance). All permutation tests were implemented using the R statistical package (http://www.r-project.org/).
Dependence of α on the Proportion of CpG Sites
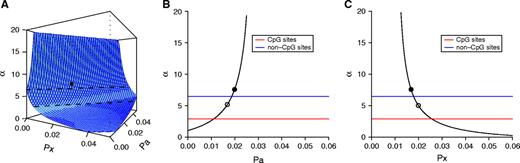
The dependence of αX/A for all sites on the proportion of CpG sites in chromosome X (pX) and autosomes (pA) in the filtered data set. The αX/A values computed for non-CpG sites and CpG sites are shown as horizontal lines. (A) Part of the surface α = f(pX, pA). The upper dashed line is αX/A for non-CpG sites and the lower dashed line is αX/A for CpG sites. The observed αX/A for all sites is indicated by the filled circle. (B) The slice of the surface α = f(pX, pA) with pX fixed at 0.0168 (the observed proportion of CpG sites in X). The filled circle corresponds to pA = 0.0199, which is the observed proportion of CpG sites at autosomes. The open circle corresponds to pX = pA = 0.0168. (C) The slice of the surface α = f(pX, pA) with pA fixed at 0.0199 (the observed proportion of CpG sites in autosomes). The filled circle corresponds to pX = 0.0168, which is the observed proportion of CpG sites in X. The open circle corresponds to pA = pX = 0.0199.
Results and Discussion
Inference of Male Mutation Bias from Human-Chimpanzee Genomic Alignments
Three data sets were used in this study (see Methods; Supplementary Table 1, Supplementary Material online). Divergence in the filtered data set is expected to reflect the genome-wide average, while that in the NCNR data set should represent the neutral rate at nonrepetitive sites. The third data set consisted of CpG islands. We calculated divergence at CpG and non-CpG sites under inclusive and restricted definitions (see Methods) as well as for all sites (CpG and non-CpG sites taken together). This was done separately for the two sex chromosomes and autosomes (Supplementary Table 2, Supplementary Material online) and used to calculate the magnitude of male mutation bias.
Male mutation bias was estimated from the observed divergence and from that corrected by ancient diversity. To apply this correction, we assumed that diversity in the population of the human and chimpanzee common ancestor was two to four times higher than it is in contemporary humans (Supplementary Table 3, Supplementary Material online). Larger effective population size in the common ancestor of humans and chimpanzees than in contemporary humans is supported by population genetic models (Chen and Li 2001; Wall 2003) and by recent molecular data indicating high nucleotide diversity in contemporary chimpanzee populations (Yu et al. 2003; Fischer et al. 2004).
Our analysis focused on comparing human-chimpanzee divergence between chromosome X and autosomes. When chromosome Y was compared with chromosome X or autosomes, the results were less reliable because the divergence and diversity estimates for chromosome Y (particularly for CpG sites on chromosome Y) were obtained from a substantially smaller number of sites than for the other chromosomes (Supplementary Tables 1 and 3, Supplementary Material online).
Male Mutation Bias at Non-CpG Versus CpG Sites
From the X-autosome comparison, we observed strong male bias at non-CpG sites, which implies that mutations at such sites are caused primarily by errors in DNA replication (table 1). The resulting values of αnon-CpG (∼6–7) were close to the sex ratio in the number of germ line cell divisions in primates (c ≈ 6), suggesting that most mutations at non-CpG sites occur due to errors in DNA replication. When diversity in the human-chimpanzee common ancestor was assumed to be three to four times greater than that in contemporary humans, we obtained overlapping or nearly overlapping 95% CIs for αnon-CpG calculated from comparisons between X and autosomes, X and Y, and Y and autosomes (table 1, Supplementary Table 4 [Supplementary Material online], and data not shown). This suggests that the distinct numbers of cell divisions for male and female germ lines are the major factors determining the differences in the non-CpG substitution rates among X, Y, and autosomes.
Comparison of Male Mutation Bias (from the X-autosome comparison) Between CpG and Non-CpG Sites Located Outside CpG Islands
Inclusive site definition | Restricted site definition | ||||||||||
|---|---|---|---|---|---|---|---|---|---|---|---|
| Data Set | Correction for Ancient Diversity | αCpG (95% CIa) | αnon-CpG (95% CI) | αCpG/αnon-CpG (95% CI) | αCpG (95% CI) | αnon-CpG (95% CI) | αCpG/αnon-CpG (95% CI) | ||||
| Filtered | None | 2.90 (2.76–3.05) | 6.46 (5.98–6.99) | 2.22 (2.09–2.38) | 3.55 (3.35–3.76) | 6.13 (5.68–6.58) | 1.72 (1.60–1.87) | ||||
| 2πb | 2.60 (2.45–2.75) | 6.17 (5.65–6.75) | 2.37 (2.21–2.56) | 3.35 (3.13–3.58) | 5.86 (5.39–6.35) | 1.75 (1.61–1.91) | |||||
| 4πb | 2.20 (2.05–2.36) | 5.79 (5.23–6.44) | 2.63 (2.42–2.89) | 3.09 (2.85–3.34) | 5.53 (5.03–6.06) | 1.79 (1.62–1.98) | |||||
| NCNRc | None | 2.81 (2.60–3.03) | 7.90 (7.02–8.84) | 2.82 (2.52–3.15) | 3.54 (3.21–3.92) | 7.22 (6.41–8.07) | 2.04 (1.79–2.32) | ||||
| 2π | 2.52 (2.31–2.75) | 7.78 (6.78–8.89) | 3.09 (2.71–3.52) | 3.36 (3.00–3.77) | 7.04 (6.16–8.00) | 2.10 (1.81–2.43) | |||||
| 4π | 2.15 (1.94–2.40) | 7.62 (6.47–8.95) | 3.54 (3.03–4.14) | 3.13 (2.75–3.58) | 6.82 (5.85–7.89) | 2.18 (1.84–2.59) | |||||
95% CI.
Assuming the population size of the chimpanzee-human common ancestor to be twice and four times as high as it is in contemporary humans.
NCNR data set.
Interestingly, in the X-autosome comparison male mutation bias was approximately two- to threefold lower at CpG sites than at non-CpG sites (table 1). For both data sets, both site definitions, and independent of correction for ancient diversity, the difference between αCpG and αnon-CpG was significant as assessed by the bootstrap method. The αCpG values from the X-Y and Y-autosome comparisons showed substantial variation and wide CIs (Supplementary Table 5, Supplementary Material online) and need to be reevaluated when a high-quality sequence of chimpanzee chromosome Y and more accurate diversity estimates for this chromosome become available.
The low male bias observed at CpG sites from the X-autosomal comparison is consistent with the molecular mechanism of CpG transitions. Because the majority of mutations at CpG sites are transitions resulting from spontaneous deamination of cytosine (Ehrlich and Wang 1981), substitutions at these sites are expected to be less dependent on the number of DNA replications in the two germ lines as compared with substitutions at non-CpG sites. Remarkably, the weak male mutation bias at CpG sites observed here complements another recent finding that also points to the relative independence of CG→TG mutations from DNA replication. Hwang and Green (2004) showed that, compared to other substitutions, CpG transitions accumulate in a relatively clocklike fashion in mammalian evolution: they do not appear to be affected by generation time and are probably not caused by replication errors.
Because substitutions leading to loss and to formation of CpG sites (the latter is expected to be replication dependent) were considered together, we still observed a higher substitution rate at CpG sites in males than in females (i.e., αCpG > 1). An outgroup sequence (e.g., macaque) will allow us to differentiate between CG→TG and TG→CG substitutions and to investigate male mutation bias for these substitutions separately. However, even after we separate these, mutations that lead to the loss of CpG sites might still exhibit weak male mutation bias. The level of methylation is known to be lower in the mammalian germ line (Monk 2002) than in somatic cells and thus, some mutations at CpG sites in the germ line might result not from spontaneous deamination of methylated cytosine but from replication errors. Additionally, a potentially higher methylation level of sperm than of oocyte DNA (Monk 1995) could also contribute to αCpG > 1. However, the magnitude, timing, and genomic location of methylation differences between the two germ lines have been debated (Yoder, Walsh, and Bestor 1997; Bestor 1998; El-Maarri et al. 1998) and require further studies.
Male Mutation Bias and Variation in GC Content and Recombination Rate
In addition to interchromosomal variation, substitution rate has been shown to fluctuate intrachromosomally (Lercher, Williams, and Hurst 2001; Malcom, Wyckoff, and Lahn 2003) and to correlate with GC content and recombination rate (Hardison et al. 2003). Thus, one might argue that the substitution rate is lower on chromosome X than on autosomes because of differences in GC content and/or recombination rate. To explore this possibility, we evaluated the difference in divergence between autosomal and chromosome X windows accounting for GC content and recombination rate (windows in chromosome Y were not investigated because of the lack of data). Namely, we divided chromosome X and the autosomes into 3-Mb windows, regressed divergence on GC content and recombination in these windows, compared the resulting residuals between autosome and chromosome X windows, and used a random permutation test to determine the significance of the observed differences. Even after we accounted for GC content and recombination, the divergence at both non-CpG and CpG sites (for both site definitions) was still significantly lower for the X chromosome than for autosomes. This was observed for both the NCNR and filtered data sets and when divergence was corrected for ancient diversity (P < 0.001 in all comparisons). Thus, our data support male mutation bias despite the variation in GC content and recombination rate that has been linked to variation in substitution rate within chromosomes.
Male Mutation Bias at Transitions and Transversions
Surprisingly, when considered separately, both transitions and transversions at CpG sites displayed weak male mutation bias (table 2). For instance, for CpG sites (under inclusive definition) in the NCNR data set, α calculated for transitions and for transversions did not differ significantly (2.84 [95% CI: 2.60–3.08] vs. 2.67 [95% CI: 2.30–3.09]). Additionally, similarly to other studies (Ebersberger et al. 2002; Siepel and Haussler 2004), we found transversion rates to be ∼10 times higher at CpG sites than at non-CpG sites (0.0347 vs. 0.0035 and 0.0446 vs. 0.0041 for the inclusive and restricted site definitions, respectively, for autosomes in the NCNR data set).
Male Mutation Bias (from the X-autosome comparison) for Transitions and Transversions in the NCNR Data Set
Inclusive Site Definition | Restricted Site Definition | |||||
|---|---|---|---|---|---|---|
| Mutation Type | αCpG (95% CI) | αnon-CpG (95% CI) | αCpG (95% CI) | αnon-CpG (95% CI) | ||
| Transitions | 2.84 (2.60–3.08) | 7.93 (7.06–8.85) | 3.54 (3.21–3.94) | 7.12 (6.33–8.05) | ||
| Transversions | 2.67 (2.30–3.09) | 7.84 (6.70–9.15) | 3.57 (3.03–4.36) | 7.39 (6.35–8.78) | ||
NOTE.—Correction for ancient diversity was not applied.
Weaker male bias and higher rates for transversions at CpG sites than at non-CpG sites imply differences in the molecular mechanisms leading to transversions in these two site categories. Interestingly, this is consistent with the suggestion by Blake, Hess, and Nicholson-Tuell (1992) that transversions at CpG sites might result from spontaneous alkylation of guanine at the O-6 position (Fix, Koehler, and Glickman 1990). Such mutations, similar to the spontaneous deamination of methylated cytosine, are expected to be largely independent of DNA replication errors. Both transitions and transversions at non-CpG sites displayed strong male mutation bias (table 2), suggesting that these mutations result from errors in DNA replication.
Male Mutation Bias in CpG Islands
Male mutation bias was equally high for both CpG and non-CpG sites located within CpG islands (table 3), in contrast to what was observed outside CpG islands. In fact, α was approximately two times higher for CpG sites located within versus outside CpG islands (in the NCNR data set) when no or 2π correction for ancient diversity was applied (tables 1 and 3). This difference was not statistically significant due to the wide CIs of the α values for CpG islands (a consequence of the relatively small number of sites analyzed). When 4π correction for ancient diversity was applied, αCpG at CpG islands was similar to that outside CpG islands. This can be explained by potentially inaccurate diversity estimates for CpG sites located within CpG islands as such estimates were based on a small number of sites (Supplementary Table 3, Supplementary Material online).
Comparison of Male Mutation Bias (from the X-autosome comparison) Between CpG and Non-CpG Sites Located Within CpG Islands
Correction for Ancient Diversity | Inclusive Site Definition | Restricted Site Definition | ||||
|---|---|---|---|---|---|---|
| αCpG (95% CI) | αnon-CpG (95% CI) | αCpG (95% CI) | αnon-CpG (95% CI) | |||
| No | 6.91 (2.66–65.3) | 5.96 (2.45–83.9) | 8.93 (2.91–∞) | 7.72 (2.11–∞) | ||
| 2π | 4.56 (1.82–20.0) | 5.57 (2.02–∞) | 5.57 (1.96–∞) | 7.58 (1.44–∞) | ||
| 4π | 2.87 (1.10–9.56) | 5.02 (1.53–∞) | 3.36 (1.16–61.7) | 7.38 (0.89–∞) | ||
High male mutation bias at CpG sites located within CpG islands is consistent with the low degree of methylation and, as a result, the more replication-dependent origin of mutations at such sites. Unlike in the rest of the genome, in CpG islands CpG sites tend to be unmethylated (Cross and Bird 1995). Thus, the main source of mutations at such sites is replication errors and not spontaneous deamination of methylated cytosines. We cannot, however, exclude the possibility that CpG islands investigated in the present study were affected by selection.
Male Mutation Bias for All Sites Depends on the Proportion of CpG Sites
To directly compare our results with those of other studies, we investigated male mutation bias considering all (both CpG and non-CpG) sites (table 4). The resulting α from the X-autosome comparison (which is the most reliable) in the filtered data set was 7.58, 6.92, and 6.11 when no, 2π, and 4π correction for ancient diversity were applied, respectively. Thus, the magnitude of male mutation bias calculated here was not significantly different from most previous estimates (Shimmin, Chang, and Li 1993; Chang, Hewett-Emmett, and Li 1996; Huang et al. 1997; Makova and Li 2002), but it was significantly higher than the estimates calculated by Bohossian, Skaletsky, and Page (2000) and Lander et al. (2001). The potential causes of a low male bias in the latter two studies have been discussed elsewhere (Li, Yi, and Makova 2002). The α value calculated here from the X-autosome comparison, uncorrected for ancient diversity, was not significantly different from that reported by Ebersberger and colleagues (2002), who investigated a smaller sample of human-chimpanzee alignments. However, when correction for ancient diversity was applied (4π), αX/A reported here was significantly higher than that reported in the study of Ebersberger et al.(2002). This can be explained by different diversity values used for correction. The α values calculated in our study from the Y-X and Y-autosome comparisons were significantly higher than those obtained by Ebersberger et al. (2002).
Primate Male Mutation Bias for All Sites
Taxa | Chromosome | Length Analyzed | Correction for Ancient Diversity | α (95% CI) | Reference |
|---|---|---|---|---|---|
| Humans and chimpanzees | X/A | A total of 2.0 Gb on three types of chromosomes (Supplementary Table 1, Supplementary Material online) | None | 7.58 (7.04–8.20) | Filtered data set from this study |
| 2× | 6.92 (6.38–7.58) | ||||
| 4× | 6.11 (5.58–6.78) | ||||
| Y/X | None | 2.68 (2.50–2.89) | |||
| 2× | 4.03 (3.67–4.43) | ||||
| 4× | 8.24 (7.01–9.84) | ||||
| Y/A | None | 1.77 (1.64–1.94) | |||
| 2× | 3.04 (2.70–3.46) | ||||
| 4× | 11.2 (8.04–17.6) | ||||
| Humans and chimpanzees | X/A | A total of 1.9 Mb on three types of chromosomes | None | 5.4 (3.7–8.6) | Ebersberger et al. (2002) |
| 1× | 4.8 (3.3–7.6) | ||||
| 4× | 3.2 (2.2–4.9) | ||||
| Y/X | None | 1.9 (1.7–2.2) | |||
| 1× | 2.1 (1.8–2.4) | ||||
| 4× | 2.8 (2.3–3.4) | ||||
| Y/A | None | 1.3 (1.2–1.5) | |||
| 1× | 1.5 (1.3–1.7) | ||||
| 4× | 2.6 (2.2–3.2) | ||||
| Humans | Y/X | 1.6 Mb on X and 0.4 Mb on Y | None | 2.1 | Lander et al. (2001) |
| Humans and chimpanzees | Y/X | 39 kb | None | 1.70 (1.15–2.87) | Bohossian, Skaletsky, and Page (2002) |
| Higher primates | Y/A | 10 kb | None | 5.25 (2.44–∞) | Makova and Li (2002) |
| Higher primates | Y/X | 1.1 kb | None | 5.14 (2.42–16.6) | Huang et al. (1997) |
| Higher primates | Y/X | 1.4 kb | None | 6.26 (2.63–32.4) | Chang, Hewett-Emmett, and Li (1996) |
| Higher primates | Y/X | 0.9 kb | None | 4.20 (2.20–10.0) | Shimmin, Chang, and Li (1993) |
We found that the male mutation bias calculated for all sites together critically depends on the proportions of CpG sites in the chromosomes compared. Our original observation was that α for all sites was sometimes higher than both αnon-CpG and αCpG (tables 1 and 4). For instance, without correction for ancient diversity, α calculated for all sites in the filtered data set using X-autosome comparison was 7.58, while αnon-CpG and αCpG were only 6.46 and 2.90, respectively (under inclusive definition). This seems counterintuitive as one might expect α for all sites to have a value intermediate between αnon-CpG and αCpG. However, the observation is easily explained by modeling how α for all sites depends on the proportion of CpG sites on different chromosomes (see Methods; fig. 1). For instance, if we assume the proportion of CpG sites to be equal (or nearly equal) between X and autosomes, α for all sites does indeed have an intermediate value between αnon-CpG and αCpG. On the other hand, if we assume that the proportion of CpG sites differs between the two types of chromosomes, α for all sites can be either higher or lower than both αnon-CpG and αCpG. In our data, the proportion of CpG sites in chromosome X was substantially lower than in autosomes (1.68% vs. 1.99% for the filtered data set), resulting in higher α for all sites than for non-CpG or CpG sites. This suggests that for all sites, only α values estimated from loci with similar proportions of CpG sites can be directly compared. Alternatively, the male mutation bias can be compared separately for CpG sites and for non-CpG sites even between loci differing in CpG content.
Conclusions
For nucleotide substitutions at non-CpG sites and CpG sites within unmethylated CpG islands, as well as for small insertions and deletions (Makova, Yang, and Chiaromonte 2004), the magnitude of male mutation bias appears to be similar to the male-to-female ratio in the number of germ line cell divisions. This suggests that these mutations result primarily from errors in DNA replication. However, substitutions at CpG dinucleotides have a lower male mutation bias. This is consistent with spontaneous, replication-independent deamination of methylated cytosines being the major molecular mechanism for most CpG mutations. Our study indicates that male mutation bias is nonuniform in the primate genomes and depends on the type of mutation under investigation. Although here the mechanism of CpG mutations was known, this study illustrates how male mutation bias phenomenon can be used to infer the mechanism of mutations for which such knowledge does not exist. Different proportions of CpG sites at different loci might explain substantial variation in the estimates of primate male mutation bias among studies.
Here, male mutation bias was investigated by comparing humans with our closest relatives, chimpanzees. Studying such closely related species required correcting the observed divergence for ancient diversity and making assumptions about the population size in the common ancestor. With the sequencing of the macaque genome approaching completion, we look forward to comparing our estimates of male mutation bias based on human-chimpanzee alignments to the corresponding estimates from human-macaque alignments. Additionally, using human-chimpanzee-macaque three-way alignments will allow to polarize CpG→TpG versus TpG→CpG mutations and employ neighbor-dependent substitution models (Hwang and Green 2004; Siepel and Haussler 2004).
One of the limitations of the present study is the low number of high-quality sites currently available for the chimpanzee Y chromosome. A targeted sequencing of the chimpanzee Y chromosome will aid in obtaining more reliable estimates of male mutation bias for the Y-X and Y-autosome comparisons. Even though similar α values were obtained for non-CpG sites from the three comparisons (X/A, X/Y, and Y/A), we cannot completely eliminate the possibility that replication-independent factors might act differently on different chromosomes and contribute substantially to the evolutionary rates for X, Y, and autosomes. One of these factors could be selection for a lower mutation rate on the X chromosome due to a hemizygote state of deleterious recessive mutations in males, as suggested by McVean and Hurst (McVean and Hurst 1997), although this was later disputed (Ellegren and Fridolfsson 1997; Makova and Li 2002). Additionally, if recombination is indeed mutagenic (Lercher and Hurst 2002), this would lead to a lower mutation rate on chromosome X than on autosomes because chromosome X has a lower recombination rate than autosomes do (Kong et al. 2002). However, according to our results this is unlikely: we still observed higher divergence in autosomes than in chromosome X after accounting for variation in recombination rate and GC content, which supports the male-driven evolution hypothesis.
Manolo Gouy, Associate Editor
We are thankful to Ines Hellmann for providing data on 3-Mb windows, to Webb Miller for his advice about genomic alignments, to Svante Paabo for his suggestion to study CpG islands, to Tarjei Mikkelsen for his help at the earlier stages of this project, to Steve Schaeffer, Ines Hellmann, Cathy Riemer, Paula Goetting-Minesky, and Erika Kvikstad for critical reading of the manuscript. We thank the Chimpanzee Sequencing and Analysis Consortium for including us in the analysis team and all the groups in the consortium who produced data and made it publicly available. Further, we want to thank the members of the Baylor College of Medicine Human Genome Sequencing Center and the Broad Institute of MIT and Harvard for generation and early release of the DNA sequence data used to derive the estimates of human diversity in this study. This study was supported by National Institutes of Health grant R01-GM072264 and start-up funds from the Penn State Eberly College of Science to K.D.M.
References
Altshuler, D., V. J. Pollara, C. R. Cowles, W. J. Van Etten, J. Baldwin, L. Linton, and E. S. Lander.
Anagnostopoulos, T., P. M. Green, G. Rowley, C. M. Lewis, and F. Giannelli.
Axelsson, E., N. G. Smith, H. Sundstrom, S. Berlin, and H. Ellegren.
Bartosch-Harlid, A., S. Berlin, N. G. Smith, A. P. Moller, and H. Ellegren.
Batzer, M. A., and P. L. Deininger.
Begun, D. J., and C. F. Aquadro.
Berlin, S., and H. Ellegren.
Bestor, T. H.
Blake, R. D., S. T. Hess, and J. Nicholson-Tuell.
Bohossian, H. B., H. Skaletsky, and D. C. Page.
Chang, B. H., D. Hewett-Emmett, and W.-H. Li
Charlesworth, B., and D. Charlesworth.
Chen, F. C., and W. H. Li.
Cheung, J., X. Estivill, R. Khaja, J. R. MacDonald, K. Lau, L. C. Tsui, and S. W. Scherer.
Ebersberger, I., D. Metzler, C. Schwarz, and S. Paabo.
El-Maarri, O., A. Olek, B. Balaban, M. Montag, H. van der Ven, B. Urman, K. Olek, S. H. Caglayan, J. Walter, and J. Oldenburg.
Ellegren, H., and A. K. Fridolfsson.
Fischer, A., V. Wiebe, S. Paabo, and M. Przeworski.
Fix, D. F., D. R. Koehler, and B. W. Glickman.
Hardison, R. C., K. M. Roskin, S. Yang et al. (16 co-authors).
Huang, W., B. H. Chang, X. Gu, D. Hewett-Emmett, and W. Li.
Hwang, D. G., and P. Green.
Kong, A., D. F. Gudbjartsson, J. Sainz et al. (16 co-authors).
Lander, E. S., L. M. Linton, B. Birren et al. (249 co-authors).
Lercher, M. J., and L. D. Hurst.
Lercher, M. J., E. J. Williams, and L. D. Hurst.
Li, W. H.
Makova, K. D., and W. H. Li.
Makova, K. D., S. Yang, and F. Chiaromonte.
Malcom, C. M., G. J. Wyckoff, and B. T. Lahn.
McVean, G. T., and L. D. Hurst.
Meunier, J., and L. Duret.
Meunier, J., A. Khelifi, V. Navratil, and L. Duret.
Mikkelsen, T. S., L. W. Hillier, E. E. Eichler et al. (67 co-authors).
Miyata, T., H. Hayashida, K. Kuma, K. Mitsuyasu, and T. Yasunaga.
Monk, M.
———.
Nachman, M. W., and S. L. Crowell.
Ptak, S. E., A. D. Roeder, M. Stephens, Y. Gilad, S. Paabo, and M. Przeworski.
Ruvolo, M.
Schwartz, S., W. J. Kent, A. Smit, Z. Zhang, R. Baertsch, R. C. Hardison, D. Haussler, and W. Miller.
Shimmin, L. C., B. H. Chang, and W. H. Li.
Siepel, A., and D. Haussler.
Skaletsky, H., T. Kuroda-Kawaguchi, P. J. Minx et al. (40 co-authors).
Smith, N. G., and L. D. Hurst.
Vogel, F., and A. G. Motulsky.
Waterston, R. H., K. Lindblad-Toh, E. Birney et al. (156 co-authors).
Yoder, J. A., C. P. Walsh, and T. H. Bestor.
Author notes
*Department of Computer Science and Engineering, Penn State University; †The Center for Comparative Genomics and Bioinformatics, Penn State University; ‡Department of Statistics, Penn State University; §Computational Biology and Bioinformatics, Broad Institute of MIT and Harvard, Cambridge, Massachusetts; ∥Department of Health Evaluation Sciences, Penn State University; and ¶Department of Biology, Penn State University
